
chubbs
-
Posts
3,913 -
Joined
-
Last visited
Content Type
Profiles
Blogs
Forums
American Weather
Media Demo
Store
Gallery
Posts posted by chubbs
-
-
A less sarcastic take.
-
-
-
-
21 hours ago, ChescoWx said:
When in doubt tell us what you feel living here for 40 years....I will stick to the actual data that certainly shows a warming trend but nothing we haven't seen before here in the county.
I've been measuring temperatures locally for for 40 years, trust me its warming. Its warming faster at your house than the "actual data" you have posted in this thread. All the technically sound analyses of local data show strong warming. You are the only guy who thinks it was warmer in the 1940s than current in this area. If you think you have a better analysis than the experts publish your data in a technical forum - challenge the experts.
-
21 hours ago, ChescoWx said:
Per Charlie "The coop stations have decade-to-decade changes which are much larger than the climate trend, which makes finding the climate signal difficult using raw station data." Code speak for the Chester County NWS COOP data does not support the warming hypothesis and instead supports the normal cyclical pattern of climate changes. Climate change is of course a constant and normal.
Don't try to speak for me, If analyzed properly. the Chester County COOP data fully supports consensus climate science. Living here for 40 years I can attest to the county's strong warming trend. Like I have said before. You are going to be the last person to detect local warming using observations.
-
Here is a plot of the decade temperatures from Chesco's table. Much more of a shotgun blast than the long-term climate sites. The coop stations have decade-to-decade changes which are much larger than the climate trend, which makes finding the climate signal difficult using raw station data.
Note also that many coop stations had big temperature drops from the 1940s to the 1960s or 1970s as stations were modernized. One source of error before modernization is the coop use of mercury max/min thermometers which were subject to time of day bias. Stations with hourly reporting avoided this error. Fortunately there are many local stations and the coop stations were modernized at different times, so station updates are easily identified and corrected by comparing nearby stations using bias adjustment software. Of course, if you don't want to find the climate signal by all means use the raw coop data.
-
 1
1
-
-
-
3 hours ago, ChescoWx said:
Only if NOAA applies adjustments - my data is all of the available Chester County PA data clean and not adjusted. What you show above is not clean data. Your data is wrong as it shows below 51 degrees for Chester County in the 1890's. However the actual NWS COOP data shows the County average was actually 52.8. So you have an adjusting cooling that contaminates the data
Its more than the bias adjustment. Coatesville raw data (3 separate stations) has exactly the same warming rate as the Philadelphia airport since 1970, roughly3.5F. You have obscured the warming by mixing in poor quality stations and changing the station mix from decade to decade. Including adding in your own house (EN), which you picked for its cold, snowy location.
-
 1
1
-
-
4 hours ago, ChescoWx said:
Finally overlaid the PHL weather observations from the 1890's vs. all of the available NWS Coop sites averages by decade for Chester County PA (PHL in Red)....unsurprisingly little warming in the suburbs....but once we get to the UHI Airport (just a little over 20 air miles east of Chester County) we are off to the warming races. Look at how the variance is rapidly growing! But no worries let's let our local ABC outlet continue to show only climate data from the PHL Airport since 1970.
Shows how misleading your analysis is. Per NOAA Chester County has warmed by roughly 3.5F since the 1890s. Note that the Philly obs moved to the airport in 1940, so there is less heat island impact at the end of the Philly record than the beginning.
-
 1
1
-
-
19 hours ago, bluewave said:
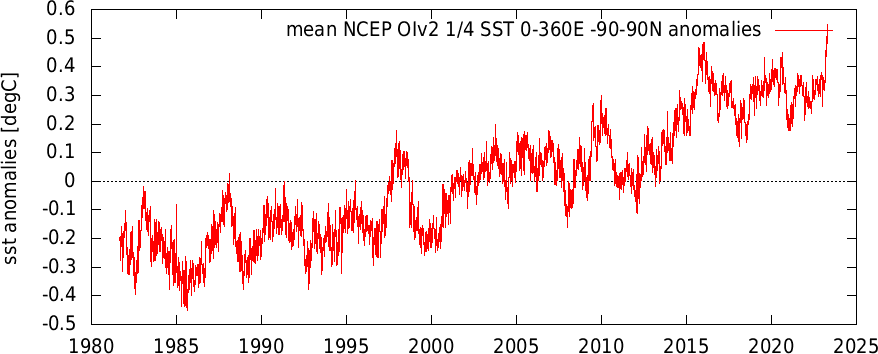
Simons was one of the authors on the paper with Hansen that you posted. So you would have to ask him about his analysis. I think you mean January 2020 when the steep decline in sulfur emissions occurred. There has been a SST increase since January 2020 . But the models are all over the place on how much shipping reducing aerosols impacts the climate. There is quite a range. As for the current SST spike this month, hard to know exactly how much contribution other individual factors are having since we are near the end of the La Niña. The Tonga eruption may have also contributed.
11 hours ago, csnavywx said:Eeehhhh. Don't be so quick to dismiss this, imo. There was an immediate upswing in EEI and SST in 2020 over both the NPac and NATL. The EEI signal is still very much there.
Some of this warming is probably due to Nina influence on the mid-latitudes, but once you account for that there's still a (large) residual there that I don't think can be easily accounted for. Plus, why Jan and not Sept when the impact of aerosols and time lagged (inertia induced) solar heating is maximized?
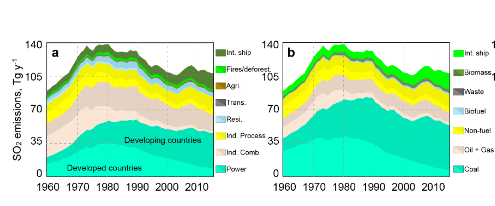
Agree that the marine sulfur rules contribute to warming, but not convinced they are currently a major factor considering all the other factors contributing to warming. Global SO2 emissions peaked around 1980, as air pollution became an increasing concern. So declining SOx has been contributing to increased forcing for a while; and, we'd have a big forcing imbalance today even if marine sulfur emissions were uncontrolled. I'm betting on the reduction in nina-related upwelling as being the major cause of the recent SST spike. In any case we are going to have to overcome declining SOx emissions going forward. That's the Faustain bargain.
-
22 hours ago, bluewave said:
Reduction in shipping aerosols may have contributed to the record global SSTs we are currently experiencing.
This is not a technically sound analysis. SO2 has a few days to two week lifetime, so the impact of the marine sulfur regulation would have been felt quickly in January 2000. The timing is off for the recent spike in SST to be closely associated with ship SOx emissions.
-
13 hours ago, GaWx said:
https://www.cfact.org/2023/04/02/the-hurricane-forecast-dilemma-and-warming/
The part of this that I'd to hear comments about is this:"...the rapid rise of co2 began in the 1950s.
Yet you can also see SSTs. rose little in that time, Co 2 could not be affecting temperatures.
Underwater Volcanic activity began its increase in the 80s with the more rapid seismic spreading taking off in the 90s."
Here are my questions:
1. Did the rapid rise in CO2 really begin in the 1950s? The graph he shows still looks pretty flat in the 1950s and still rather tame in the 1960s.
2. Did the global mean SSTs really rise little until 1991? If so, why did it take that long? Did the level of sulfates have anything to do with this?
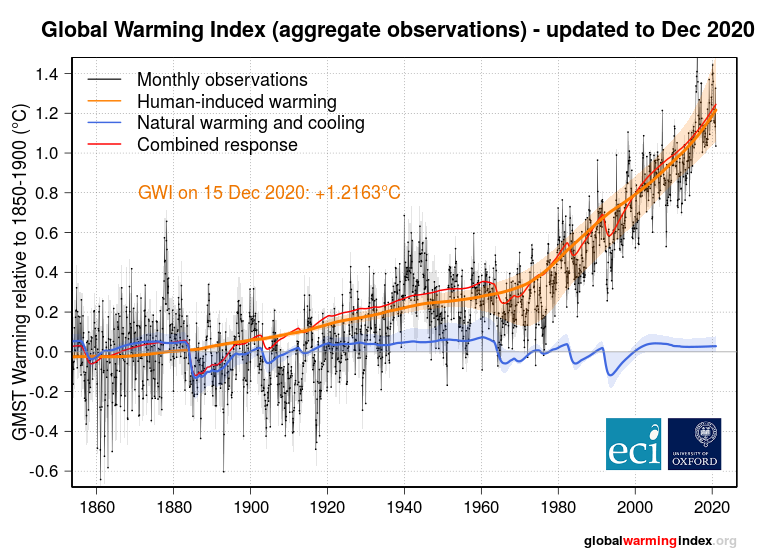
More BS from JB. You are on the right track with #2, Sulfate and other aerosols offset the warming impact of CO2 and GHG before 1970. Since 1970 man-made climate forcing and global temperatures have ramped together. Very close correlation between net man-made forcing and global temperature (and SST).
-
 2
2
-
 1
1
-
-
On 3/28/2023 at 8:28 AM, chubbs said:
30-year running average snowfall for some Northeast sites, focusing on I95. Plotted on a log scale, to highlight percentage changes between sites. Table below shows changes in current 30-year mean vs mean in 1970, 1990 and 2000. The sites with the lowest snow are in decline. Further north the picture is mixed, coastal I95 has increased at the expense of the interior. I'd expect declining snow to spread slowly and unevenly north with time. Note that we only have snowfall information for our cooler past.
Ooops, first posting had 20-year running average instead 30-year as labeled. I have subbed in the 30-year values. Doesn't change the major trends.
-
30-year running average snowfall for some Northeast sites, focusing on I95. Plotted on a log scale, to highlight percentage changes between sites. Table below shows changes in current 30-year mean vs mean in 1970, 1990 and 2000. The sites with the lowest snow are in decline. Further north the picture is mixed, coastal I95 has increased at the expense of the interior. I'd expect declining snow to spread slowly and unevenly north with time. Note that we only have snowfall information for our cooler past.
-
 3
3
-
-
7 hours ago, George001 said:
I’m curious to when we can expect New England winters to become snowless due to climate change. There’s growing evidence that the warmth is starting to win out in the mid Atlantic and that’s going to happen farther north as well as climate change continues to accelerate. Its only a matter of time before areas as far north as Boston become nearly snowless at some point during most of our lifetimes. That almost seems like a certainty, the real question is how fast will this happen.
My two cents - That depends on us. Feasible to get off fossil fuels in the next three decades, which would end the warming. More foot dragging--> less winter
-
 1
1
-
-
11 hours ago, csnavywx said:
Speaking of momentum:
https://journals.plos.org/plosone/article?id=10.1371/journal.pone.0237672
Probably one of the most interesting papers I've read in some time.
Presents the issue as one of a giant momentum trap that's not easy to maneuver out of. Adding RE (renewable energy) simply grows the entire system of civilizational networks, growing the entire pie (including the fossil part) as you would a snowflake if you added water vapor to the environment around the branches (the facet competes with them but nevertheless still benefits from an expansion of the branches). Efficiency gains do nothing to decarbonize on a global scale because they are used for growth. Direct replacement possible but not easy because of offsetting network effects. Slowing its growth via constriction of energy consumption (like '09 GFC or '20 Covid) possible temporarily but causes big disruption and RE replacement efforts are often sidelined in favor of quick recovery. This growing "superorganism" does not like to be starved and will hurt everybody until it is properly fed again, so to speak.
As for global temperature, that kind of inertia argues for a continued expansion of EEI (earth energy imbalance) as we warm -- and that's exactly what we've seen. EEI continues to rip higher even after the last big ENSO cycle.
Meh. In the long-term CO2 concentrations are going to turn around and head back to 280 ppm no matter what our cumulative economic production is.
-
9 hours ago, GaWx said:
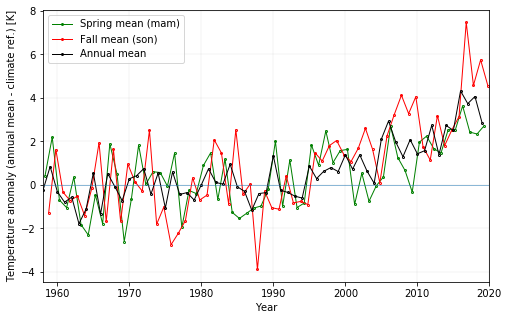
I'm posting some charts below showing the averaged Arctic mean temp anomalies by season and year for 80N to the pole.
This first one has winter, summer, and annual. Note that whereas the 5 year winter mean anomaly has warmed considerably (~6C) over the last 30 years due to GW, the winter mean has remained steady:
This next one has spring, autumn, and annual. Whereas the 5 year autumn has warmed ~5C over the last 30 years, spring has warmed only ~3C over the same period:So in summary due to GW over the last 30 years, here are the Arctic warmings based on 5 year averages:
winter 6C
autumn 5C
spring 3C
summer 0C
annual 3.5C
I find this quite interesting! Can anyone here explain these discrepancies between seasons? I'm especially curious about the autumn's 5C vs the spring's 3C.
So, with the Arctic winters having warmed 6C due to GW while the summers haven't warmed any, the mean difference from winter to summer there has shrunk 6C.
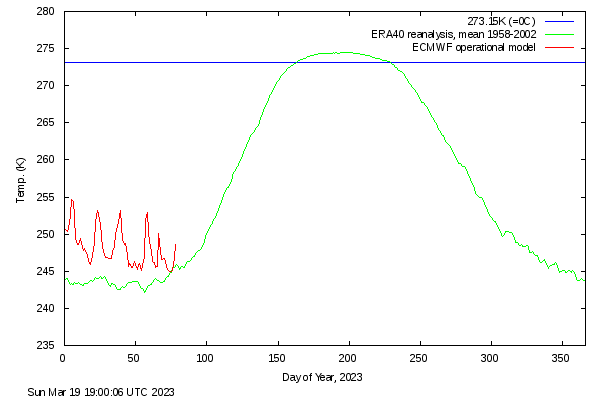
Aside: The last 6 years excluding 2022 have had their coldest in March, with 2023 just having occurred on March 16th as per this. Can a later average coldest of winter in the Arctic be explained from a GW perspective? Anyone know?This reflects properties of ice and water. In winter ice is thick, not much heat escapes through the ice, and arctic ocean acts like land with large temperature swings (same for early Spring). Water with ice in it has a temperature near the freezing point of water. One ice cube is enough to maintain near 32F water in a glass of ice water. Adding heat in summer results in less Arctic sea ice; but, as long as some ice remains the ocean water temperature stays near the freezing point of water, so arctic ocean temperature swings are much smaller in summer than in winter. In fall there is more open water to freeze with warming and freezing releases heat; and, ocean water has stored more solar energy due to darker surface in summer with less ice and/or wetter ice. So makes sense that fall warms faster than spring.
-
 4
4
-
 3
3
-
-
7 hours ago, LibertyBell said:
based on these high SST, how come we're not already in an el nino?
The warming is strongest in eastern enso regions 1+2, and 3. Per models will take a couple of months for 3.4 to reach 0.5C. There has also been warming of the tropical and sub-tropical Pacific outside the enso regions. Unusual to break SST records this early in a nino.
-
 1
1
-
-
-
-
16 minutes ago, ChescoWx said:We have already seen our high temperature for today at 52.3 degrees this morning at 4:58am. We are down to 43.8 here at 8am. Tonight should be the coldest night in a couple weeks and there is an increasing chance of some light snow across much of the county tomorrow late morning and afternoon. All models show some very minor snow accumulations during the day with temps struggling to pass the freezing mark. Warmer again by Sunday with snow quickly changing to rain on Monday.Records for today: High 74 (1985) / Low 0.3 below zero (2015) / Precipitation 2.47" (2016)/ Snow 5.5' (1907)
71.8F here. I broke the Chester County record.

-
On 2/8/2023 at 10:38 AM, Typhoon Tip said:
https://125yearsbelgica.com/2023/02/17/a-worrying-absence-of-sea-ice/
-
 1
1
-
-
22 hours ago, ChescoWx said:
Ocean of course cools and warms at a much different pace than land....I only address land temps for Chester County PA....
You are demonstrating your lack of knowledge. The ocean changes slower than land because heat can mix to great depths in the ocean resulting in vast heat capacity. Almost all the energy in the climate system is stored in the ocean. If the ocean is warming, heat energy is coming into the climate system faster than it is going out. I'll let you try to figure out why.
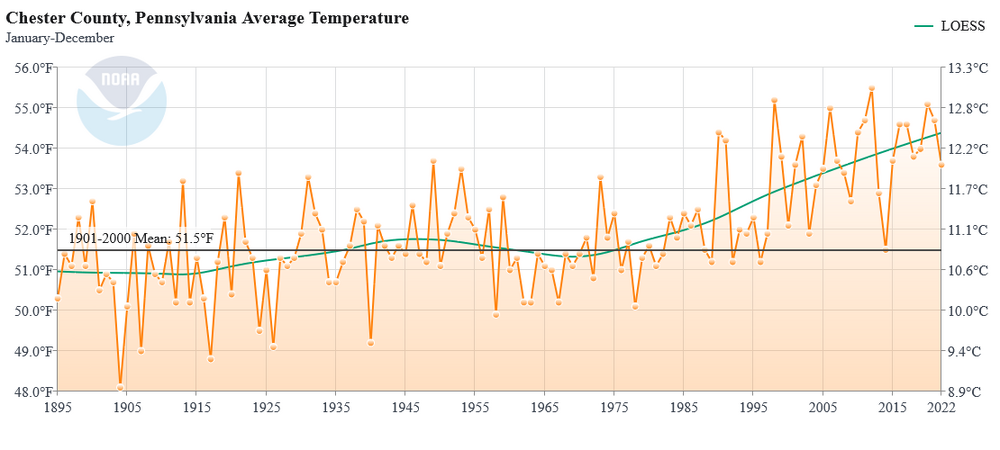
Good luck avoiding warming in Chester county under the current circumstances. Per chart below, Chester county is warming like the rest of the world, but a little noisier and faster, as expected based on its mid-latitude land location.
Its going to take roughly 1000 years for the entire ocean to equilibrate once the CO2 concentration stops rising. That's why your “cooling cycle” prediction in this decade is so laughable.
-
 1
1
-





Occasional Thoughts on Climate Change
in Climate Change
Posted
The sun has switched from a slight cooling to a slight warming factor in cycle 25.