

chubbs
-
Posts
3,908 -
Joined
-
Last visited
Content Type
Profiles
Blogs
Forums
American Weather
Media Demo
Store
Gallery
Posts posted by chubbs
-
-
19 hours ago, ChescoWx said:
Again there is nothing in there that shows the actual adjustments by month and year and the control rationale that were applied for those actual individual Chester County stations.
Sorry that's all I have. Here's a plot for Phoenixville from the GISS site. You can also download data in this plot. Notice that the Phoenixville adjustments are very different from Coatesville. Phoenixville has relatively large adjustments in the 1930s+40s and late80s through the mid-90s. Otherwise adjustments were small. This is a data driven process. Adjustments are determined solely by the raw data collected in the region. By dissing the adjustments you are dissing the raw data. With proper analysis, scientists can get much more information from the raw data than you can. A well proven method, stable for decades, and updated every month for 25,000 stations around the world.
Again skeptics have been complaining about the result for decades; however, the skeptic contribution to advancing science in the is area is zip, zero, nada. Not one good idea for improving the analysis of weather station data. Not one bias adjustment overturned based on scientific evidence. Good luck in being the first to succeed.
.png.bfbe0795e20762e75588dd3df8b4adbc.png)
-
 1
1
-
-
-
19 hours ago, ChescoWx said:
So Charlie you say "The southern and eastern sections of the county and/or at low elevation are over-represented". Coatesville is in a valley" So to correct this you adjust the average annual temperature to well below what was recorded at the coolest station of record....that is an interesting approach and will of course dampen all of that pesky 1930's and 1940's actual warming...
In most decades the bias-adjusted data for Coatesville is a close match for the NOAA county average. The bias-adjusted Coatesville data makes a good proxy for the NOAA county climate result. The Coatesville bias adjustments are largest before 1950 and small after 1970. The bias-adjustments are a good way of judging the quality of raw data. After 1970 the Coatesville raw data is perfectly fine for climate analysis. However this is not the case at other Chesco coop stations.
As I said above the adjustments are made to the station data based on other station data. All done automatically by software. The county average is calculated from the bias-adjusted station data, but not by simply averaging the data. As shown above, averaging would bias the result, since in many years available stations are often not representative of the county as a whole. Care is taken by NOAA to properly account for station location, and other characteristics. Temperature estimates are made on a 5 by 5 km grid across the entire country. The County, state and and other results are obtained from the gridded temperatures.
NOAA isn't trying to "scare" you, just getting the best climate result locally, nationally and globally.
-
4
-
-
19 hours ago, ChescoWx said:
Again lots of rehashed verbiage but where exactly is the detailed Chester County PA analysis that documents and supports the local adjustments made?. How exactly did they determine to chill each and every year from 1895 till the 2000's. For example why was the full year Chester County average for 1931 chilled by exactly 2.5 degrees.and 1932 by 2.34 degrees? Was a blanket State or Region general approximate adjustment determined and applied ad hoc to all of the actual observations? We seem to have plenty of country, US and World adjustments noted above but where exactly is the support for the Chester County PA adjustments? Can someone point me in that direction for that kind of detailed local data or is it not available? Thanks!
LOL you complain about the bias adjustments without knowing how they are done or why. If you paid better attention to the "rehashed verbiage" you would be much better informed. You can easily google up the information. The adjustments are made to the station data from other station data. County and other geographic averages are calculated from the adjusted station data. Below are some links. You can get plots of the individual station data at the GISS and Berkeley Earth links.
https://www.ncei.noaa.gov/access/metadata/landing-page/bin/iso?id=gov.noaa.ncdc:C00950
-
21 hours ago, ChescoWx said:
Well again Charlie tell us which stations are as you call them the "warmer parts of the county that were over-represented? they are in fact the only stations we have!! So how the heck are they over represented?? Below are in fact all of the available Chester County PA Stations during that time of greatest post hoc adjustments. While we had less stations we still have at least 4 NWS coop stations represented in the actual data. You will notice yet again that in 21 of these 23 years the NCEI Average temperatures was adjusted downward to below any and all stations in the county. The red numbers and line in the graph show the post hoc adjusted NCEI adjusted County average. Unsurprisingly Coatesville being the furthest NW station and with a bit more elevation ran coolest in most but not all years - but why then take the entire county down below even the coldest station during that time?
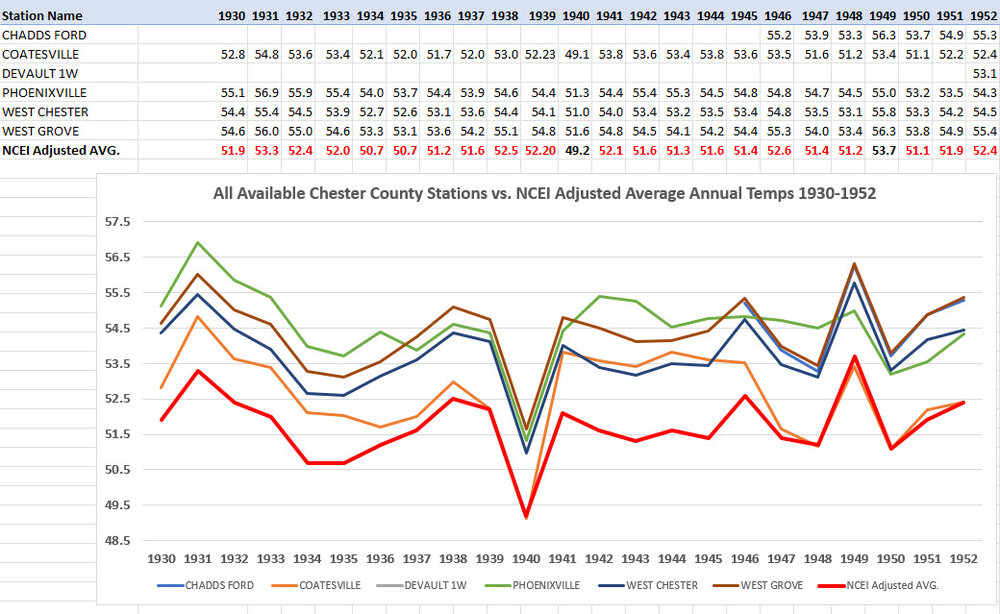
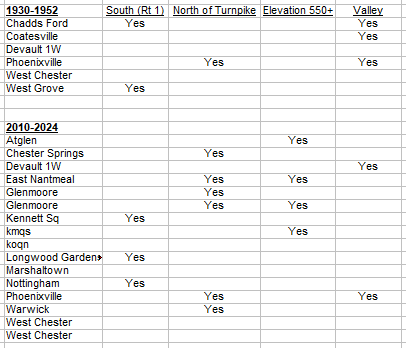
Which stations are from the warmer parts of the County? Chadds Ford, Phoenixville, Devault, West Chester and West Grove. The southern and eastern sections of the county and/or at low elevation are over-represented. Coatesville is in a valley, but at least it is centrally located in the County. Below is a comparison of the 1930-52 and 2010-24 stations you are using. The current set of stations has a much higher weighting of north of turnpike and high elevation. No wonder you can't find the warming that has occurred over recent decades. Most of the "adjustment" you are attributing to NOAA is just changes in your station population from year-to-year and decade to decade. Every time you sub in a station the nature of the station population changes. This is particularly important in the early decades when station numbers are low.
You can't separate out climate information without removing measurement inconsistency. Scientists have spent considerable effort in developing methods to remove inconsistency in station location, equipment and errors. This work is decades old and very successful. There is very high confidence in the climate temperature datasets prepared by NOAA and other agencies around the world. Funny/sad that you think you can do a better job by averaging raw data in a spreadsheet without any consideration of station characteristics or data consistency.
All of your criticism of the NOAA boils down to one thing. You don't like the NOAA answer. Now you don't even like your own Chescowx answer. Deniers/skeptics have been whining about temperature data for decades. However when it comes to scientific evidence its all talk and no action. Not a shred of scientific evidence has ever been produced. Meanwhile the scientific evidence for the warming we are experiencing in Chester County gets stronger every year, well documented by NOAA and other agencies.
-
2
-
 1
1
-
-
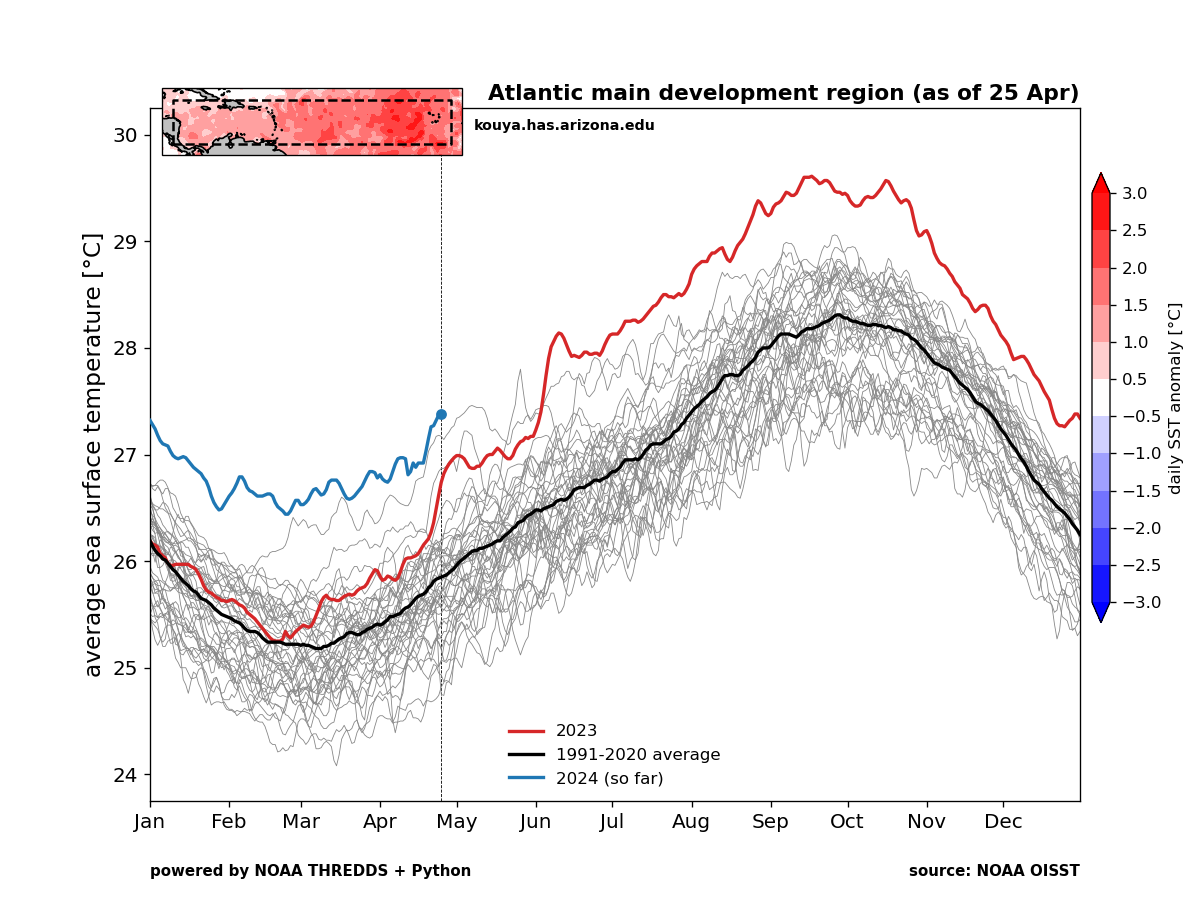
8 minutes ago, LibertyBell said:
What causes the global average to peak in late March-- is that because we have much more ocean over the Southern Hemisphere than the Northern Hemisphere?
Not sure, but that would make sense. There is a secondary peak in August.
-
1
-
-
16 hours ago, ChescoWx said:
Below shows the consistent pattern of post hoc adjustments we have seen before. With strong NCEI chilling adjustments in earlier decades and gradual warming adjustments as we move toward the current decade. Actual data is in blue the adjusted Chester County average according to NCEI is in orange. That orange line is certainly scarier looking....
Now you are giving us conspiracy theories. NOAA's climate data is widely used by industry and the general public and is well vetted by testing and comparison with other climate analyses. NOAA is the climate answer for our area.
The chart you posted shows how far off your latest “answer” for Chesco is. Not too bad since 2000, where most your data is clustered and you have a representative spread of stations across the county. Then increasingly too warm going back in time as your stations numbers decline and the warmer parts of the county tend to become over-represented.
You are the guy making improper adjustments. There is a big difference between your current answer for Chester County and what you were touting a couple of months ago. You have warmed the 1930s to 1990s by 1.4F. Guess a warming present demands a warmer past.
-
2
-
1
-
-
18 hours ago, ChescoWx said:
Your data is much too small for climate review for Chester County PA. My analytics encompasses all available 24 stations - see the below NWS COOP sites / NWS FAA and DEOS/MADIS sites along with the complete years of record. Also as always the data I show is never adjusted to chill the 1940's!

LOL ,It doesn't do you any good to have a lot of data if you don't know how to analyze it. "My data" is mainly your own Chescowx data. Now that it is showing enough warming to contradict your point of view you are disowning it. It obvious that you don't understand how to develop climate information from weather station data. There is strong correlation among weather stations in a region. The high quality stations in our area all show the same climate trend; which is well captured by NOAA. No need to dismiss the best stations when using the NOAA product.
One of the main benefits of a dense observing network is station inter-comparison; well used by NOAA and other scientists to develop climate information. The climate trends over recent decades in our area are well established.
-
1
-
-
20 minutes ago, LibertyBell said:
But isn't an increase what we would expect right now towards the latter part of spring? Granted it's much warmer than normal, but they should be going up.
Yes the Atlantic MDR should be going up gradually, peaking in late summer, while the global average peaks in late March. I was referring to the recent spike upwards in MDR temps over the past week or so.
-
1
-
-
2 hours ago, Bhs1975 said:
What year is that gray line near the 2024 line from?Don't know. Here's the site with the original chart (Kim Wood's)
-
 1
1
-
-
Yes it is surprising to see SST increasing recently. Atlantic MDR has reached early Aug temps.

-
16 hours ago, ChescoWx said:
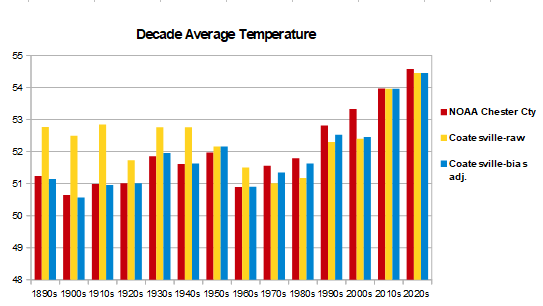
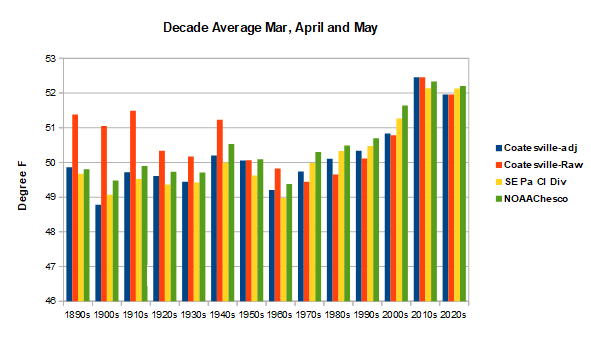
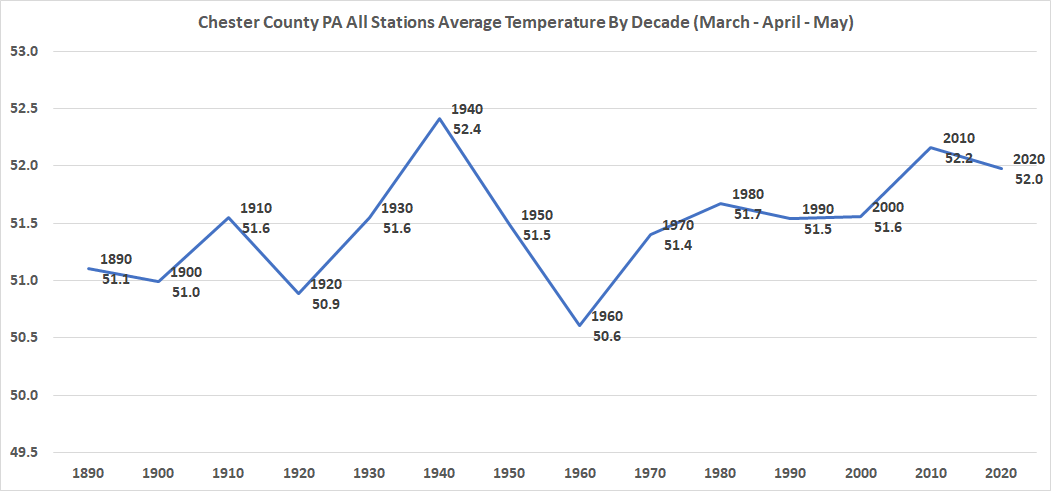
Below is an analysis of the average temperature by decade here in Chester County for the months March - April and May since the 1890's. The average temperature over these 132 years of records is 51.5 degrees. So far in the 2020's we are running about 0.5 degrees above the average. The 1940's were not surprisingly the warmest decade.
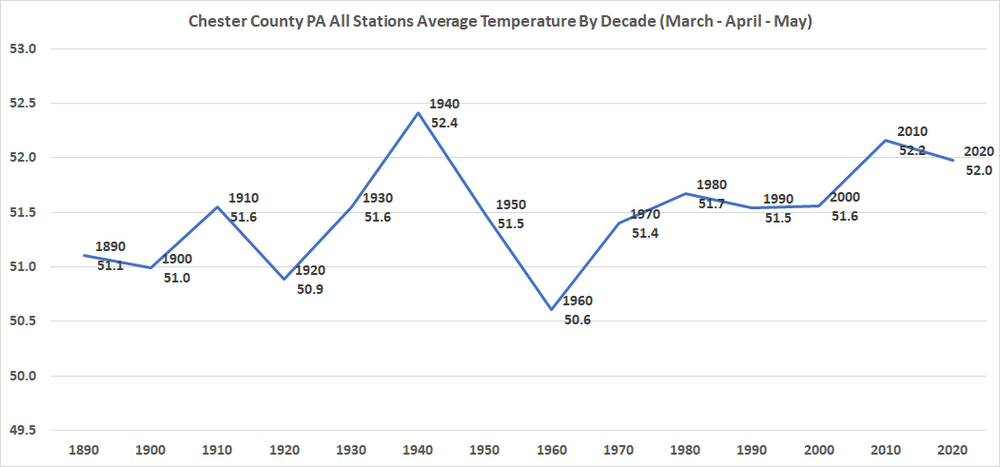
Not surprising that you get biased results. Your station mix (which you don't disclose) is changing from decade-to-decade and you aren't accounting for differences between stations in: elevation, latitude, sun exposure, equipment etc. The info you posted in the other thread indicated a relatively warm collection of local stations in the 1940s.
Long-term data from Coatesville (3 stations) doesn't show the 1940s as the warmest. Coatesville probably has the best long-term records in the county providing a more consistent basis for comparing decades. Note that bias adjustments don't have much impact on Coatesville decade averages after 1950. The Coatesville data agrees well with NOAA's climate analyses. NOAA removes the bias arising from an inconsistent collection of stations using standard methods that were developed decades ago.
Finally I'm not aware of other data showing that the 1940s were warmer. Cherry blossoms weren't coming out earlier in the 1940s for instance.
-
1
-
-
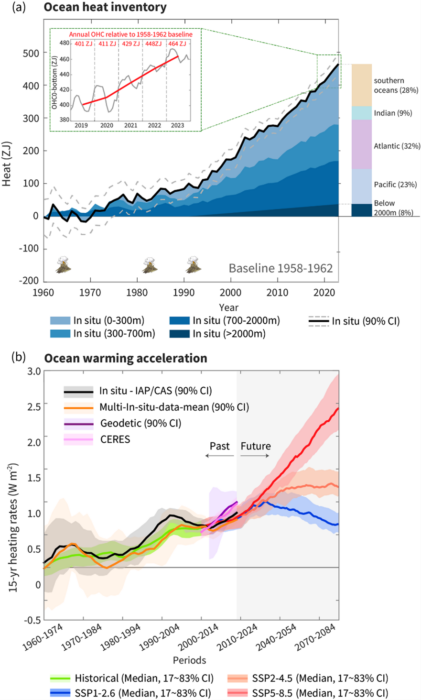
Another paper summarizing 2023 ocean warming with a comparison to other methods of estimating global heat imbalance. Ocean warming is accelerating. Reasonably good agreement among the methods considering the measurement uncertainty. Global heating rates are running above the worst case scenario (bottom graph). Why? - aerosols are coming down faster than projected due to air pollution control. This warming boost will last another decade or two unless CO2 emissions start to fall as well.
-
8 hours ago, FPizz said:
All I'm saying is that it is going to take many decades or even more to change. Every single thing in our lives depends on fossil fuels in some way. Even things that are "green", at some point in the process fossil fuels play a big role in that so called "green" product. Good luck trying to change it any time soon.
Even if you think of one of your hobbies, fishing. The pole, line, hook, lures; fossil fuels were used somewhere in the process in order to make all of that, ship it, etc. That is one tiny thing that would need wholesale changes.
Yes it will take decades to transition away from fossil fuels. Decades of emissions and increasing temperatures in the best of cases. We are committing ourselves to a warmer and warmer future.
-
1
-
-
-
19 hours ago, FPizz said:
Want to know why, because people are living longer than ever, mainly because of fossil fuels. Ever realize the temp hockey stick you can lay on top of the average age hockey stick and they match? It's going to be hard to convince the world to give up on fossil fuels since that industry is one of the top reasons we now don't die at age 40.
Fossil fuels won't provide the same economic benefits in the future that they did in the past, not even close. The best resources are increasingly depleted and climate costs are ramping. Gasoline doesn't cost of $3.50/gal because demand is exploding. We would need alternative energy sources without a climate crisis. An increasing number of countries, the US included, have declining CO2 emissions with a growing economy.
-
2
-
-
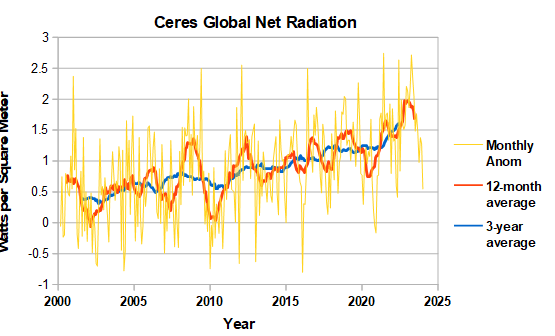
Ceres net radiation data has been updated through January. As expected in a strong nino, the radiation imbalance has been shrinking since last summer, as the warmer atmosphere increases outgoing radiation. The downcycle should run for a while longer; but, we have a ways to go to return to 2015/16 conditions.
-
1
-
-
13 hours ago, bluewave said:
There seems to be a few issues at hand here not expressly stated In this most recent debate.
First, an acceleration of global warming makes it unlikely that we will be able to cap warming at +1.5C or perhaps even +2.0C. Some scientists believe this could cause people to give up on finding possible solutions if we already surpassed this level. It’s one of the risks that the climate community took when targeting specific temperature level like +1.5C in all these reports put out over the years.
Second, faster warming could cause some to doubt the climate models in general which make some scientists uneasy since they have come to rely so heavily on them.
But even if the answer lies somewhere in the middle between Hansen and others, any acceleration of the warming rate is problematic in a world where we are still so reliant on fossil fuels to drive out current civilization.
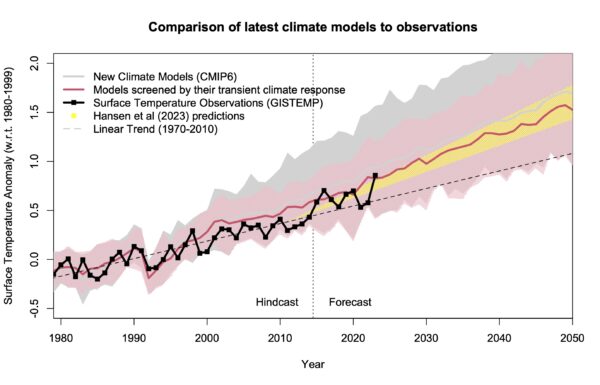
There is confusion about whether the warming rate is accelerating and/or climate sensitivity is higher than expected. An acceleration in the warming rate starting around 2010 is expected due to reductions in aerosol emissions. Per a recent Real Climate blog, Hanson's yellow cone is inline with CMIP6 model predictions. There is a large body of work on climate sensitivity, so will need multiple studies and sustained warming above the red line to move the needle. We will see.
One final comment: increased forcing from aerosol reduction is better than increased forcing from CO2 emission increases. Aerosol emissions are going to zero anyway. The acceleration has a shelf life on the order of decades before aerosols are depleted.. By pulling the aerosol reductions forward in time due to air pollution control we are giving ourselves a preview of our climate future. Maybe it will spur action. Not that we have placed ourselves in a good position, with warming accelerating just as we approach 1.5C warming; which means we are leaving our comfortable Holocene climate.
-
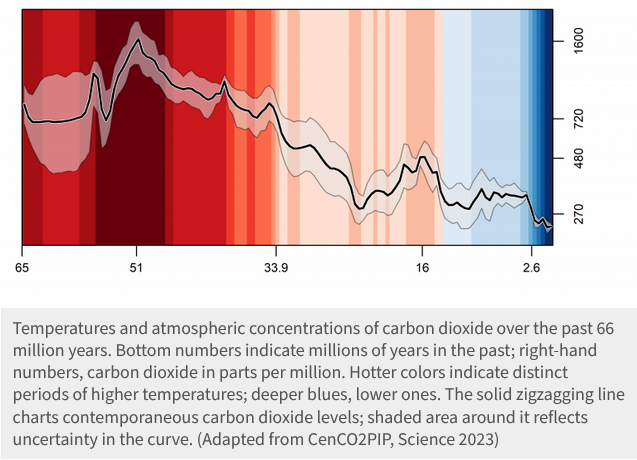
Funny, Chesco is helping make the "alarmist" case. Googling indicates we have the same CO2 concentrations today as 14 million years ago. Only the ocean and cryosphere, which are slow to adjust to higher CO2, are keeping us close to our old climate. The good news is that the ocean will take up CO2 if we get emissions under control. We aren't committed yet to going back 14 million years. Its up to us to decide how far back in time we want to go. One thing is certain though. Ignoring the problem is going to make the future more alarming, not less.
https://www.science.org/doi/10.1126/science.adi5177
-
1
-
-
15 hours ago, GaWx said:
Charlie,
1) This chart was posted by Chris in his thread on the Midwest warming hole: note the reduced warming or even slight cooling in much of the MW during summer vs most other areas. This is despite large increases in crop sizes.

2) From Midwest pro meteorologist Mike Maguire:“On the albedo of global greening absorbing more sunshine and warming the planet. I can debunk that myth quickly.
We know that the MOST warming is taking place in the coldest places and at the coldest times (higher latitudes during the Winter and at night).
Those are also the times when albedo from the sun has the LEAST impact.”
“The nights (with no sun) have been warming the most, days the least. Also, the driest locations with the lowest humidity are warming the most.
This is because of the radiation physics of CO2 and H2O and not albedo. In areas with the highest water vapor content, water vapor crowds out much of the CO2 absorption from the same bands of absorption. Some of the radiation absorption bands are already saturated from H2O in areas with very high dew points.
In drier areas........which includes ALL cold places, CO2 is able to absorb more long wave radiation because of the absence of H2O absorbing at the same bands.
There's no disputing this proven law of radiation physics!”
I agree that albedo effects from fertilization are not.as important as CO2 radiation effects or plant evapotranspiration, which is important in the case of midwest corn. On-the-other hand, don't think Maguire has debunked albedo effects either. CO2 fertilization has a relatively small climate effect that needs to be evaluated carefully to determine if it is positive or negative.
Found a paper (link below) which isolated the biophysical effects of CO2 fertilization on climate. CO2 fertilization had a net warming due to effect mainly due to the albedo effect of the northward advance of Boreal forests. Considered separately in the paper, increased CO2 sequestration would offset the albedo effect in the short-term but not in the long-term. In any case the climate effects of CO2 fertilization are small,and the radiation effects of CO2 are dominating. Note also that increasing CO2, increases atmospheric water vapor leading to a radiation effect that is in the same ballpark as the effect of increased CO2 alone.
https://www.tandfonline.com/doi/pdf/10.1111/j.1600-0889.2006.00210.x
-
26 minutes ago, ChescoWx said:
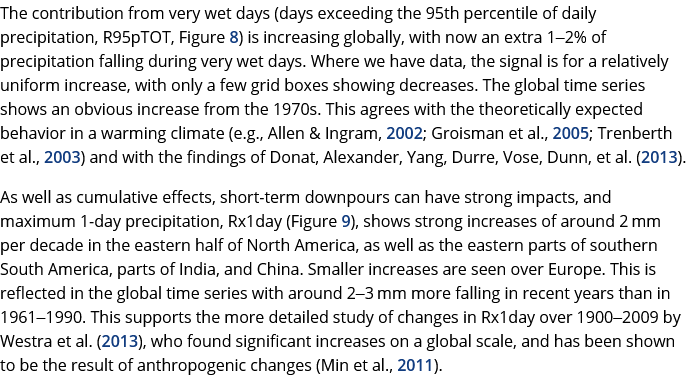
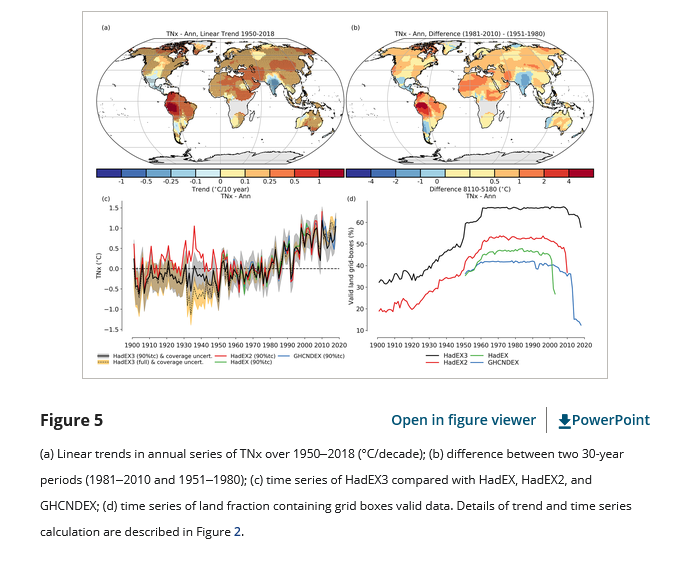
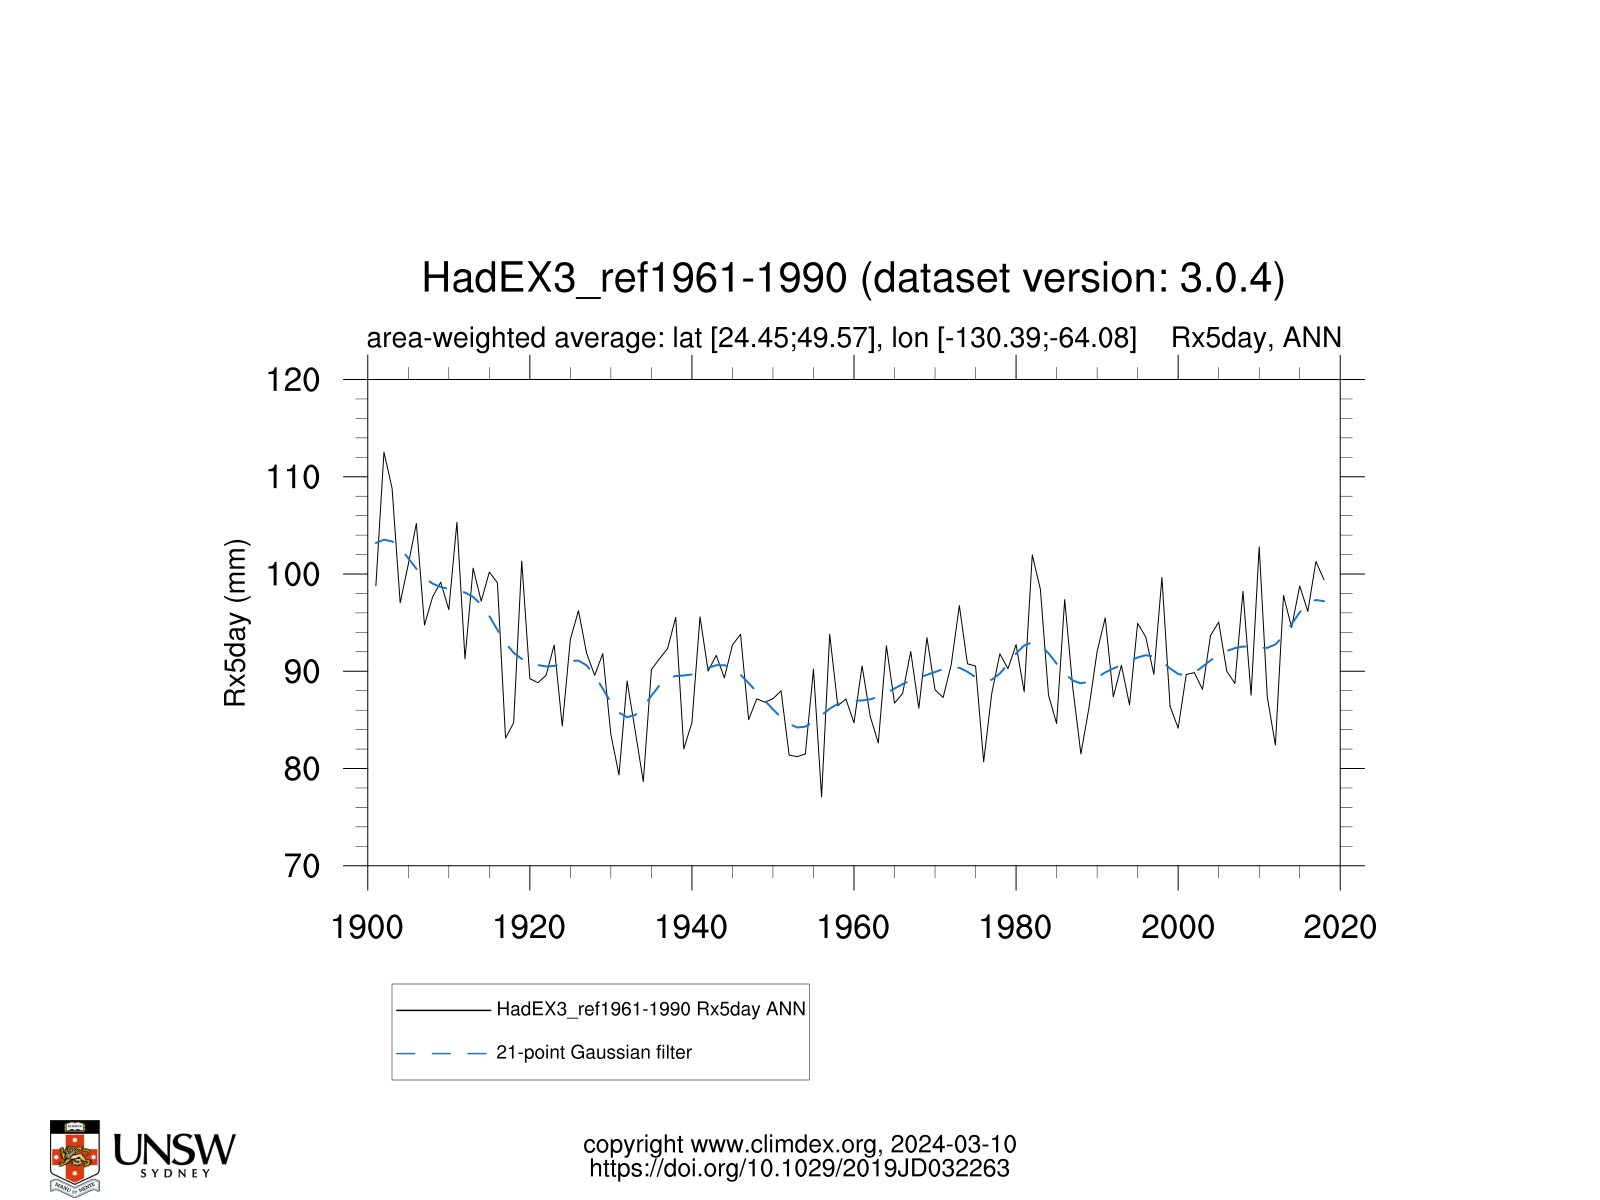
We are told by alarmists that warming of the climate is expected to increase the frequency and intensity of heavy rainfall events. One key measure of this used by climate models is the annual maximum 1 and 5-day maximum precipitation amounts (Rx1day and Rx5day, respectively). The results below indicate that while both the Rx1day and Rx5day have increased across the US since 1960....of course if we choose to go back far enough, rainfall extremes were higher than recent decades between 1901 and 1930 across both measures. Funny how weather history if we go back far enough....shows us all that is happening now has indeed occurred before. No climate emergency at all to see here!
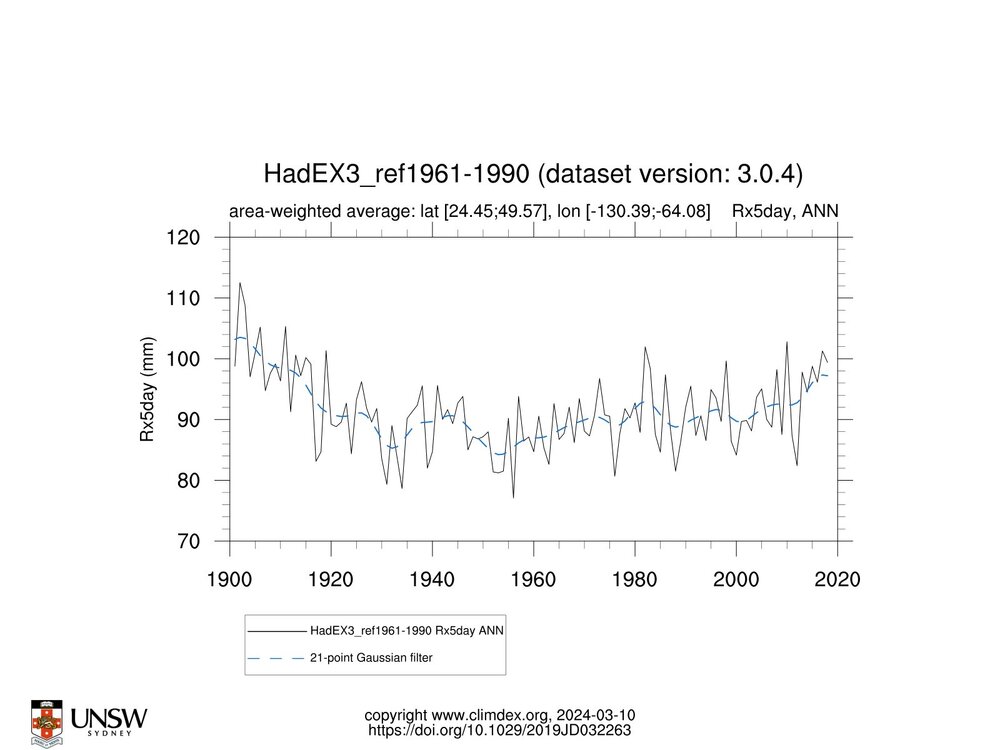
I don't know Paul, I get a different picture after checking the reference. For one thing I couldn't find the chart you posted. It must be from the supporting material. As for the body of the paper, it showed clear evidence for climate change in temperature and heavy precipitation. Below is a text snippet, a couple of charts and the paper link. This leaves me wondering where you get your information from.
https://agupubs.onlinelibrary.wiley.com/doi/10.1029/2019JD032263
-
1
-
-
31 minutes ago, ChescoWx said:
hey Charlie.....there is actually weather data before 1960.....some folks don't like that data - well unless we make some chilling adjustments as it does not support the non-stop warming story. The above charts I added do not omit the older data back in our last warming cycle that you likely forgot to add...
I have no problem going back before 1960. I'll go way back, but I'm not going to limit myself to a small slice of biased data. No. I want to look at all the data and use the best methods to analyze it. From the last IPCC report
-
2
-
1
-
-
50 minutes ago, Bhs1975 said:
So we would have to remove it using renewables and sequester it underground by using reactions to form limestone.
.Don't get me wrong there are many reasons to plant trees and trees produce a net cooling in many parts of the world. Once it is in the atmosphere removing CO2 will be costly and slow. Using renewables/batteries/electrification to not emit CO2 in the first place is by far the cheapest strategy, particularly with costs continuing to drop.
-
1
-
-
Related to the CO2 fertilization post above, the recent study below accounted for the albedo effect of planting trees. In many places around the world, planting trees causes warming, as increases in absorbed sunlight offset the benefit from CO removal.
https://www.nature.com/articles/s41467-024-46577-1
-
1
-

_X.png.976d06065e35da8540ddd707756af520.png)
Global Average Temperature 2024
in Climate Change
Posted