

chubbs
-
Posts
3,903 -
Joined
-
Last visited
Content Type
Profiles
Blogs
Forums
American Weather
Media Demo
Store
Gallery
Posts posted by chubbs
-
-
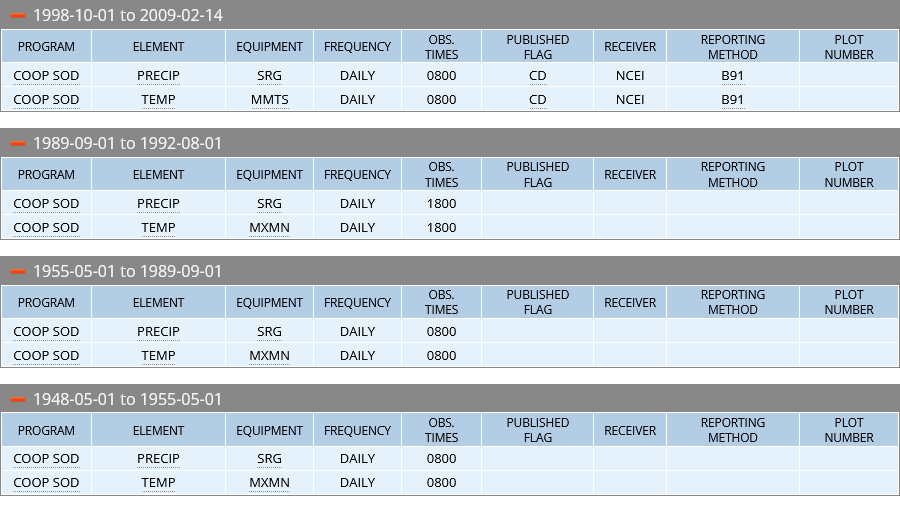
And there is more. Per NCDC, West Chester also changed the time of observation. At 8AM between 1952 and 1989, at 6PM between 1989 and 1992, and at midnight when a digital system was installed in 1998.
-
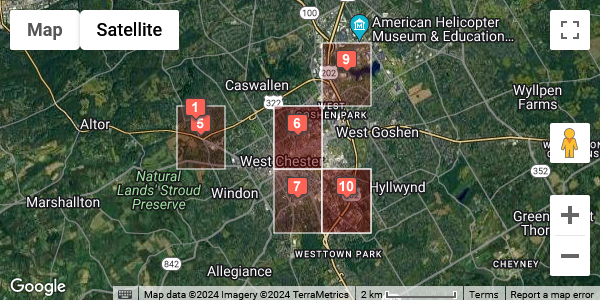
Per NCDC, West Chester also had several station moves. The map and station list below are screenshots from the NCDC site. Unfortunately there are no street addresses and the location information is only approximate. The West Chester station moved within the Borough of West Chester and nearby suburbs. Like Coatesville the last station appears to be the least rural (#1,#5) in a residential neighborhood just outside of town.

-
12 hours ago, ChescoWx said:
Below are all 5 sites used and their dates. Overall siting looks pretty consistent over a very short distance. It looks like the "warmest" relative observing site very well might have been the one near the steel mill plant from 1917 to 1930. Overall all of this Coatesville data observation moves clearly did not have much of an impressive material impact on these stations and more importantly on the overall averages for Chester County overall.

Thanks for the map. The rest of the response is short on evidence. Lets get into it.
First a couple of comments on the map. NCDC shows 6 sites, while you show 5. Perhaps that is why you don't show any site for 1947. Also several of your city locations don't match the street addresses listed by NCDC and posted above. Not sure that the details are that important. The last site from 1948-82 on Doe Run road is clearly more rural than the other sites.
“Overall siting looks pretty consistent over a very short distance”
No need to guess. Google earth shows the sites are different. We can see the impact of the moves in the observed temperatures. The timing of the moves after the war coincides with temperature changes.
“It looks like the “warmest” relative observing site very well might have been the one near the steel mill plant from 1917 to 1930”
Again no need to guess. The observations at Coatesville and nearby sites can provide a ranking. . I haven't taken a close look at it yet, except to see that the rural site is noticeably cooler. I've been telling you for years that Coatesville cooled relative to other sites after the war.
“Overall all of this Coatesville data observation moves clearly did not have much of an impressive impact on these stations and more importantly on the overall averages for Chester County overall”
A meaningless word salad. Its clear that the moves after the war had an impact on measured temperature that would also change your network average. Again you don't have to guess, just compare 1945 and 1948. More importantly the moves within and outside the city of Coatesville reinforce the evidence that has been piling up for weeks. You aren't doing a very good job of estimating Chester County's temperature change through the years. Meanwhile NOAA's bias adjustments are supported by hard evidence of changes at the COOP stations.
-
4 hours ago, ChescoWx said:
You did not answer my question.....
Not sure your question is relevant. Eyeballing the temperature chart Coatesville and nearby stations there wasn't any cooling in the 1940s that explains the drop at Coatesville, and the drop is mainly due to a change in low temperature. If you isolate the East Main street site by only looking at 1930-45, and, only look at the ten years after the move occurred. The night-time cooling effect is even larger. The results bounce around for other year selections but are always in the same direction.

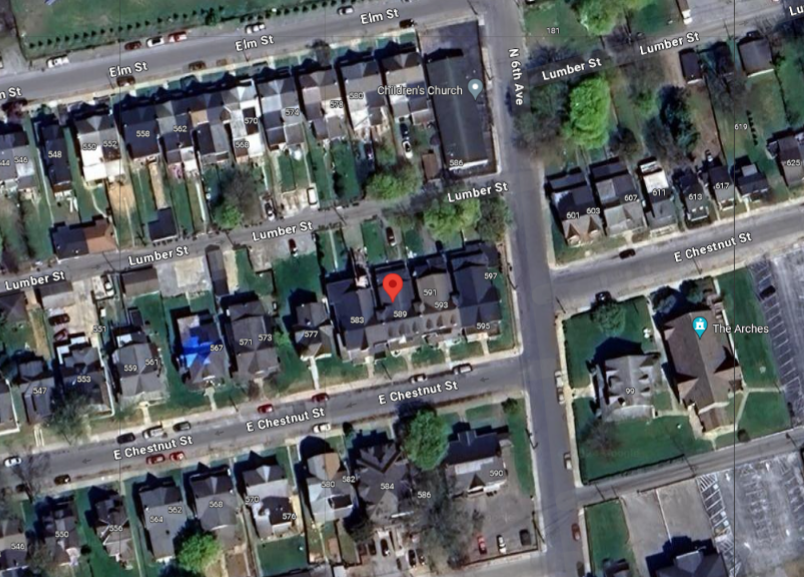
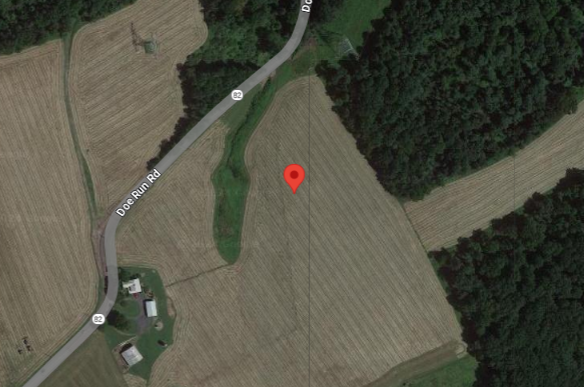
I have also added google earth views of the two sites using location info from NCDC. The sites are very different.
Coatesville 1930-1945
Coatesville 1948-82
-
44 minutes ago, ChescoWx said:
As you should know Charlie one station does not a trend make....So why did Phoenixville's nights chill even more than Coatesville when we compare that same time frame without a station movement there?? Maybe it was just a little chillier in the 1948 to 1960 period??

Here's the difference. Coatesville had two moves after the war and ended up in a more rural location. Coatesville temperatures dropped relative to other nearby stations clearly implicating the moves. Not sure why that's so hard for you to accept, you are always telling us important the urban heat island is.
-
1 hour ago, ChescoWx said:
Close only counts in checkers....Sounds like a certain pot calling the kettle black....LOL!!!!
Well, your not even close to getting our past climate right. Funny, for a guy who favors raw data you don't show us much. Just your network averages. There's a wealth of information in our raw coop data, that you are missing. For instance at Coatesville, when the station moved to a more rural area in 1948 the nights got cooler but the days stayed about the same. A nice example of the urban heat island effect.

-
 2
2
-
-
The nino put us on the elevator up, and the escalator down. Still too early though to see what floor we are going to end up on.
")
-
2
-
 1
1
-
-
18 hours ago, ChescoWx said:
Charlie, no need for an apology to anyone as I only analyze the actual NWS data.
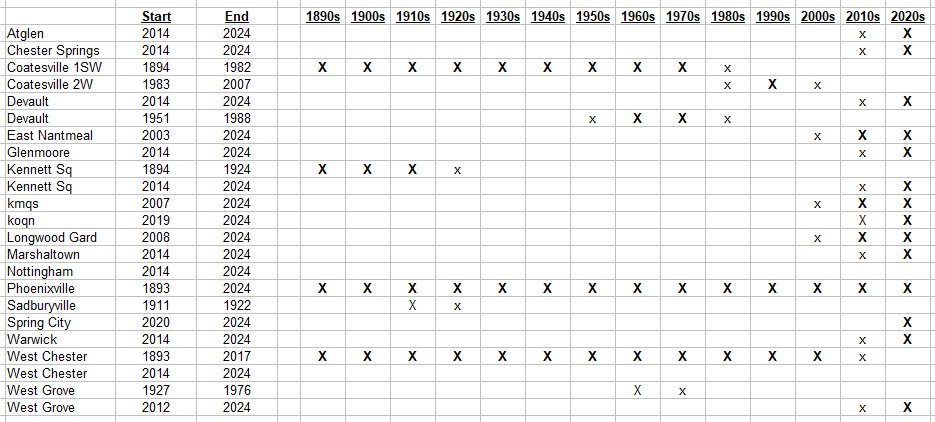
But since you say I never give you anything beyond stations....well below please find all the deep details for the NWS COOP and MADIS stations in our Chester County PA dataset. Included in the below chart - I also updated your above chart with the correct data inventory dates for all available complete years of record. Data provided below for all historical and currently available NWS COOP/MADIS stations includes station map coordinates, full years of data observations by station and elevation above sea level for each station of record.
Some interesting historical and going forward geographic data and station reporting splits.
- There are 704 complete years of all station historical data available through December 31, 2023.
- 368 years of total data or 52% of the years have been observed at elevations below 407 FT ASL (relative lower spots)
- 336 years of total data or 48% of the years have been observed at elevations over 440 FT ASL (relative higher spots)
- Pre-1990 we have 451 years of historical total station data
- 256 or 57% of those earlier observations were taken at relative lower elevations
- 195 or 43% of those earlier observations were taken at relatively higher elevations
- Going forward we will have a split of 8 stations located below 407 FT ASL and 8 stations above 440 FT ASL
- That said we only had 55 years of observations at the relatively highest levels above 600 feet prior to 1990.
- These ongoing observations will include 5 stations (31%) between 620 ft and 685 ft / 5 stations (31%) between 407 ft and 465 ft and 6 stations (38%) reporting data between 105 ft. and 348 ft.


You owe NOAA an apology because you are closer to NOAA now. You are putting lipstick on a pig. Sure DEOS has a nice network. I look at it all the time to check local temps. Doesn't tell us anything about Chester County's past climate though, a poor match to the COOP stations. You seem to have a hard time recognizing that: Phoenixville, the city of Coatesville, and West Chester are warmer than your current network and the county as a whole. If I tried to represent the county by modern stations in those locations you wouldn't be happy. Oh well. Not the only thing you are have trouble recognizing.
-
7 hours ago, ChescoWx said:
So with the new corrected actual COOP data for Chester County PA that eliminated any ghost/estimate data from the observation database we found the following.
- From 1893 thru 1927 no change in the data
- For 86 consecutive years from 1928 thru 2013 each year has now cooled with the elimination of the ghost/estimate data
See the actual average annual temperature variance (red with ghosted/estimated data included and blue with the revised clean actual data from 1893 thru 2023)
Clearly the elimination of these ghosted averages has further flattened the warming trend lines.....

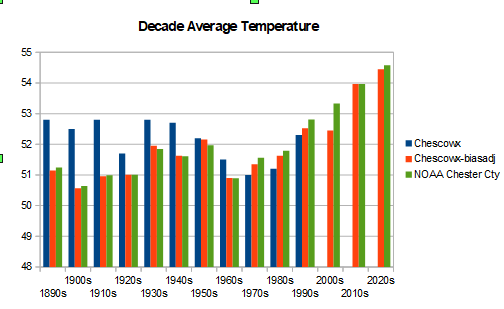
Nah, just shows how bad you method is. You've made a big change in your estimate Chester County's past climate. The second one you've made this year. Since you won't give us anything beyond a list of stations. I made up a simple chart that shows the station coverage by decade. A bolded capital X is a complete decade. A small x is a partial decade.
The monitoring network that you have put together is completely different that the one in 2000. Station changes increased in the 2000s and really ramped in the 2010s. The stations you have added recently, provide very little information on whether Chester County has warmed, because the don't have a long record. In fact the newer stations with longest records: your house and kmqs, match NOAA's warming rate.
With the method you are using, all the new stations do is skew the recent decades cooler vs the old network. You aren't accounting for changes in station characteristics. The new stations are higher in elevation, further N and W, and located in parks or other public area i.e., more rural than the older stations. Even when they are close to the location of older stations they aren't a good match. Take West Grove for example. The current station is at the top of the regional landfill well N and W of West Grove. Per your daily reports, the new West Grove station runs as cool as your house on summer afternoons, rarely hitting 90F.
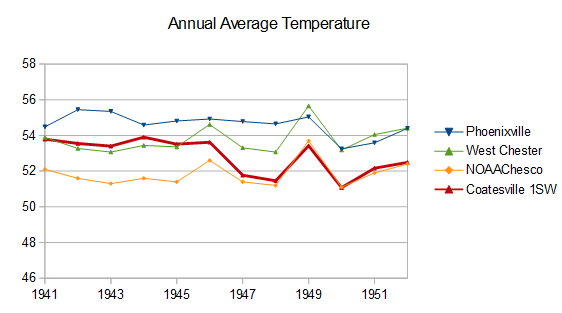
For long term-climate purposes we are stuck with a handful of stations. Four stations make up the bulk of the data: Phoenixville, West Chester and Coatesville (2 stations). If you want to look at raw data and argue that it hasn't warmed. Those are the stations you should focus on. The past couple of weeks have only strengthened my conviction that NOAA is spot on. We've found out the Phoenixville was a furnace in the 1930s-1950s, with a poor shelter and time of day bias, much warmer than nearby stations in or out of the county. Coatesville evidently moved from the city of Coatesville to a more rural location in the late 1940s, dropping temperatures by roughly 2F. Bias adjustments for those 2 stations are completely justified and accurate. I've always wondered why Coatesville cooled in the late 40s, now I know.
Bottom-line the more we find out about your analysis the worse it looks, complete BS. You owe NOAA an apology.
-
2
-
1 minute ago, ChescoWx said:
I am having a blast with this!! Fortunately a bit slow at work so I am crunching away on where ghost data is and is not. Some stations have ghost data for decades and then over to actual for decades and then back to ghost! It will be fascinating to see how it all shakes out. I hope to get everything tied up later today or tomorrow. Wish me luck! Thanks again for the heads up!!
Unfortunately IEM doesn't provide enough warning that the data is estimated. Fooled me until last week. Found this statement on the IEM reanalysis page that provides some info. All the COOP stations are "long-term tracked climate sites".
-
51 minutes ago, ChescoWx said:
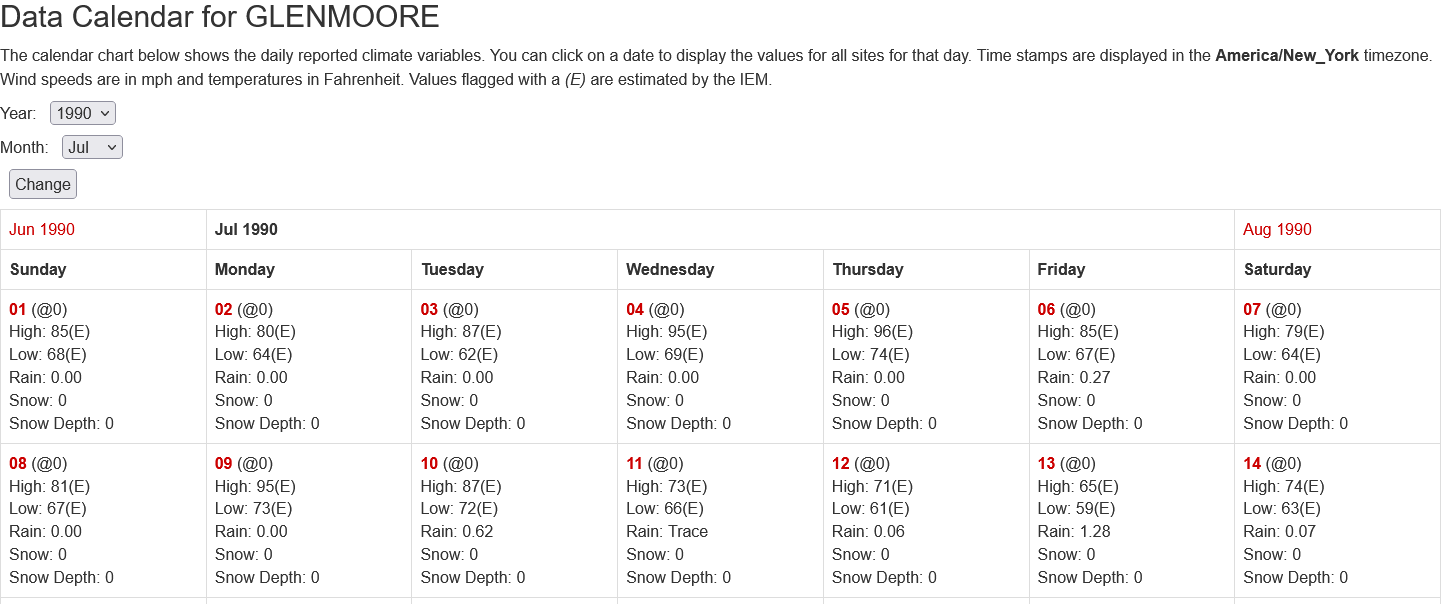
Below is an example of the newest Ghost Station in the Coatesville and Chester County data set. I am working up a list of all real vs ghosted data (and correct dates) to appropriately adjust the Chesco database. I actually have found 2 Ghost Stations in Coatesville one back in the 1940's-1950's and this new one since 2016. Both of these stations are actually NWS Coop precipitation sites that have had post hoc approximate temperatures added to their observations. Below is Coatesville 1E vs. KMQS Airport near same elevation and within 2 NM of the Airport. The month is August 2022. The Ghost Coatesville site reported 11 days over 90 degrees while KMQS and Glenmoore only reported 2 such days. The ghost data increased the average temperature by 1.2 degrees vs KMQS in just that month.

I've had a chuckle over the past couple of pages. As usual you are jumping to the wrong conclusion. The temperatures with an E flag are estimated by IEM. Says so at the top of the data tables. As an example below is Coatesville 1E for the same month. Whenever there is coop station in operation, but without temperature data, IEM dummies in temperatures from their own reanalysis program. Has nothing to do with NOAA or "ghost" stations. Just IEM's attempt to provide a temperature estimate for that COOP location.
In any case, there is no temperature data at several of the sites you were using. When you pull the stations, your monitoring network average will change. Hopefully you will issue corrections to all the charts you have posted with a suitable mea culpa
 .
.
![Screenshot 2024-07-08 at 15-33-26 IEM PA1590 Data Calen[...].png](https://www.americanwx.com/bb/uploads/monthly_2024_07/1826148867_Screenshot2024-07-08at15-33-26IEMPA1590DataCalen....thumb.png.5391c5f81093b57e079565a22aba2b2a.png)
-
 1
1
-
-
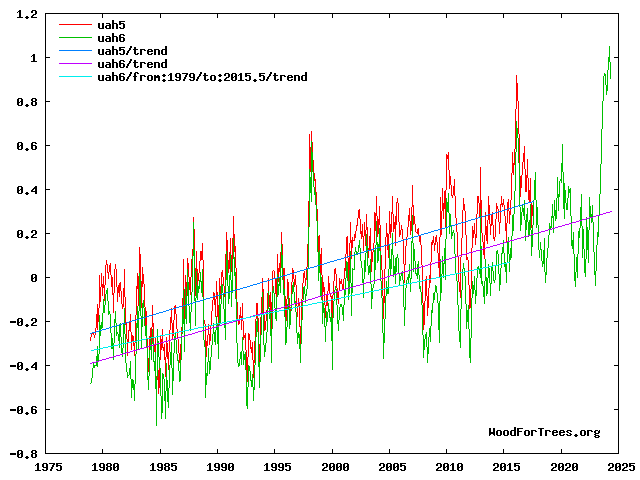
On 7/3/2024 at 10:24 AM, TheClimateChanger said:

This chart compares UAH6 to the previous version, UAH5. The UAH6 warming rate has increased to almost match the UAH5 rate at roughly 0.15C per decade. When UAH6 first came out in 2015 the initial warming rate was only 0.106 per decade (faint blue line). Quite an acceleration in warming, surprised Roy hasn't mentioned it
.
-
1
-
1
-
-
16 hours ago, ChescoWx said:
Even though it has an E flag on the Data Calendar below there actually is submitted NWS Coop forms (see below) that show the actual observations taken. The dataset I am using for the analysis matches the below official coop data form and does not use the estimated figures on the data calendar. You can see the differences below. Not sure why they would put estimates in when we have actual data?


Per NCDC, the Glenmoore temperature data was deleted because it didn't meet NWS standards. Looks like the temperature sensor was added in 2009. Honey Brook, Chadds Ford, and West Grove prior to 1963 all get the E flag at IEM. Per NCDC only rain gauges were present. I don't think there was any temperature data at those stations.

-
1
-
-
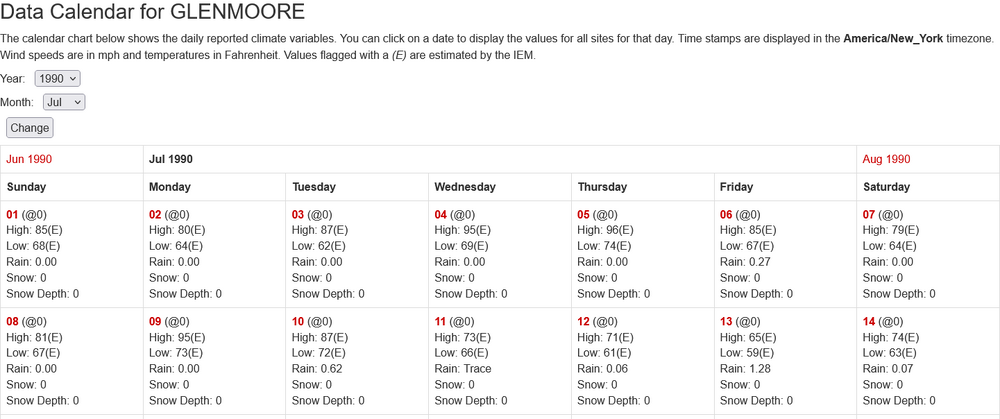
6 minutes ago, ChescoWx said:
Hey Charlie looks like quite a bit of missing data under the IEM sites. To your point they list Glenmoore as having no temperature data for March 2009 (see below) but there were temperature obs taken per obs sheet. They do correctly record the precipitation however. These reading align with my dataset for Glenmoore for that month. The metadata sourced from the Penn State Climate site also shows no temps and only rain data....strange!


Below is the the IEM data table for July 1990. IEM flags temp as E for estimated. E flag is explained in header. Can't find any IEM data for Glenmoore that doesn't have an E flag. Same for the other sites I mentioned. Based on what I see at NCDC and IEM don't think there is any temp data for Glenmoore or the other sites with an E flag.
-
9 hours ago, ChescoWx said:
And no matter how many machine produced non-Chester County obs you put forth.....we know it is not real or factual data. The facts are not supportive....I feel your pain!!
No pain at all. You aren't producing any evidence and I am used to your rhetoric.
I have a question about the coop data. Researching station histories at NCDC, several coops are shown as having rain gauge data only, no temperature data. Chadds Ford, Glenmoore, and Honey Brook have no temperature data at all. West Grove only has temperature data from 1963 to 1976, rain gauge only before that. I had obtained data for those stations from IEM; but, on checking, the IEM temperature data is flagged as “estimated” in the station data table. Apparently IEM backfills from surrounding stations when coop data is missing. Looks like historic Chester County data is even more limited than we thought. Can you check?
-
21 minutes ago, ChescoWx said:
Fortunately we have plenty more stations that say.....sorry Charlie!!
Sorry Paul. More data is your hands results in a poorer analysis and a loss of the warming signal. Why? You don't know how to analyze it. More data in NOAA's hands results in a better analysis. NOAA is using much more data than you are.
-
1
-
-
25 minutes ago, ChescoWx said:
Not true again Charlie there are more stations similar to the old lower elevation sites than the relative higher and we can split them out and analyze them see below summer only lower elevation (warmer) sub 410 ft. stations. Same story cyclical changes and minor unalarming gentle warming.

You aren't listening. Averages of an ever-changing network are skewed, doesn't matter how you tweek them..
-
1
-
-
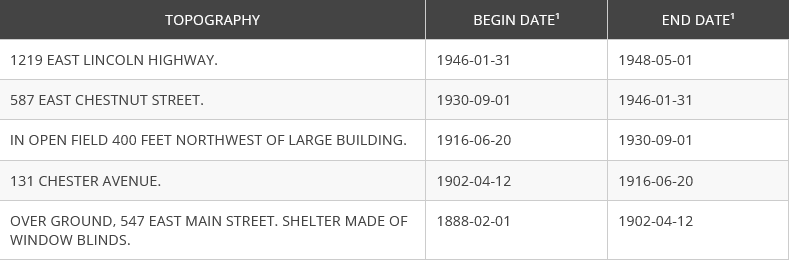
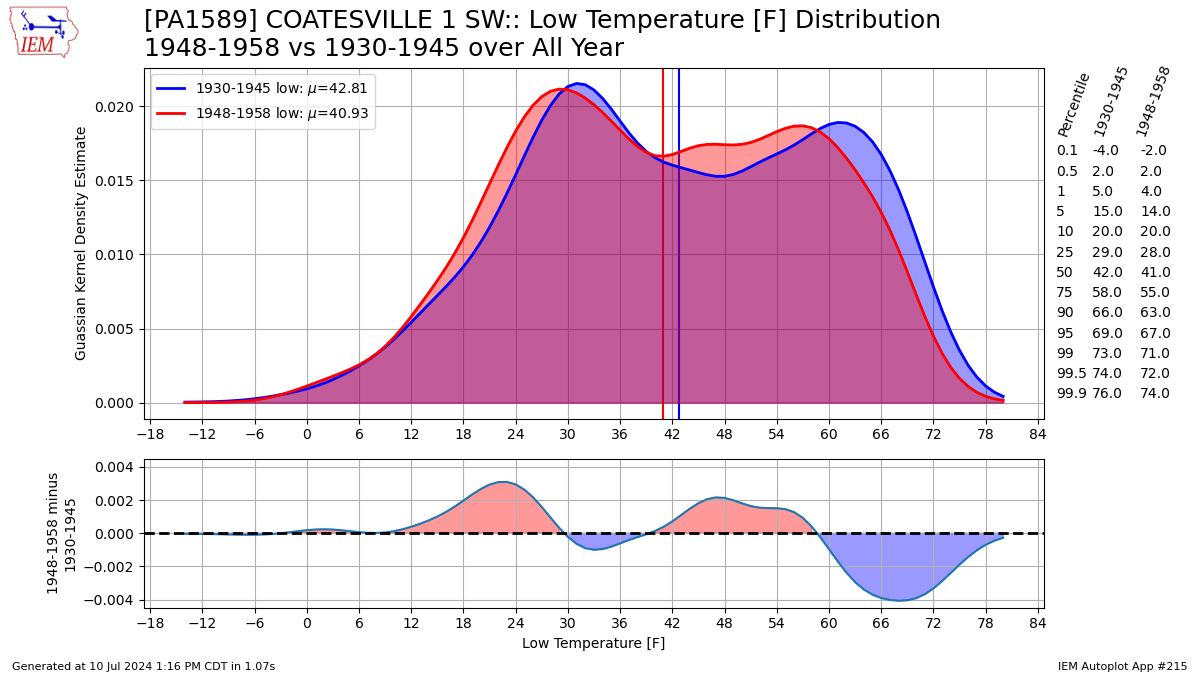
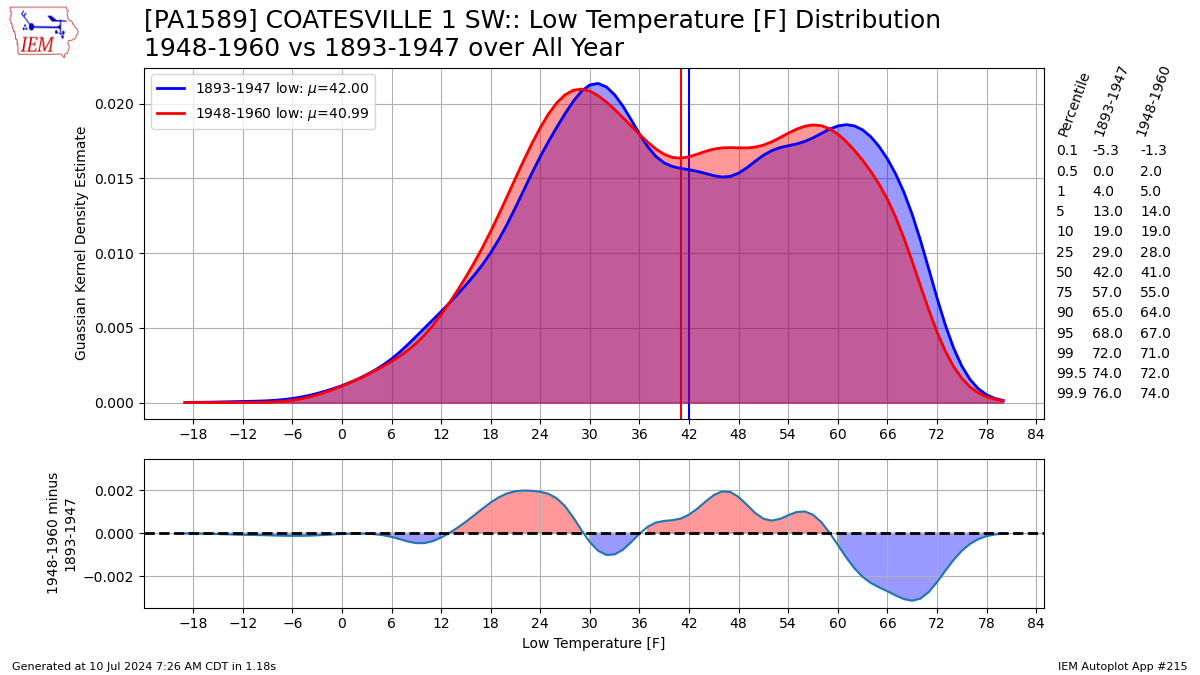
Now that I've found out about the station moves at Coatesville. It is likely that the relative cooling at Coatesville after the war is caused by the station move to a more rural location. Per NCDC, there are two post-war station moves: one in early 1946, and a second move in 1948.
After 1948, NOAA matches the Chescowx (two Coatesville stations and East Nantmeal) closely. This is raw coop data from 2 Coatesville stations and Pauls's house in East Nantmeal. All relatively rural after 1948. Before 1948, NOAA matches the bias-adjusted values for Coatesville. Per chart above the Coatesville experienced a city-->rural move related warming that deserves a bias adjustment. As shown a few posts up, Coatesville had more 95 days than Phiadelphia before the move. More strong evidence that NOAA is spot on and Chescowx is way off.
-
1
-
-
4 hours ago, ChescoWx said:
We have much better station coverage and representation today and going forward across Chester County than we have ever had in the past. That said the old stations are well represented with some stations within a couple NM and at the same elevation (West Chester / Devault). There is a great mix of lower and higher elevation sites. By analyzing this data we actually can and are getting more accurate data.
I agree completely with your first sentence. We have a much better network today. Better equipment and different locations, not restricted to the warmer parts of the county. But you aren't telling us anything about the climate, only how much the network has changed. You have stacked the deck against warming, by throwing in a lot of cooler stations at the end of the period. Stations with different characteristics than the COOPs, which skews the trend analysis cooler and you still find a warming trend..
-
1
-
-
On 7/2/2024 at 12:10 PM, ChescoWx said:
Credit and reference to Chris Martz for his 10 questions for the many climate doomers in this forum: Can you answer all of them??
➊ To the nearest tenth of a degree Celsius, what is the “correct” global mean surface temperature (GMST)?
The list demonstrates that Martz doesn't know what is important (not that we didn't know that). For example It is impossible and unnecessary to determine the average global temperature. Temperatures can vary significantly over short distances. You would need orders of magnitude more thermometers to get a good global average. Fortunately it is much easier to determine the trend in global temperature. As I keep repeating, the year-to-year change in temperature is well correlated over roughly 1000km. Per the paper linked below, you only need roughly 60 stations to get a good estimate of the global trend. There are more than enough weather stations to prove that it is warming globally.
Similarly it is impossible to determine the average temperature in Chester County. The historic monitoring network doesn't come close to providing enough coverage. The county is highly variable: cities, suburbs, rural, many types of ag, forests all at varying elevation. Much easier to determine the trend in temperature in Chester County. Since weather data is correlated over 1000 km a large number of stations can provide useful information and it is easy to correct County stations that move or have biased data. As a result the long-term trend in Chesco is very accurately determined by NOAA and other groups even though there are only a handful of long-term county weather stations.
https://journals.ametsoc.org/view/journals/clim/7/12/1520-0442_1994_007_1999_satoeo_2_0_co_2.xml
-
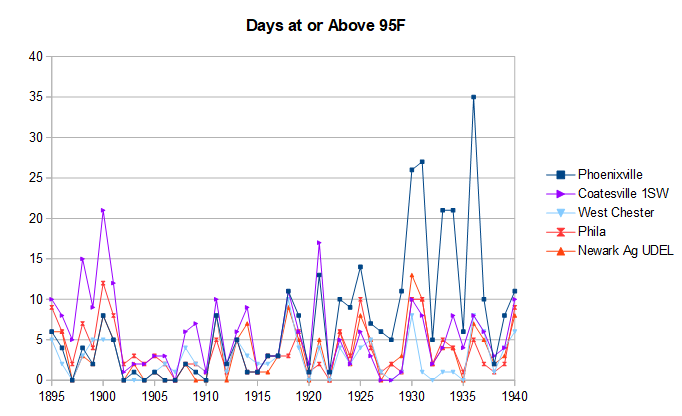
Not only is the 1936 record at Phoenixville flawed, Chesco's whole notion that the 1930s summers were warm in Chester County is questionable. Remove Phoenixville and the # of 95F days plummet in 1930s and 40s. Also note the smaller spike in 95F days at Coatesville in the 1890s+1900s. The NCDC station station notes for Coatesville (below) state that window blinds were used as a temperature screen around 1900. Also the station was located in the city of Coatesville in the 1890s and 1900s, then moved to a field, then back to the city, before finally relocating to a more rural site in the late 1940s. It was only in the late 1940s, at a more rural location, that Coatesville started to have fewer 95 days then Philadelphia on a routine basis.

-
1
-
-
On 7/2/2024 at 11:58 AM, bdgwx said:
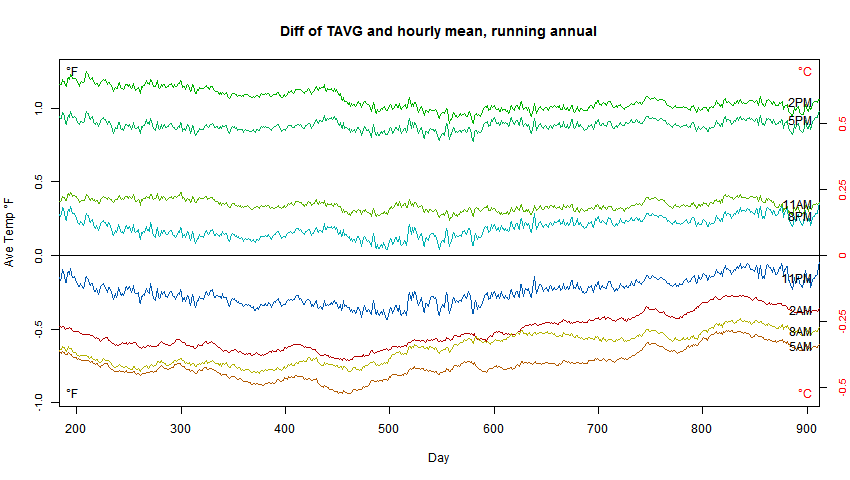
Relevant to the discussion is [Vose et al. 2003] which found that TOB is a significant problem. For example, 4pm and 6am observation times translate into +0.6 C and -0.4 C biases in the US average temperature. So as stations move from PM to AM observations gradually the TOB can effectively cancel 1.0 C of warming making it appear as a zero trend.
This blog has a nice chart which shows how the daily average temperature changes as the obs time changes. Its based on several years of data at Boulder, CO. The chart is fully consistent with Vose et.al.
https://moyhu.blogspot.com/2014/07/tobs-pictured.html
-
20 minutes ago, bdgwx said:
I can no longer reply in that thread either. I thought it was just me.
Me either.
-
36 minutes ago, TheClimateChanger said:
Honestly, if I'm doing climate forensics here, the data @chubbsposted looks like a solar heating problem, not a miscalibration. If the thermometer was simply reading too high, you'd expect it to be pretty consistent, but there was a stretch from about the 9th through 16th where it was largely in line with its neighbors. This was a very wet period. Although the cloud cover reported by the observer was mostly clear on the majority of those days, you can tell he was very lenient. Because several of the "clear" days had rainfall near or over 1 inch, with hours long thundershowers.
Probably poor siting impacted by radiant heat from a nearby building or surface and/or poor maintenance of the shelter allowing filtered sun to reach the thermometer. Previous research by Anthony Watts has shown that even failing to maintain the whitewash paint can cause a not insignificant warm bias by allowing the shelter housing itself to radiate heat to the thermometer. Needless to say modern automated stations are definitely superior.
Agree, probably shelter-related. Easy with a non-aspirated thermometer. The whole region gets the same day-to-day weather so there's a wealth of information in the coop data that's revealed by inter-comparing sites. Been telling Chesco that for years.
-
1
-


![Screenshot 2024-07-08 at 15-33-26 IEM PA1590 Data Calen[...].png](https://www.americanwx.com/bb/uploads/monthly_2024_07/1356127081_Screenshot2024-07-08at15-33-26IEMPA1590DataCalen....png.16a1bbfe90211a969ea950c7adc00633.png)


Occasional Thoughts on Climate Change
in Climate Change
Posted
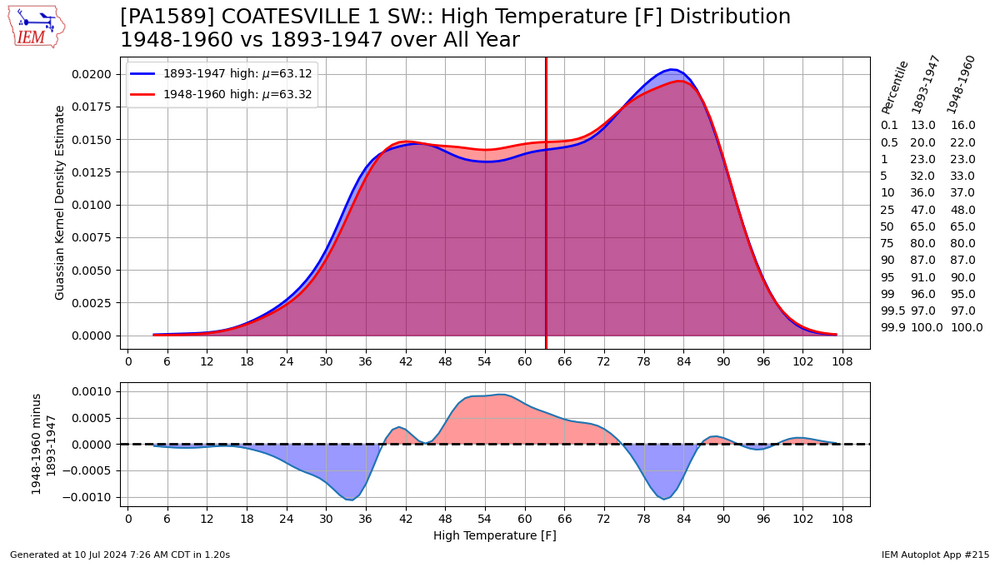
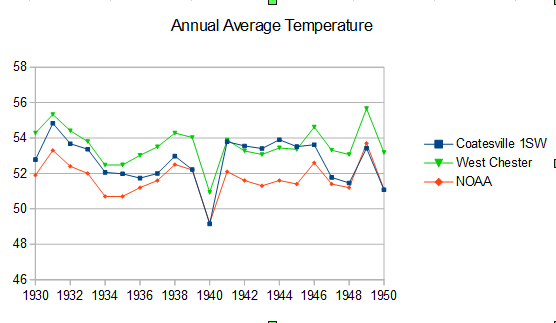
Here is the raw and bias-adj values for Coatesville 1SW. Bias adjustment starts today and works backward, so the Doe Run Road site sets the baseline for Coatesville 1SW. Bias adjustments are small for Coatesville 1SW after the move to a rural site in 1948. Note there are some small cooler adjustments in the 1970s. Before 1948 the bias adjustments are variable, reflecting the many moves and other station changes, but generally increase with time. The adjustments are largest for the 1893 to roughly 1920 period. This agrees well with the 95F+ chart I posted earlier and other charts I have posted over the years in various forums. Coatesville has more hot days in that period than other stations in this region, including stations outside the county in warmer locations, like Philadelphia.
Per your question, sounds like you are still having problems understanding NOAA's methods, despite my previous explanations. Here is one more attempt. ALL THE BIAS ADJUSTMENTS ARE MADE TO THE STATION DATA. There are no further adjustments once the station adjustments have been made. THE OLDER COOP STATIONS ARE IN WARM LOCATIONS. Not surprising that the county average is warmer than the station results. The same thing occurs today. Phoenixville is always warmer than the county average.
After the stations have been bias adjusted, NOAA maps the station values to a 5 by 5 km grid across the country. At this point the County boundary has not played any role. Why would it? The atmosphere doesn't care about the county boundary. Only at the very end are values for the county, climate division (SE PA Piedmont), state, etc, calculated from the 5 by 5 km gridded values.