RIC Airport
-
Posts
2,586 -
Joined
-
Last visited
Content Type
Profiles
Blogs
Forums
American Weather
Media Demo
Store
Gallery
Everything posted by RIC Airport
-
Richmond Metro/Hampton Roads Area Discussion
RIC Airport replied to RIC Airport's topic in Mid Atlantic
I think we may get NAM'd. -
Richmond Metro/Hampton Roads Area Discussion
RIC Airport replied to RIC Airport's topic in Mid Atlantic
Always been a sour subject since the Blizzard of 1996. Sometimes I think they do fine, but storms like 1/23/2016, 1/30/2010, 3/1/2009, and 1/25/2000 are notorious misses. Even 1/6/1996 finally got revised after 20 years in the wake of the 2016 storm that prompted a formal review by NWS Wakefield. Even this season, they've had to revise the snowfall total in the CLI for the first two snow events. No other station, certainly not Norfolk, seem to have these issues. -
Richmond Metro/Hampton Roads Area Discussion
RIC Airport replied to RIC Airport's topic in Mid Atlantic
Yup, I don't usually look at them. Just posting to renew some hope for those feeling down. -
Richmond Metro/Hampton Roads Area Discussion
RIC Airport replied to RIC Airport's topic in Mid Atlantic
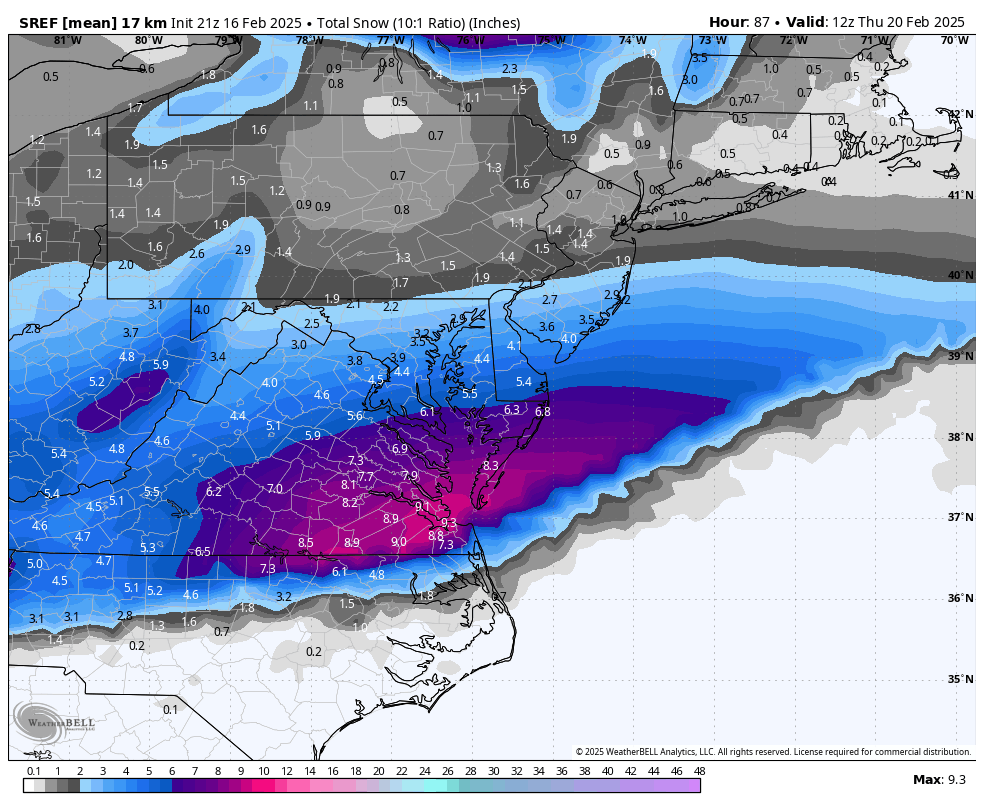
21z SREFs This is 10:1, no kuchera on wxbell.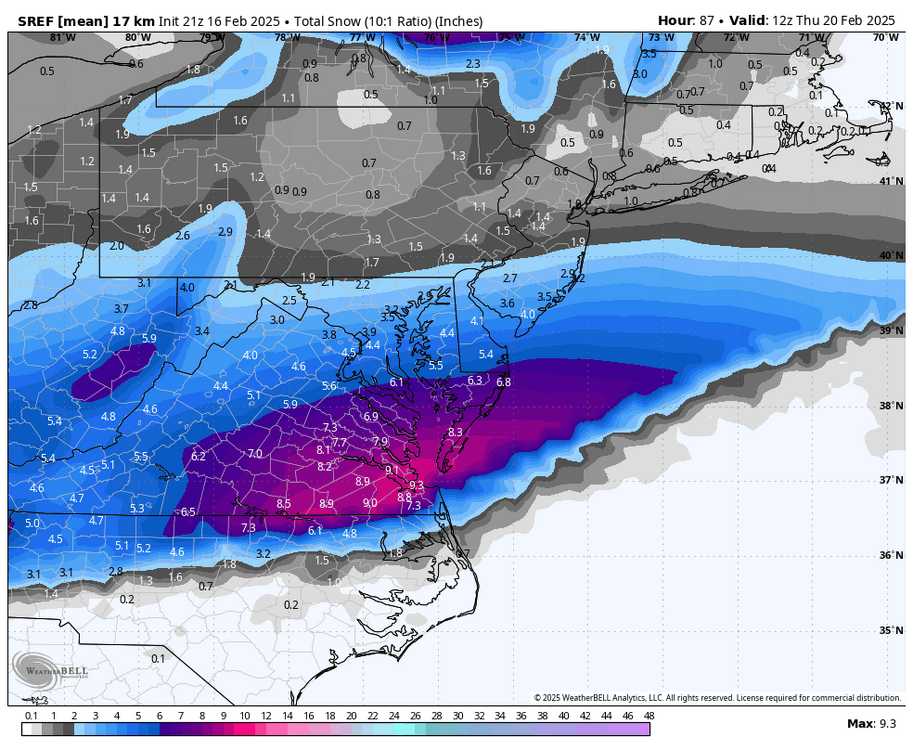
-
Richmond Metro/Hampton Roads Area Discussion
RIC Airport replied to RIC Airport's topic in Mid Atlantic
EPS is east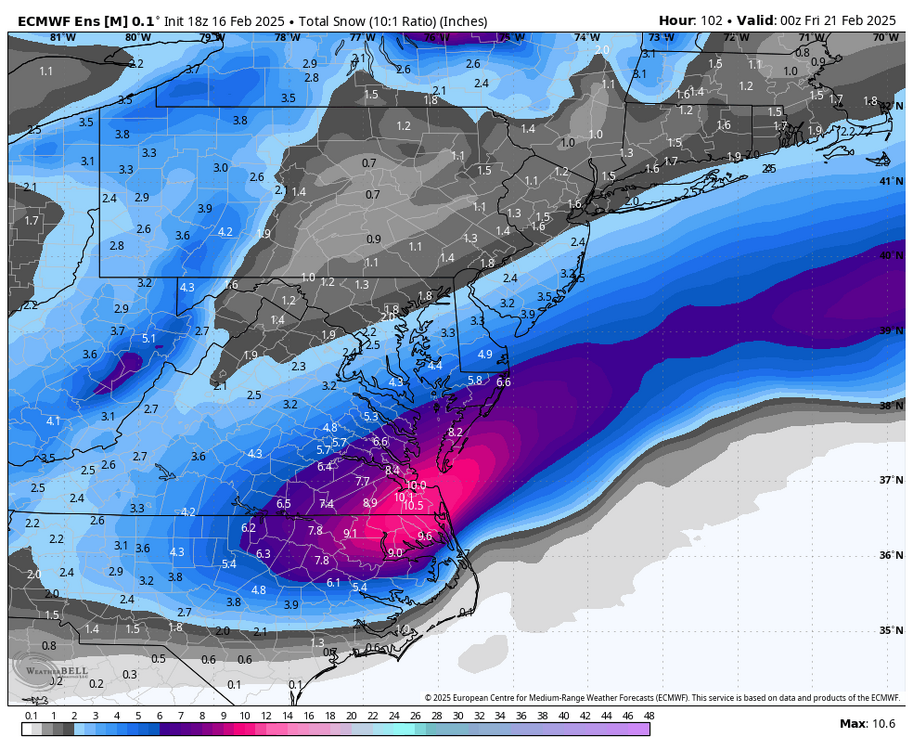
-
Richmond Metro/Hampton Roads Area Discussion
RIC Airport replied to RIC Airport's topic in Mid Atlantic
Maybe they will consider hoisting blizzard warnings for the coast? -
Richmond Metro/Hampton Roads Area Discussion
RIC Airport replied to RIC Airport's topic in Mid Atlantic
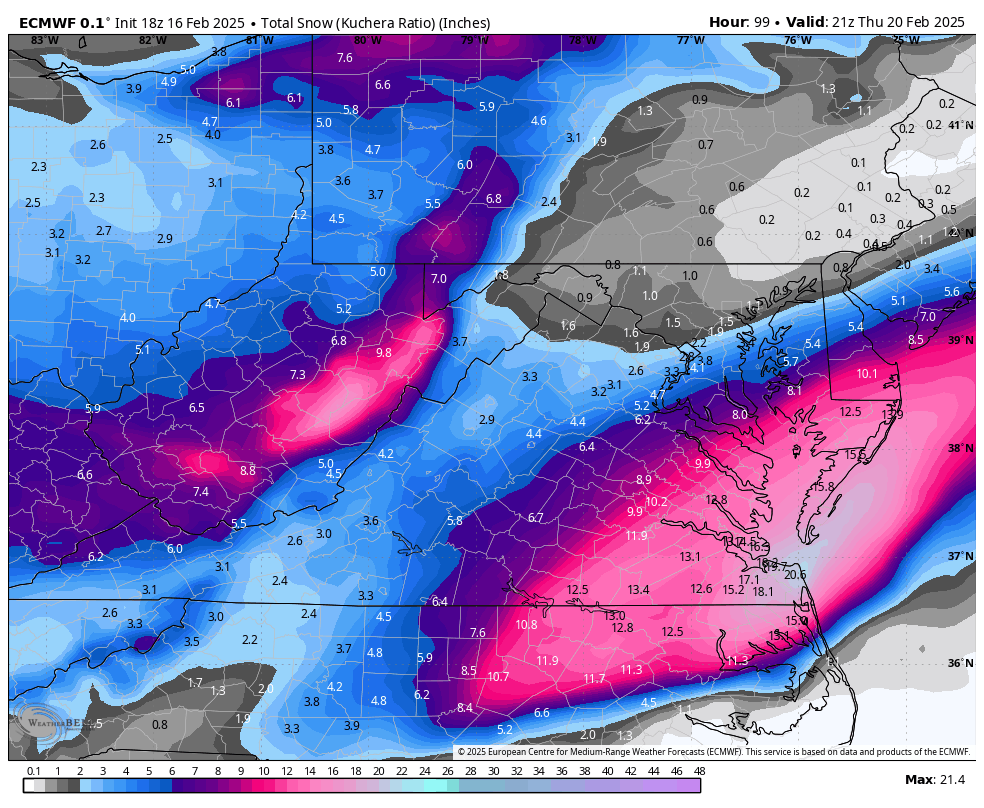
Yes, there was actually a shift east, 18z vs 12z below.
.thumb.png.0954722d73d9795e094ecbeab2c8874b.png)
-
Richmond Metro/Hampton Roads Area Discussion
RIC Airport replied to RIC Airport's topic in Mid Atlantic
Still on track.
-
Richmond Metro/Hampton Roads Area Discussion
RIC Airport replied to RIC Airport's topic in Mid Atlantic
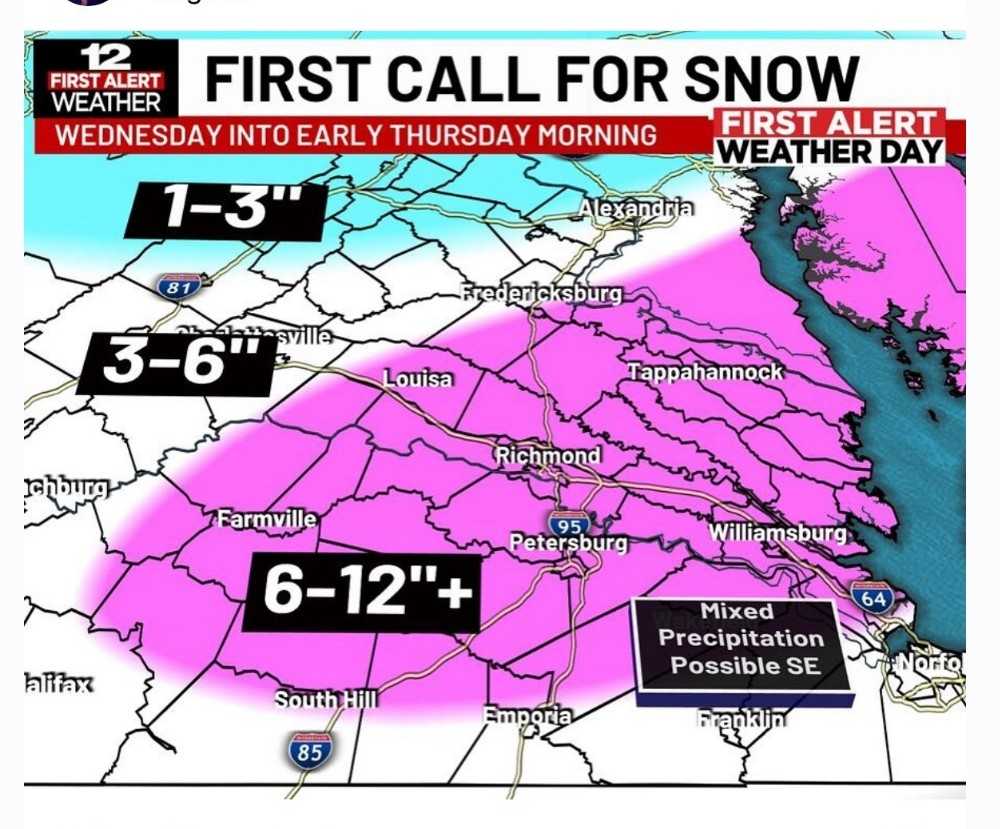
NBC 12's first map.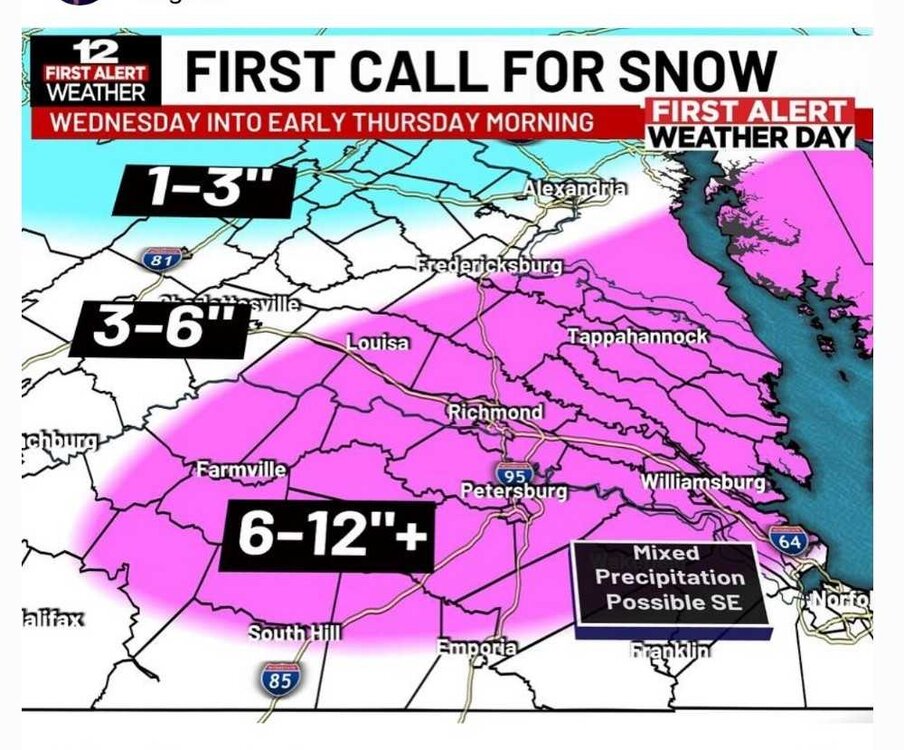
-
Richmond Metro/Hampton Roads Area Discussion
RIC Airport replied to RIC Airport's topic in Mid Atlantic
Most places gained at least 2" on the mean.
-
Richmond Metro/Hampton Roads Area Discussion
RIC Airport replied to RIC Airport's topic in Mid Atlantic
https://x.com/webberweather/status/1891230324723495192 -
Richmond Metro/Hampton Roads Area Discussion
RIC Airport replied to RIC Airport's topic in Mid Atlantic
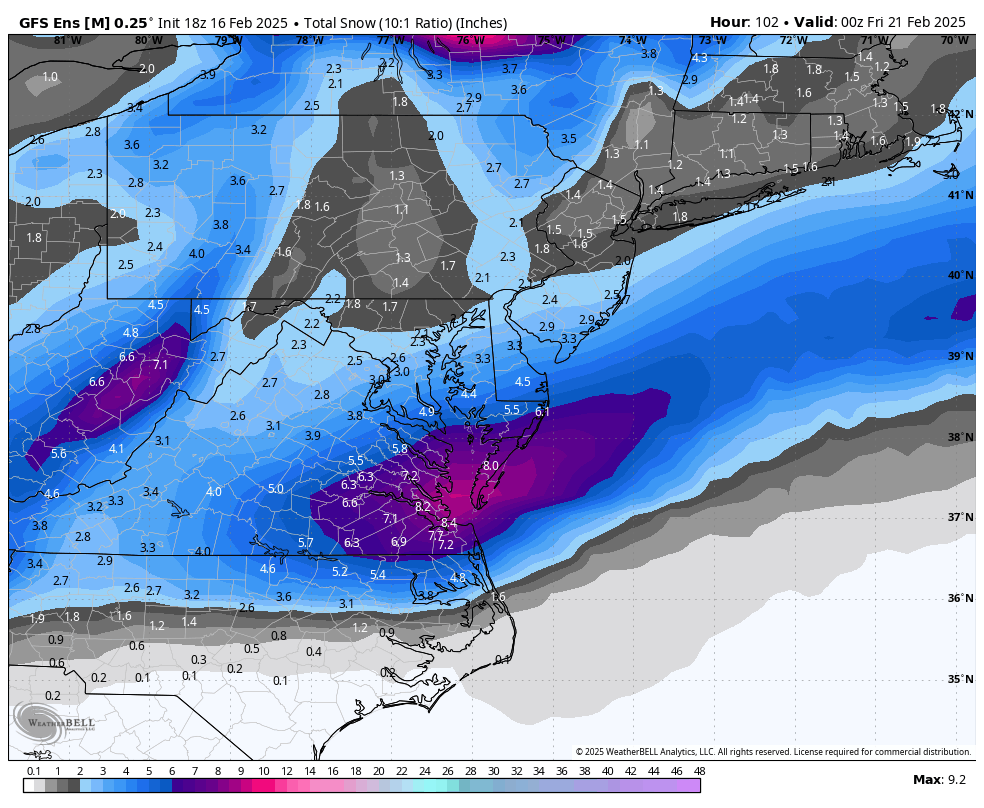
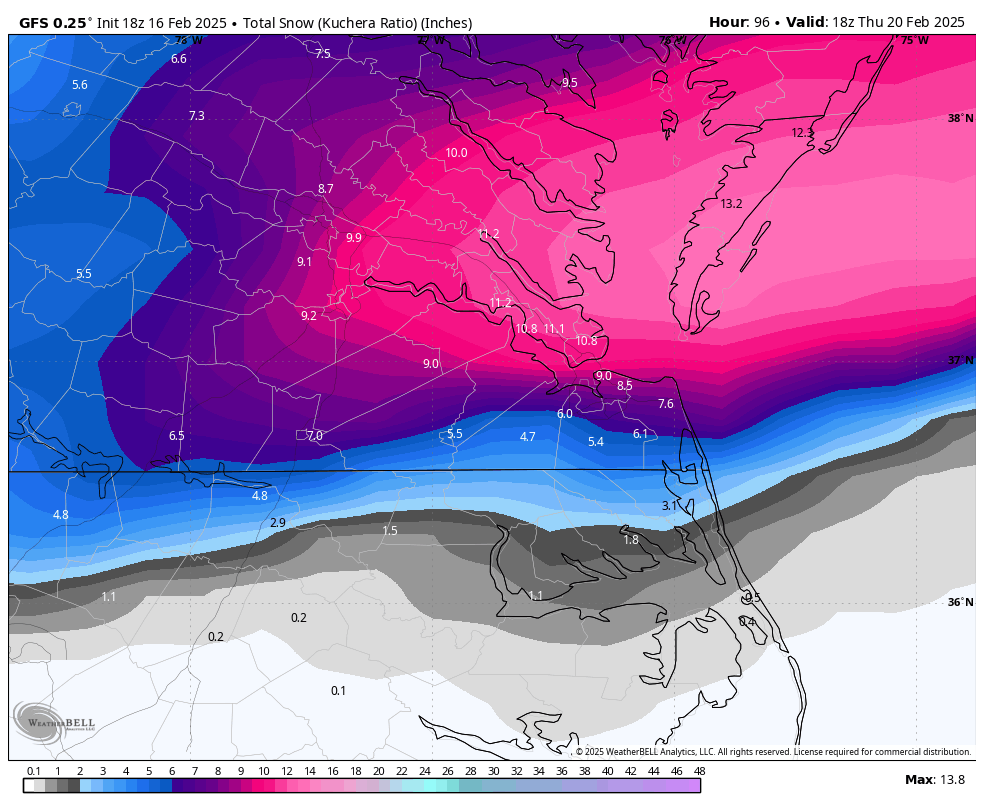
18z GFS still a good hit for the region. Nothing like the NAM.

-
Richmond Metro/Hampton Roads Area Discussion
RIC Airport replied to RIC Airport's topic in Mid Atlantic
Actually, you're right. That's what I meant. I just wrote it backwards. -
Richmond Metro/Hampton Roads Area Discussion
RIC Airport replied to RIC Airport's topic in Mid Atlantic
I don't see anything wrong with 4-8", but of course, it's subject to change. We've been through this enough times to stay conservative and increase it as data and conditions warrant. If you're gonna bust at all, it's better to bust high than to bust low. -
Richmond Metro/Hampton Roads Area Discussion
RIC Airport replied to RIC Airport's topic in Mid Atlantic
The Kuchera is not available on Wxbell for the ICON, so the totals in many, if not all, areas would be higher than indicated below.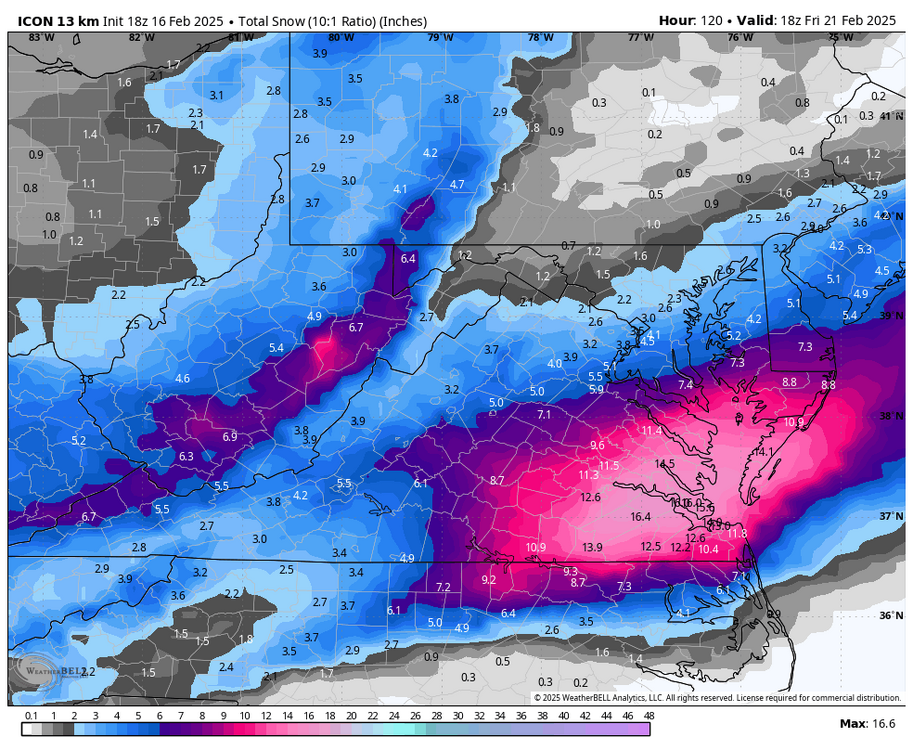
-
Richmond Metro/Hampton Roads Area Discussion
RIC Airport replied to RIC Airport's topic in Mid Atlantic
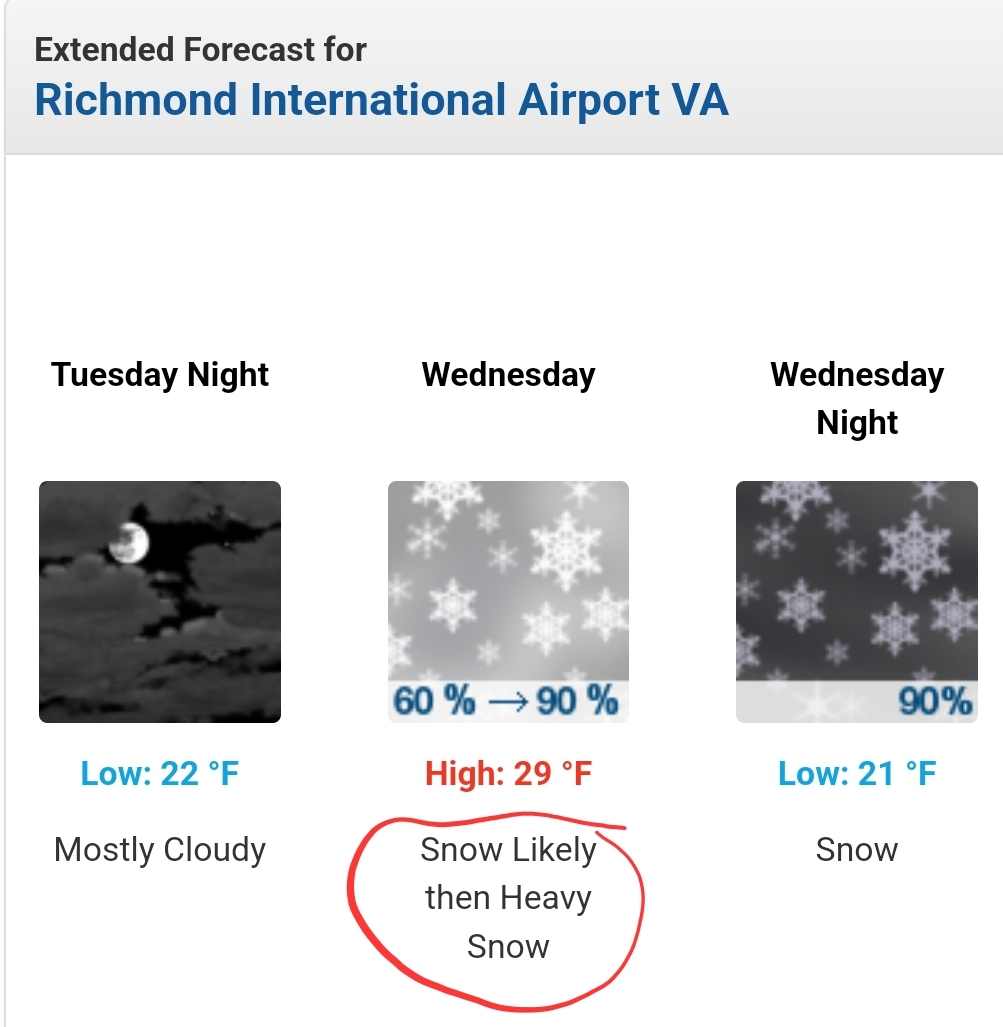
That seems reasonable based on what I see. I mentioned earlier that if I had to make a forecast, I would predict 6 to 10 inches for the Richmond metro area. However, I agree there is a possibility of even higher amounts. I am hesitant to forecast more than 10 inches for Richmond, as it always seems like something unexpected happens at the last minute—such as mixing or dry slots—that complicates things. Specifically regarding the airport, we are due for a significant event; it has been far too long. For a storm to be considered a top 10 event, it would need to exceed 12.7 inches. -
Richmond Metro/Hampton Roads Area Discussion
RIC Airport replied to RIC Airport's topic in Mid Atlantic
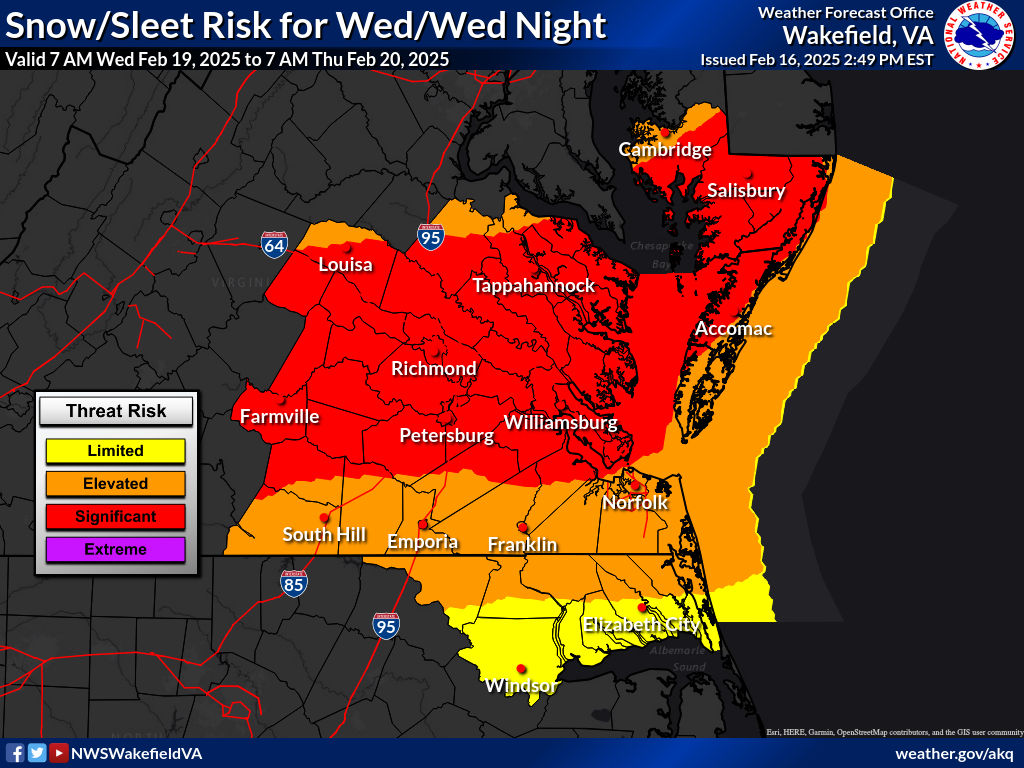
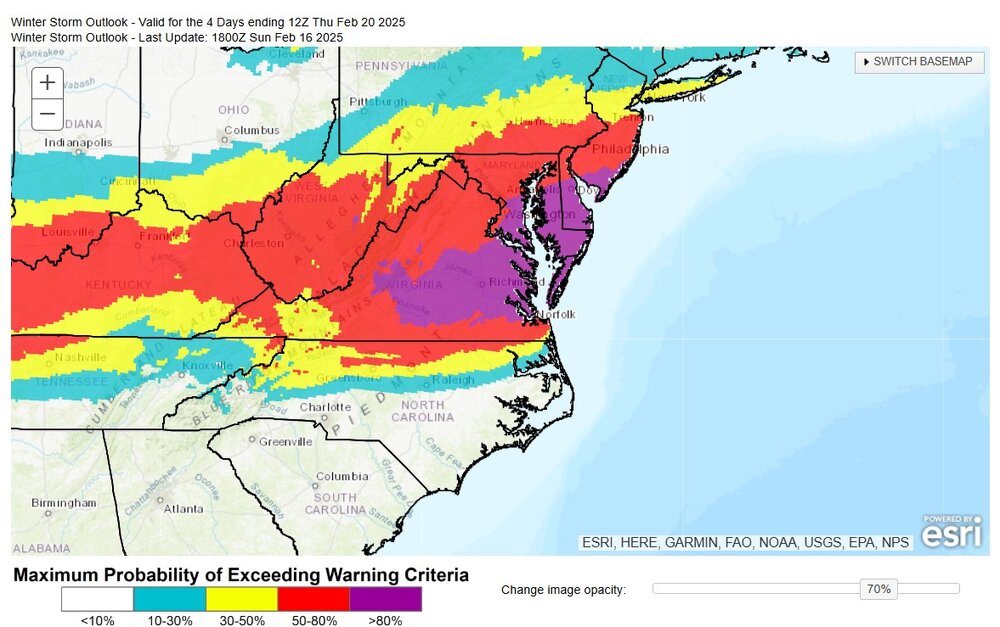
Latest discussion below from AKQ is worth a read. Also, they say near blizzard conditions can't be ruled out near the coast. .LONG TERM /WEDNESDAY THROUGH SUNDAY/... As of 330 PM EST Sunday... Key Messages: - Potential continues to increase for a significant winter storm to impact the region Wednesday into Thursday. Cold weather remains persistent through the middle of the week as another Arctic high moves out of Canada and into the north-central Plains. The high pressure will build south and east. As this occurs a low will develop across the Gulf Coast and lifts northeast off the Atlantic coast. The latest 12z/16 operational models and their respective model ensembles (GFS/ECMWF/Canadian) continue to show the potential for an significant winter storm across the majority of the CWA Wednesday into early Thursday. A southern stream shortwave is expected to move across the southern United States, with a low pressure system starting to develop along the southeastern coast and then lifting north-northeast. The 12z operational models show a better agreement on the placement of the low. However, they still continue to vary on totals as well as the their ensembles. The EURO and Canadian look to have slightly better agreement with potential totals than the GEFS. The GEFS continues to show low values as it continues to hint on a warm nose at 850mb creeping its way slightly further north than the Canadian and Euro ensembles. The probailities of snowfall has risen slightly across all ensembles. The 12z Euro and Canadian ensemble shows swaths of 90 to 100% probs of >=3" of snow with 60 to 80% probs for >=6" of snow. There has even been an increase in the chances for >=12" probs with much of the area now in the 20 to 30% contour with the Canadian and Euro. The GEFS continues to show somewhat lower probabilities but the 50th percentile still shows a wide footprint of 4-6" across the region. The overall 12z guidance continues to slightly trend cooler with this potential system. This colder weather will have implications for the placement of mixed precip corridors with this system. Have slightly increased freezing rain potential across the far SE as the ensemble guidance does show the potential warm nose creeping its way into the area. Will also note, the low is expected to deepen as it approaches the coast late Wednesday into early Thursday. As this low deepens the pressure gradient is expected to tighten especially along the far SE coast bringing gusty winds. Confidence is low at the time however, the possibility of nearing blizzard like conditions especially along the SE coastal areas cannot be ruled out. This event has a high ceiling for snow totals with QPF well over an inch across the region. However, any mixed precip will reduce totals significantly. Specifics should become more clear over the next 24- 48 hours so continue to follow the forecast over the coming days. Cold and dry conditions move in behind the system as high pressure builds into the region. Temperatures Thursday into the weekend will depend heavily on how much snow accumulates and where. -
Richmond Metro/Hampton Roads Area Discussion
RIC Airport replied to RIC Airport's topic in Mid Atlantic
Island on its own for now. -
Richmond Metro/Hampton Roads Area Discussion
RIC Airport replied to RIC Airport's topic in Mid Atlantic

-
Richmond Metro/Hampton Roads Area Discussion
RIC Airport replied to RIC Airport's topic in Mid Atlantic
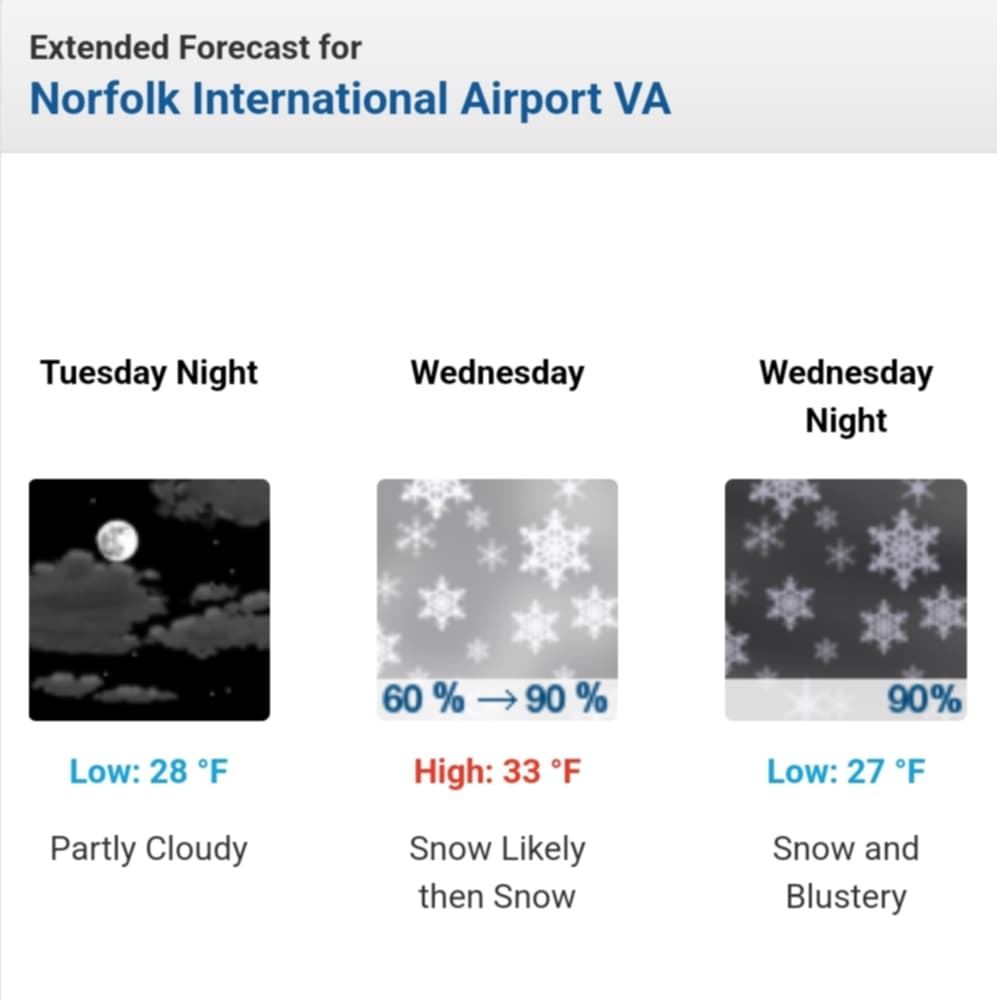
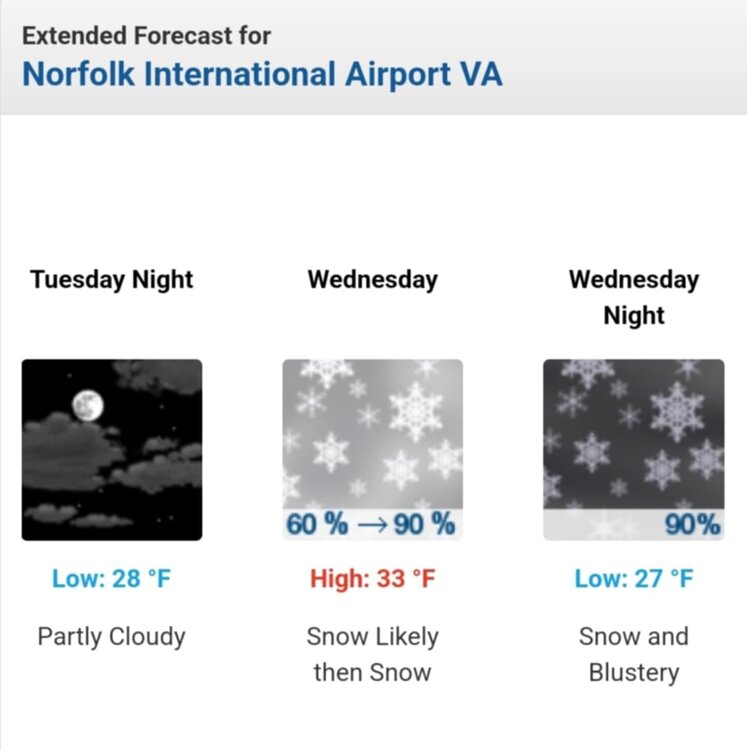
Wakefield has added +SN to the grids for RIC. Also not seeing any mention of mixing at ORF.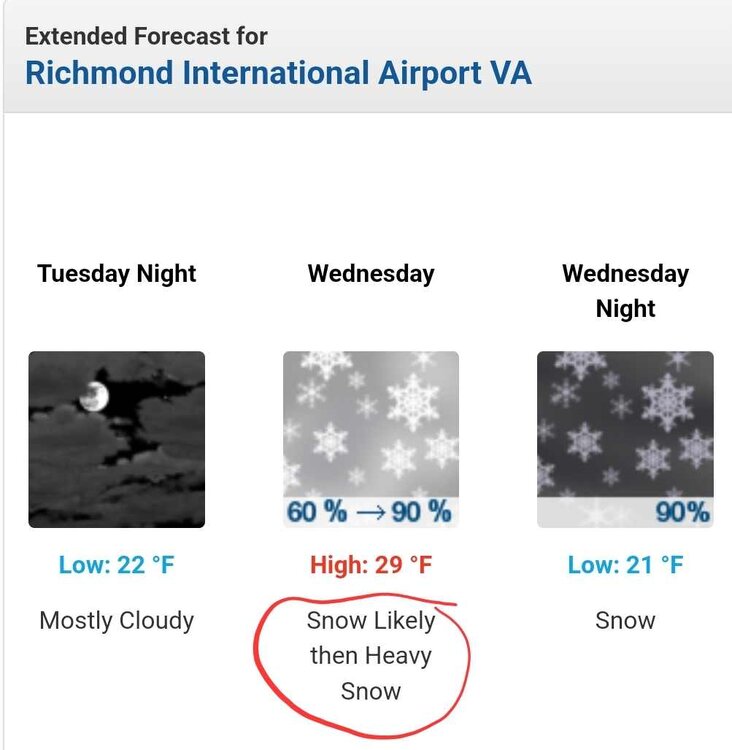
-
Richmond Metro/Hampton Roads Area Discussion
RIC Airport replied to RIC Airport's topic in Mid Atlantic
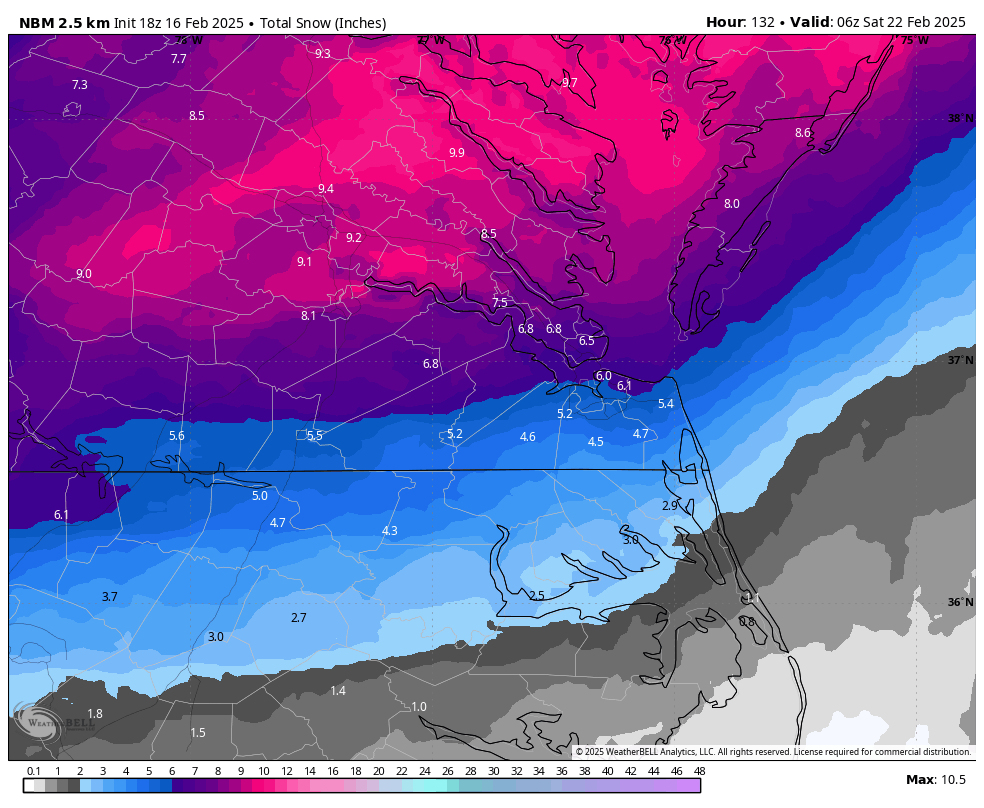
FWIW, here is the 18z NBM, obviously still in flux as data is ingested.
-
Southern MD / Lower Eastern Shore weather discussion
RIC Airport replied to AnEndlessMaze's topic in Mid Atlantic
That's how Richmond folks feel. Always seems like the epicenter is either DCA or ORF while RIC is often fringed every time. Just look at what's happened even this year. -
Richmond Metro/Hampton Roads Area Discussion
RIC Airport replied to RIC Airport's topic in Mid Atlantic
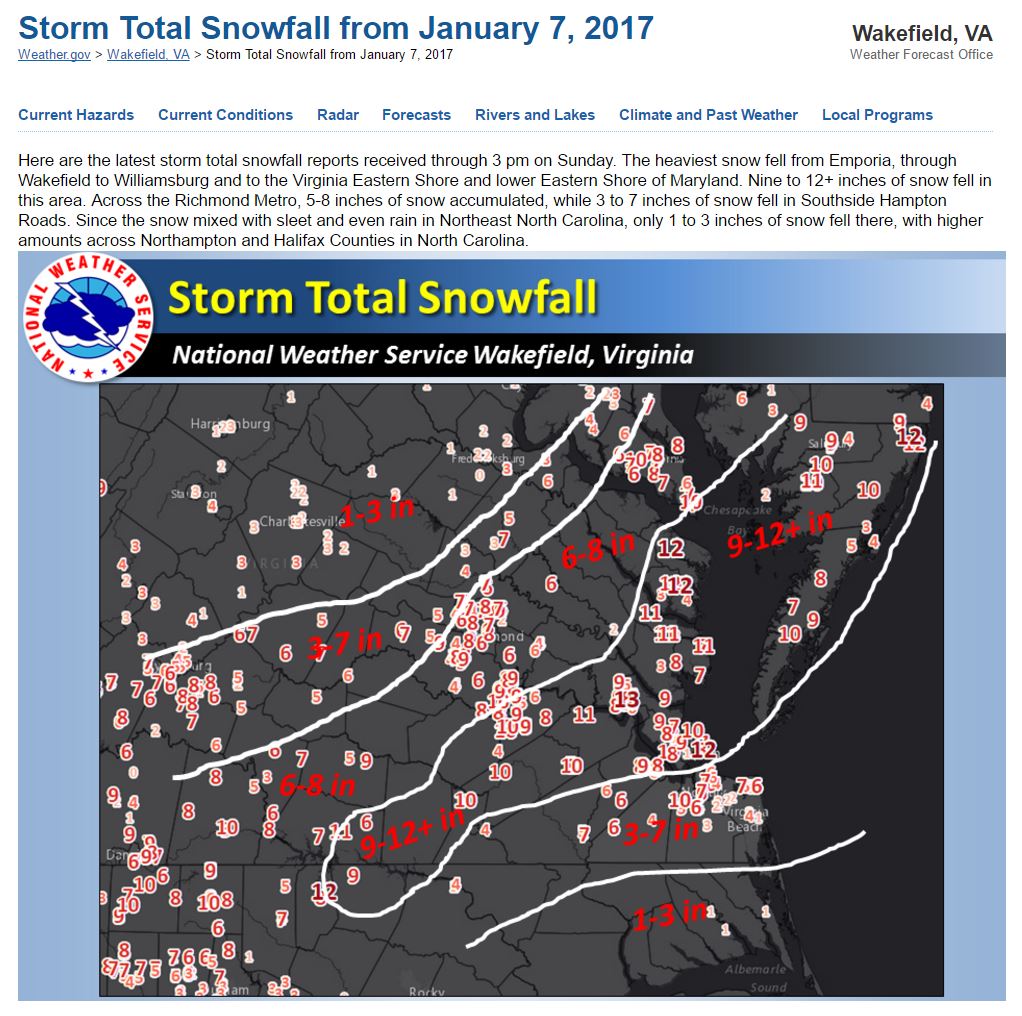
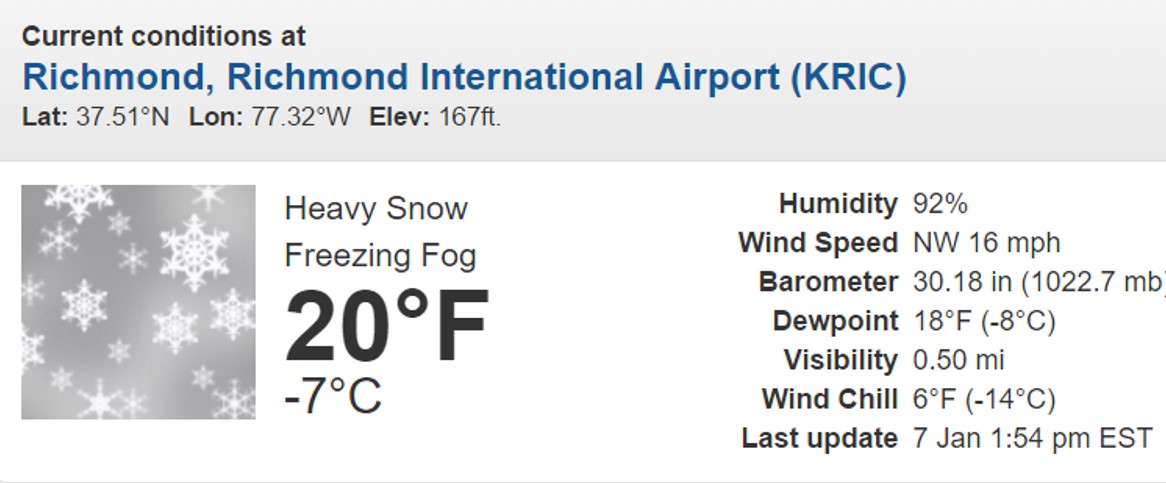
If trends continue, you may not mix at all, maybe even be the jackpot. The snowfall distribution suggests this event wants to set up like the 1/7/2017 storm. Here is Wakefield's summary. https://www.weather.gov/akq/snow_Jan082017 They even issued a blizzard warning for southside Hampton Roads. Totals on the southside were lower than expected because of mixing. It was a cold storm, RIC was 20°F during the height of the event and recorded 7.1". Totals on the southside were down with 5.3" at ORF, but the peninsula had 10"+ in spots. The snow stuck around for a few days, and there was a record low set at RIC a couple of days later.

-
Richmond Metro/Hampton Roads Area Discussion
RIC Airport replied to RIC Airport's topic in Mid Atlantic
Euro AI model seems to have led the way with this, it was always south and east. -
Richmond Metro/Hampton Roads Area Discussion
RIC Airport replied to RIC Airport's topic in Mid Atlantic
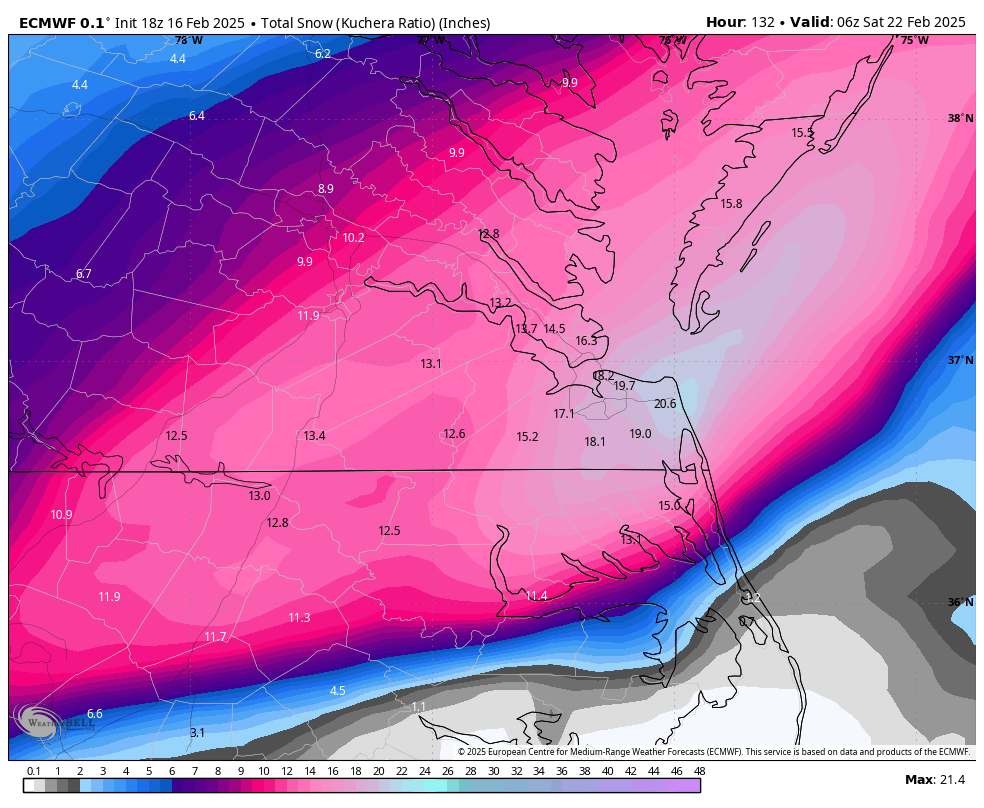
Still very cold inland with widespread 1.00"+ QPF from RVA to Hampton Roads. Euro does indicate some mixing for the southside for a time.


.png.70664ca1e7b52cbc6a30435d7bcaf625.png)