stadiumwave
-
Posts
1,302 -
Joined
-
Last visited
Content Type
Profiles
Blogs
Forums
American Weather
Media Demo
Store
Gallery
Everything posted by stadiumwave
-
It is weather! One's experienced weather in one's short life or extremely small period of record keeping is just...meh.
-
I just do not buy Phase 6 being cold
-
Ha, just coming to post. Models suck
-

-
Yes,started changing a couple of days ago rather rapidly. Been the same story since NOV
-
0z Euro....lol
-
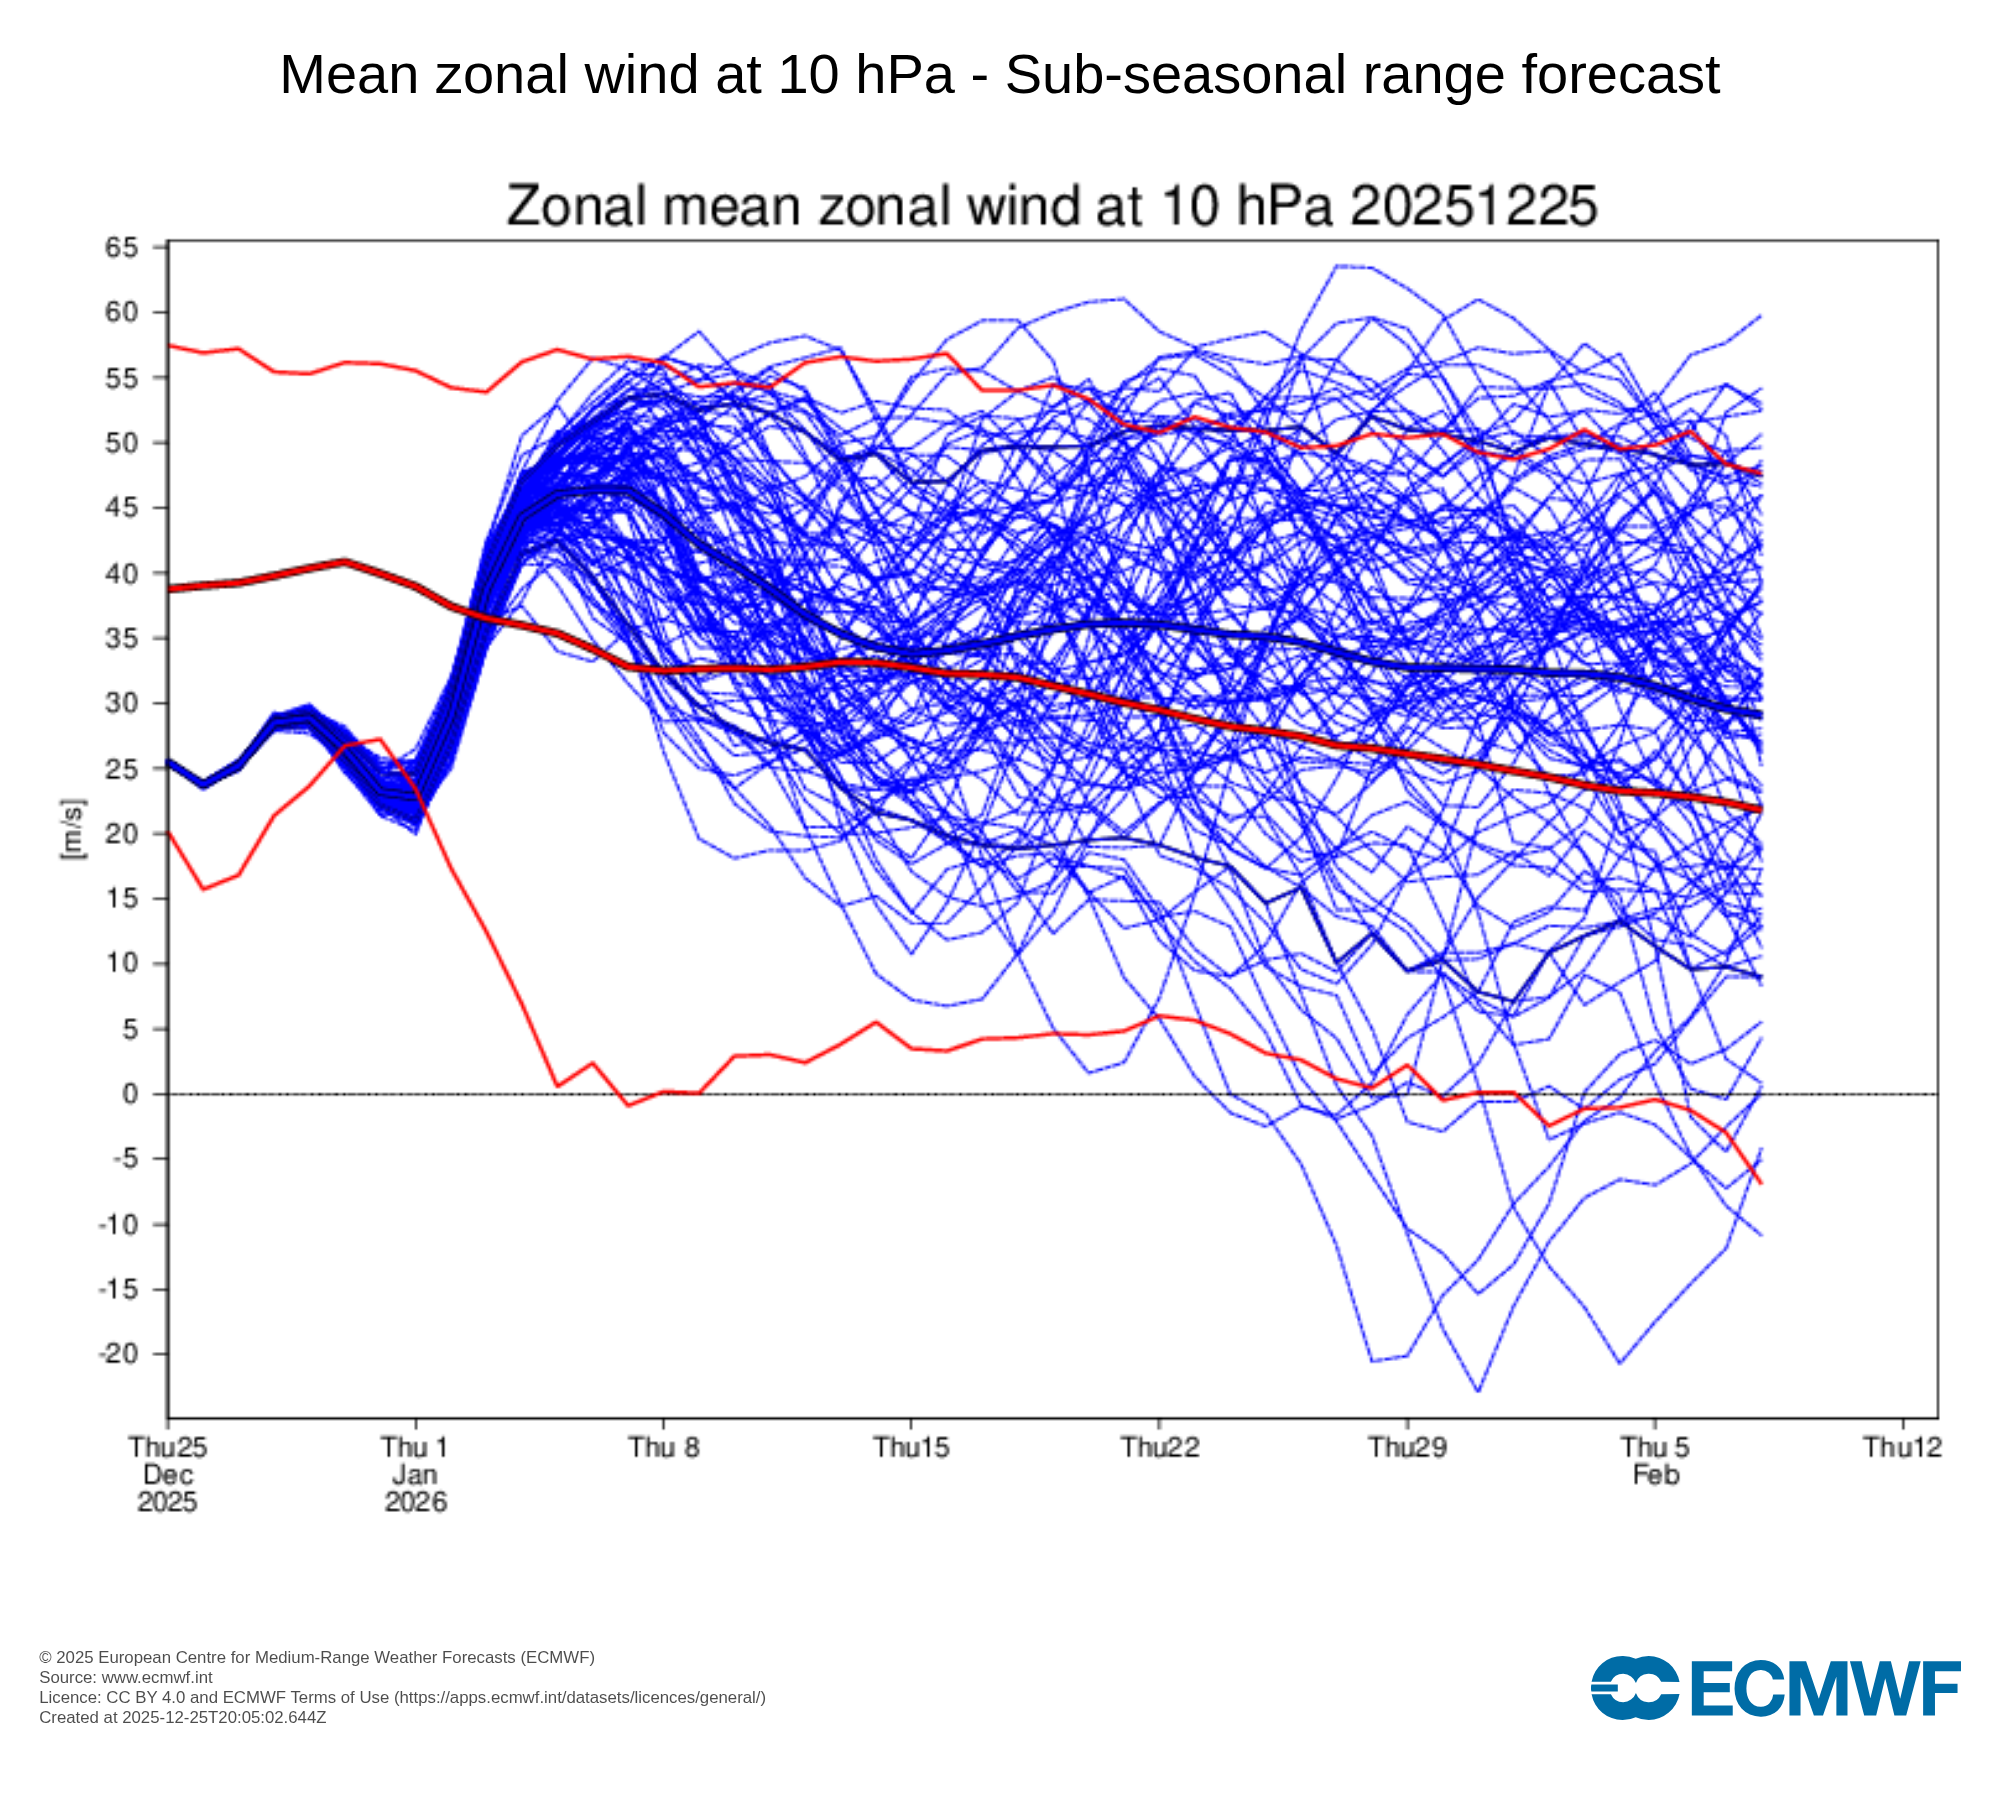
Not much, & certainly trending weaker, which has been a repeating trend since NOV. I honestly do think it will make a difference either way, but I am just saying...what people point out & what they ignore is comical.
-
I wonder if all the people that ran to Twitter like a kid to post how strong the SPV would be (assuming it meant warmth), will be as eager to post the same data has significantly changed? WED Update THURS Update FRI Update
-
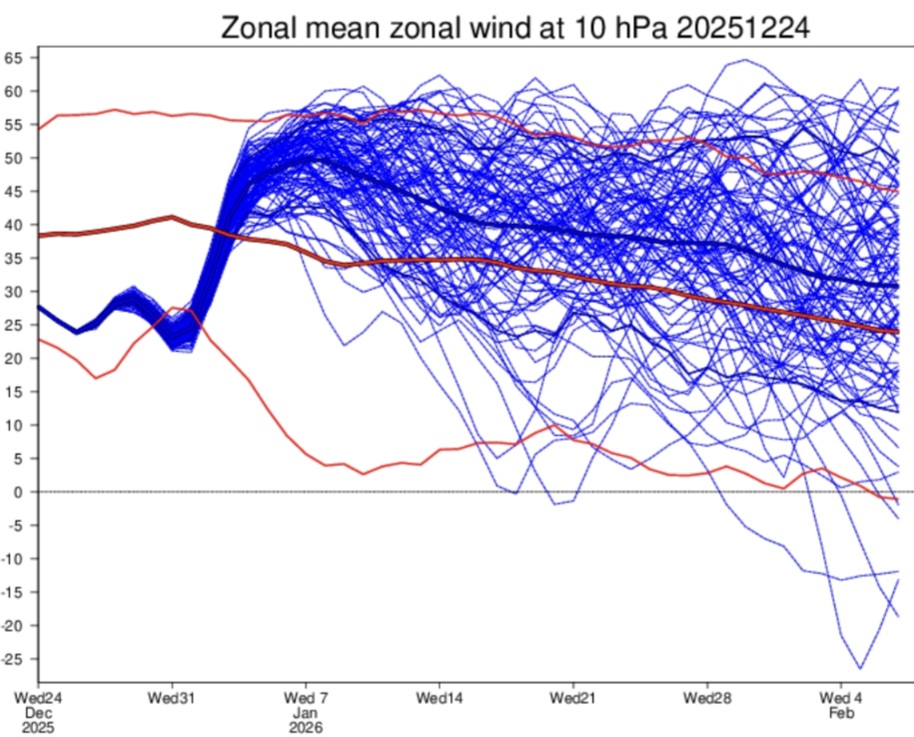
This is why watching SPV forecasts very far out at all will bite you, if you're predicting by using them. Make note of trends like a new weakening verses yesterday & many more members after that versus yesterday. Changes a lot & has since NOV. yesterday's

-
I guess you failed to read...Merry Christmas
-
Unless there is strong coupling between the stratosphere & troposphere it really does not matter.
-
I remember posting that all the early strat warming, -QBO, La Nina winters had JAN as the coldest month in the analog package. The 3 years that had an actual early SSW (this year being one) it took on average 4 weeks before a noticeable affect on pattern. All 3 year had an effect on the troposphere pattern. Now, I am not saying JAN will be colder than DEC at all but historically the analogs suggested the odds of having some winter in JAN were higher than average. Therefore, if models have not gone bonkers today & holding forth fools gold & the flip is legit, is this a case we all died by model data instead of looking skeptically at the model data? If a more wintry like pattern emerges should we be all thay surprised?
-
Its a total flip of the pattern being advertised yesterday to today. The 500mb look is just ridiculously different...a flip if there ever was one.
-
-
Actually not the -QBO years with anykind of early strat warming. JAN is the coldest in that analog package. Will not be this year but just saying.
-
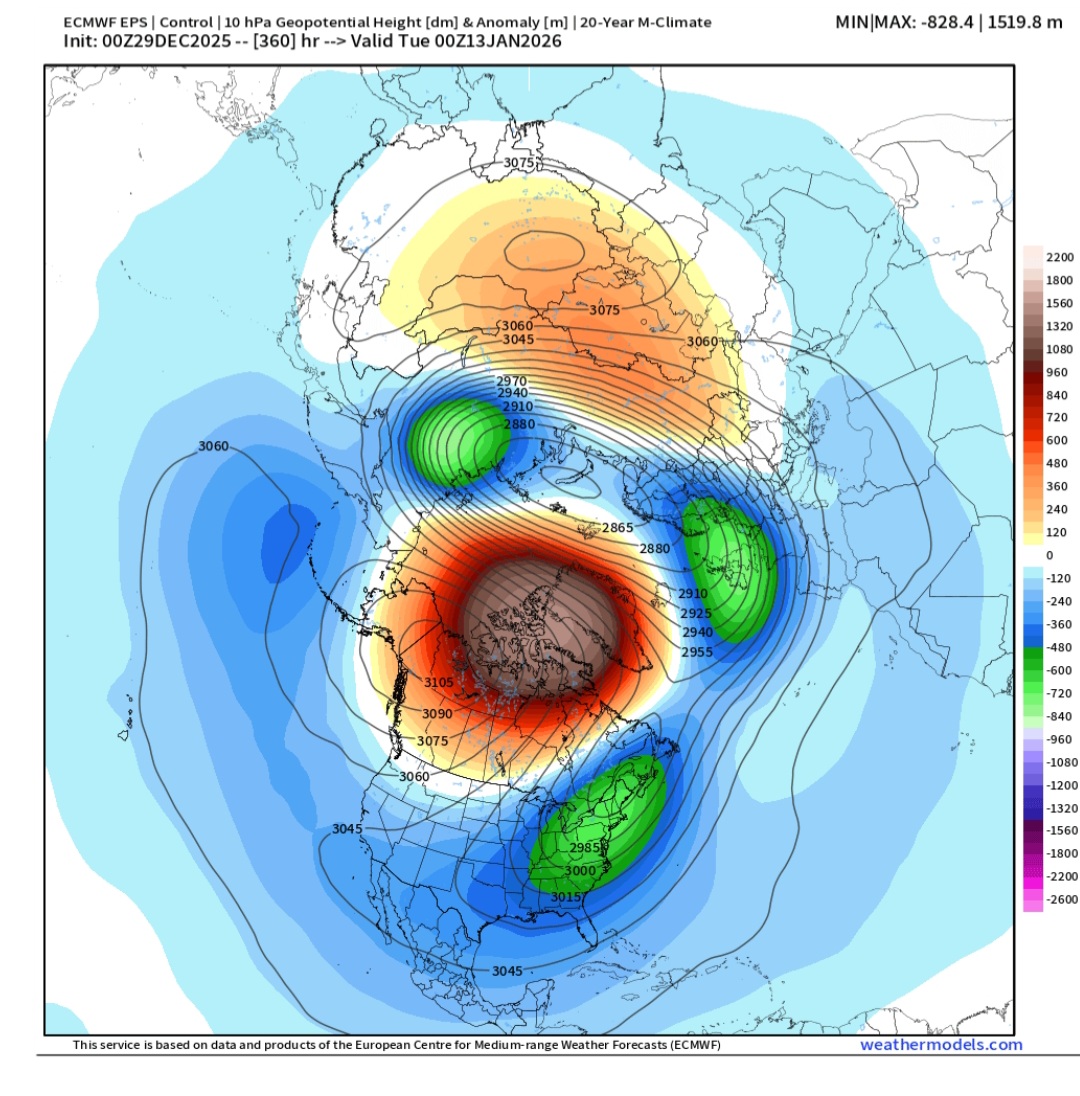
0z model suite...quit the changes. GFS got on board with strat warming event that clearly is the cause for the bridge block late in run as it couples with troposphere: 10mb 50mb I'd say that was the reason the 18z AI -Euro model had a massive bridge blocking:
-
European & Canadian 12z products show another stratospheric warming event in the late period. GFS products had only minor. But the 12z Eurp OP, EPS products & the Canadian spilt the PV at 10mb & 50mb. Here's the Euro OP: 50mb 10mb The EPS control is more aggressive with the strat warmth. Regardless of how strong this should continue to prevent the STP from getting carried away & increase chances of HLB. Hopefully, at some point maybe favorable. Right now it is just a "take note" & see if this goes anywhere.
-
Yesterday forecast: Today:
-
Phase 5 is a blowtorch until you get to May.
-
NOV 26 colder started in phase 6 headed into phase 7 & then into phase 8 through DEC 6. Here is the pattern NOV26-DEC 8 It appears the MJO did indeed influence the pattern....pretty strongly.
-
Agree on the end of month, but disagree on JAN. The best analogs have JAN as the coldest month. So, I think based on the law of averages, we have a decent shot of seeing at least a period of winter in JAN.
-
From Paul Roundy: "Base state supports Bering Strait and Greenland blocking, with troughing in the eastern US. A fast component of the MJO signal moves through Indian basin to Maritime Continent 15-30 Dec offsetting the cold eastern US signal and potentially forcing a period of warm anomalies in the eastern US."
-
Go look at all -QBO La Nina's that had any early strat warming (not full blown SSW). January is the coldest month with thise analogs unlike the +QBO LA Nina's that basically all end winter early JAN. No way to know if it shakes out that way but it is interesting nonetheless.
-
Some of the AI models are radically different on Day 10. It will be interesting to see which is modeled better.
-
I have thought all along we couple be looking at the end if DEC or early JAN.