Search the Community
Showing results for tags 'climate change'.
Found 7 results
-
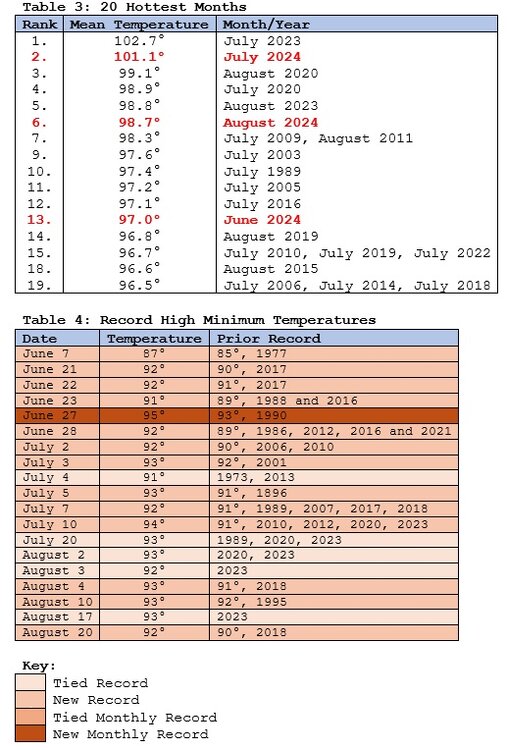
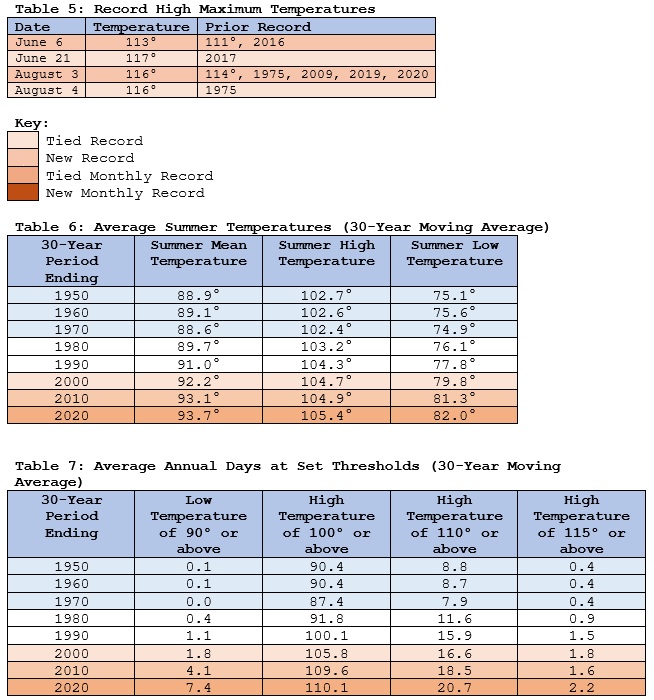
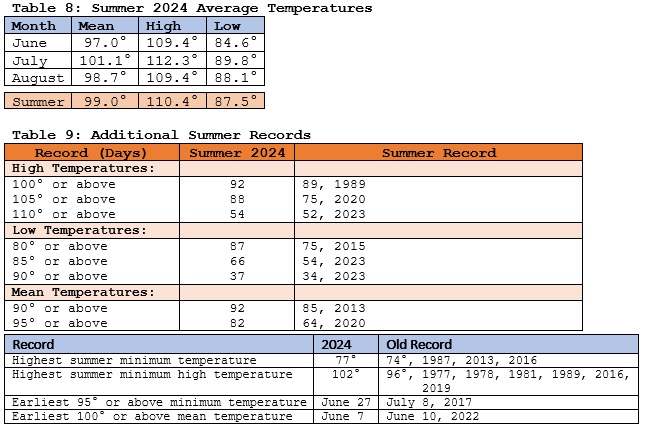
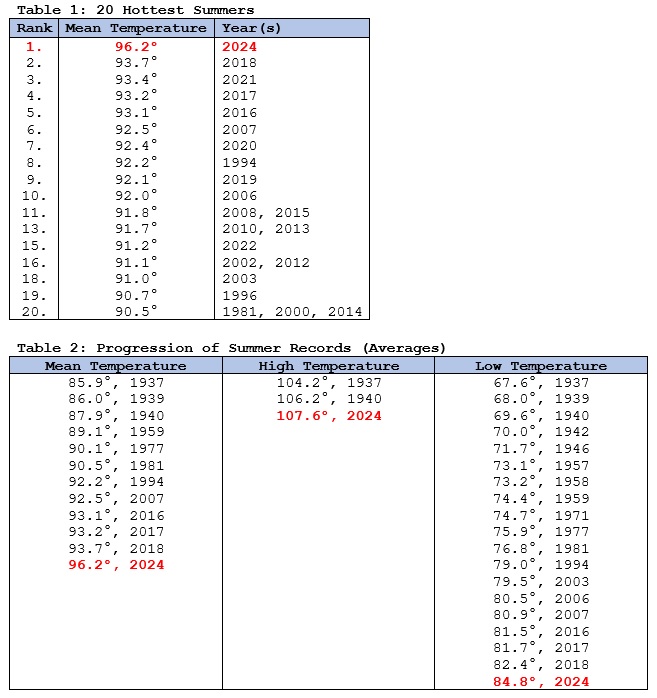
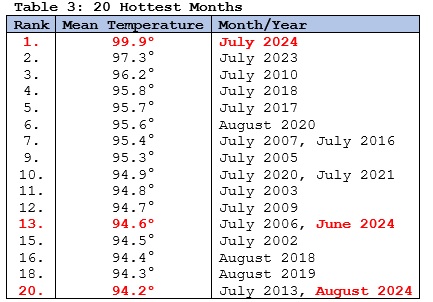
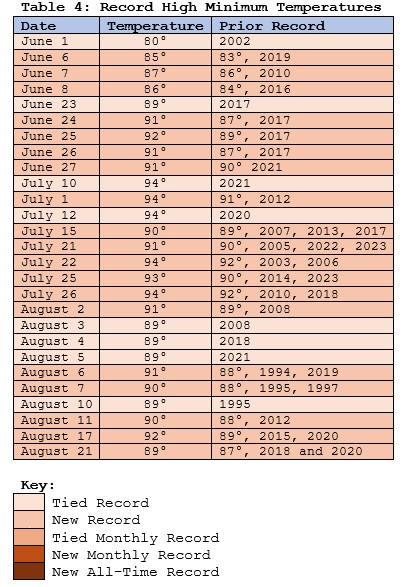
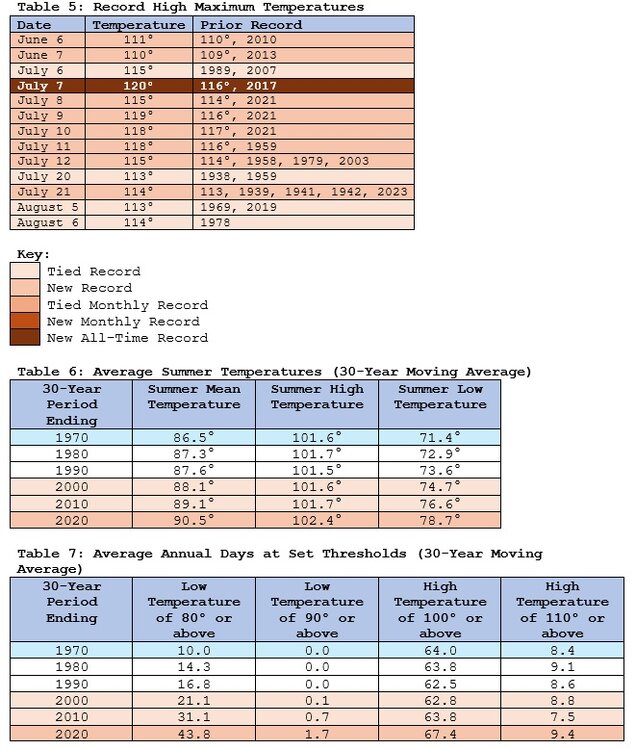
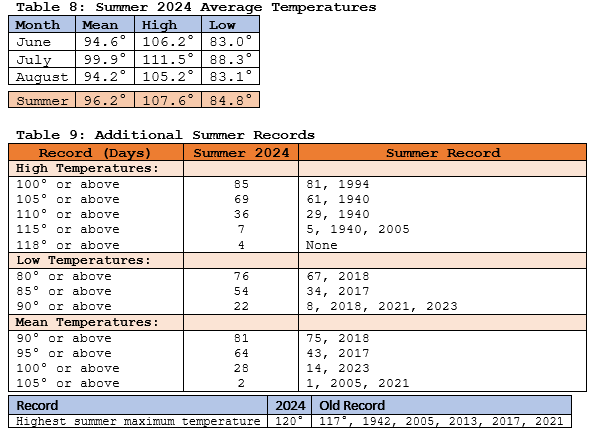
 In what has become a seemingly regular occurrence beginning in 2020, Phoenix has experienced its hottest summer on record. Since 2020, Phoenix has eclipsed the summer mark in 2020, 2023, and again this year. A major theme, as was the case in 2020 and 2023 when the heat set in, was its persistence. Summer 2024 got off to a blazing start with its hottest June, by far, on record. The sizzling June was followed by Phoenix’s second hottest July and second hottest month on record. July featured an 11-day extreme heat event (Clarke et al., 2014 methodology) during which the temperature reached or exceed 115° on six days. That was the second longest such event on record. Summer concluded with the third hottest August on record. On account of the historic heat, Phoenix saw its longest stretches of 80° or above lows, 100° or above highs, and 105° or above highs: 80° or above lows: 74 days, June 5-August 17; old record: 51 days, July 1-August 20, 2023 100° or above highs: 97 days (as of August 31 and ongoing); old record: 76 days, June 10-August 24, 1993 105° or above highs: 63 days, June 5-August 6; old record: 56 days, June 24-August 18, 2023 Anthropogenic climate change amplified by the urban heat island effect is driving a warming of Arizona’s and Phoenix's summers. Data from a joint May 2024 report published by Climate Central, Red Cross Red Crescent Climate Centre and World Weather Attribution revealed that the influence of climate change has resulted in a 231.1% increase in Arizona’s days with temperatures above the 90th percentile (1991-2020 baseline) over the figure expected without the influence of climate change. The warming has accelerated in recent decades. Between 1950 and 2023, summers have warmed by 0.6° per decade in Phoenix. Since 1980, summers have warmed by 0.9° per decade. As a result, Phoenix has set summer records in 2020, 2023, and now 2024. As a result, the annual number of days on which the high temperature has exceeded the 90th percentile for summer maximum readings (1991-2020 baseline) has increased from 6.5 days during 1961-1990 to 9.99 days during 1991-2020. The most recent 30-year moving average (1995-2024) is 12.7 such days per year (through August 31, 2024). Select highlights: Updates: Phoenix records 100th 80° low temperature of the year Progression of Phoenix's Record Streak of 100° Highs Phoenix and Surrounding Area 100° Highs and 80° Lows U.S. Sites with 110 or More Consecutive 100° Highs and Population Hottest Last 7 Days of September Phoenix Experiences its Hottest September on Record Phoenix's Extreme September 28th and October 1st High Temperatures Phoenix Experiences its Hottest First Week of October on Record Phoenix Sets or Ties Daily High Temperature Records on an Unprecedented 21 Consecutive Days Climate Change not the Urban Heat Island Effect drove Phoenix's Record Autumn Heatwave Southwest Region Summer Trends Phoenix Follows its Hottest Summer with its Warmest Fall on Record Phoenix Caps Off its Warmest Year with Its Warmest December on Record
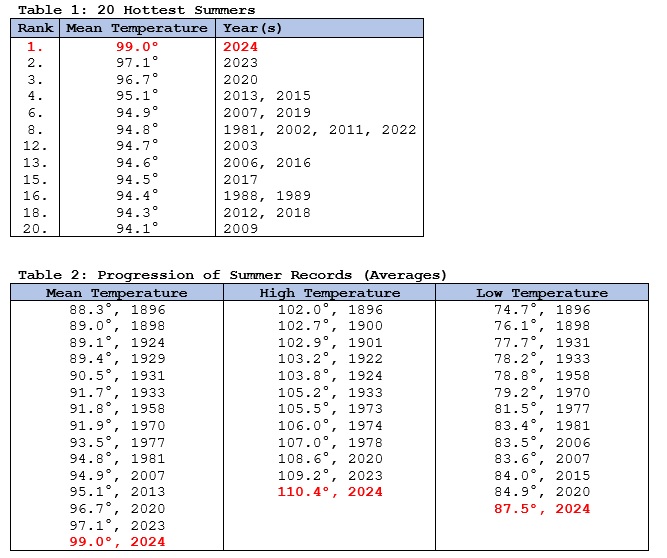
-
After a brief hiatus following three consecutive record hot summers (2016-2018), Las Vegas demolished its summer heat record. Summer 2024 got off to a blistering start with its hottest June on record. July became that City’s hottest month on record. August also became its hottest August on record. July featured a 12-day extreme heat event (Clarke et al., 2014 methodology) during which the temperature reached or exceed 115° on a record seven consecutive days. That extreme heat event was highlighted by Las Vegas’ hottest reading on record (120°) and three other temperatures that surpassed the old all-time mark of 117°. On account of the historic heat, Las Vegas saw its longest stretches of 80° or above lows, 105° or above highs, 110° or above highs, and 115° or above highs: 80° or above lows: 63 days, June 21-August 22; old record: 33 days, July 4-August 5, 2020 105° or above highs: 43 days, June 20-August 1; old record: 25 days, June 15-July 9, 2017 110° or above highs: 11 days, July 3-13; old record: 10 days, June 17-26, 1961 and July 14-23, 2023 115° or above high: 7 days, July 6-12; old record: 4 days, July 16-19, 2005 Anthropogenic climate change amplified by the urban heat island effect is driving a warming of Las Vegas’ summers. The warming has accelerated in recent decades. Between 1950 and 2023, summers have warmed by 0.8° per decade in Las Vegas. Since 1980, summers have warmed by 1.0° per decade. Select highlights:
-
A heatwave of potentially unprecedented proportions for parts of the Pacific Northwest Region, including Oregon, Washington, and British Columbia is now in its early stages of evolving. June high temperature records will likely be shattered across much of the region. Numerous all-time high temperature records will likely be challenged or broken. On Monday, the most populated region in the Pacific Northwest could see widespread temperature anomalies more than 4 standard deviations above the normal figures. A small part of the region could experience temperatures more than 6 standard deviations above normal. Standardized Temperature Anomalies (6/28 18z): Select June, All-Time Records, Forecast Maximum Temperatures: Western sections of Oregon, Washington, and British Columbia, including Portland, Seattle, and Vancouver, will likely see the highest temperatures during the June 26-29 period. Elsewhere, exceptional warmth could persist into the opening days of July. Minimum temperatures will also approach monthly and all-time lows, especially in areas affected by the Urban Heat Island (UHI) effect, namely Portland, Seattle, and Vancouver. Climate change is increasing the frequency, magnitude, and duration of extreme heat events. One important mechanism is through wave resonance events (Mann et al., 2017). If one steps back to a larger hemispheric perspective starting near the beginning of June, one has witnessed the emergence of mega-heat domes in a "whack-a-mole" fashion in the Northern Plains, Southwest, and northern and eastern Europe (including northwestern Russia) that led to record heat, including some monthly or all-time record high temperatures. This latest heat dome is the fourth such major event this month. Updates: Recurrent Rossby Waves, Heatwaves, and Climate Change June 27, 2021: New Canadian National High Temperature Record June 28, 2021: New Canadian National High Temperature Record June 29, 2021: New Canadian National High Temperature Record Unprecedented North American Heatwave Scorches the Pacific Northwest Historic Nature of the Heatwave Attribution Study: 'Virtually Impossible' without Climate Change
-
Galveston’s Record Warm Late Spring and Early Summer
donsutherland1 posted a topic in Climate Change
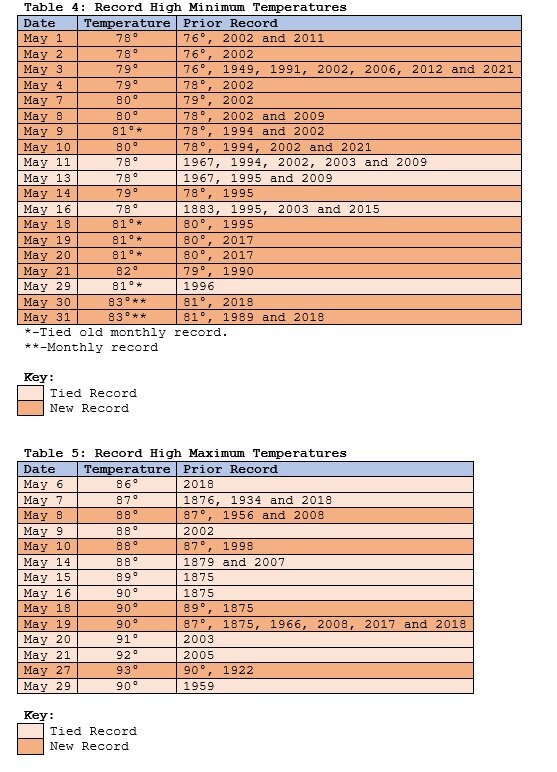
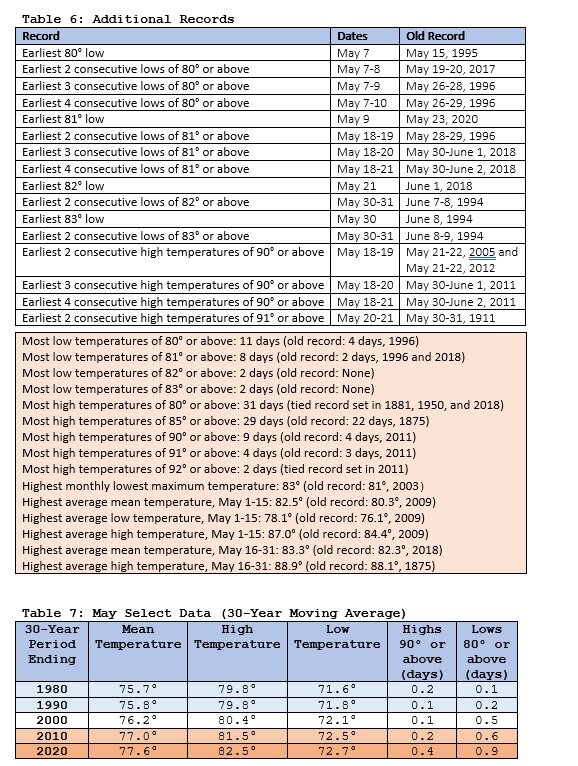
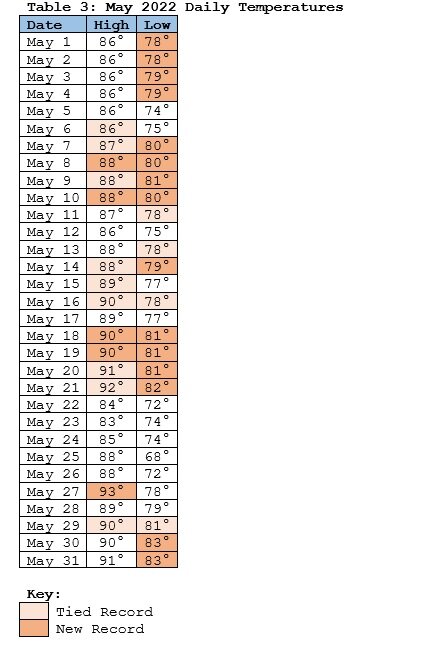
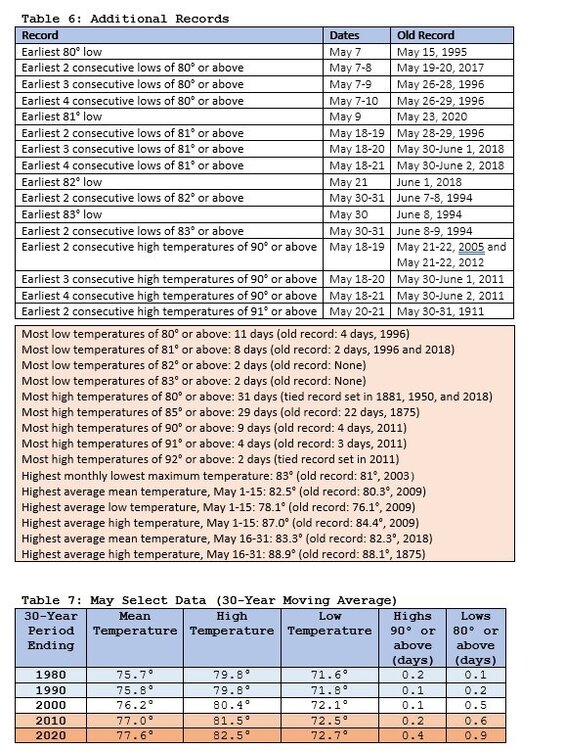
Galveston experienced its warmest December on record last year with a mean temperature of 69.9°, which crushed the old mark of 66.4° that had stood since 1889. The December temperature average was warm enough to qualify as that city's 7th warmest November on record. Since then, one or more record-breaking or record-tying high temperatures were set in each month. April 2022 was the warmest April on record with a mean temperature of 75.5° (old record: 75.0°, 1967 and 2017). Just five months after the historic December warmth, May experienced historic warmth that demolished the monthly record that was set in 2018.The combination of dry conditions, development of a persistent heat dome, and much warmer than normal water temperatures amplified by the impact of climate change produced the record outcome. Summary information on the impacts of climate change in the Houston and Galveston areas can be found here:https://www.globalchange.gov/sites/globalchange/files/CCPR_HOU_brochure-final.pdfFor background information, the mean temperature rose 2.0° at Galveston from the 1961-1990 period to the 1991-2020 period. The number of 90° days rose particularly sharply. Annual temperature: 1961-90: 69.7°; 1991-20: 71.7°Number of days with highs of 80° or above: 1961-90: 151.0 days; 1991-20: 175.7 daysNumber of days with highs of 85° or above: 1961-90: 92.3 days; 1991-20: 126.0 daysNumber of days with highs of 90° or above: 1961-90: 13.5 days; 1991-20: 58.2 daysNumber of days with lows of 80° or above: 1961-90: 52.1 days; 1991-20: 62.3 daysThe last year with fewer than 100 85° days was 1997 when there were 94 such days. The last year with fewer than 20 90° days was 1992 when there were just 7 such days.80° warmth has now been occurring both earlier and later in the season as the "hot" season lengthens.Number of days with highs of 80° or above in March-April: 1961-90: 1.1 days; 1991-20: 4.3 daysNumber of days with highs of 80° or above in November-December: 1961-90: 0.5 days; 1991-20: 1.8 daysThe synoptic pattern, regional drought, and warm sea surface temperatures occurred against the backdrop of a warming climate that was resulting in a dramatic increase in hot days. As a result, May 2022 essentially rewrote the record book for warmth in May. Charts follow: Updates: Warmest first week of June Warmest June 1-15 Warmest June on Record Stations with 3 consecutive record warm months with long periods of record (through June 2022) Summers in Galveston Stations with 3 consecutive record warm months with long periods of records (through July 2022) Hottest July and Month on Record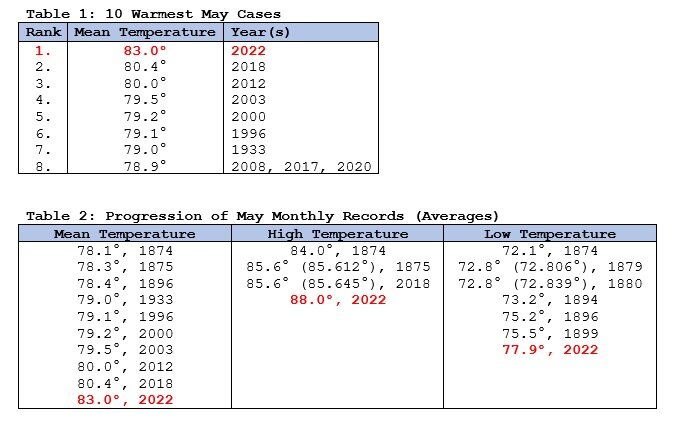

-
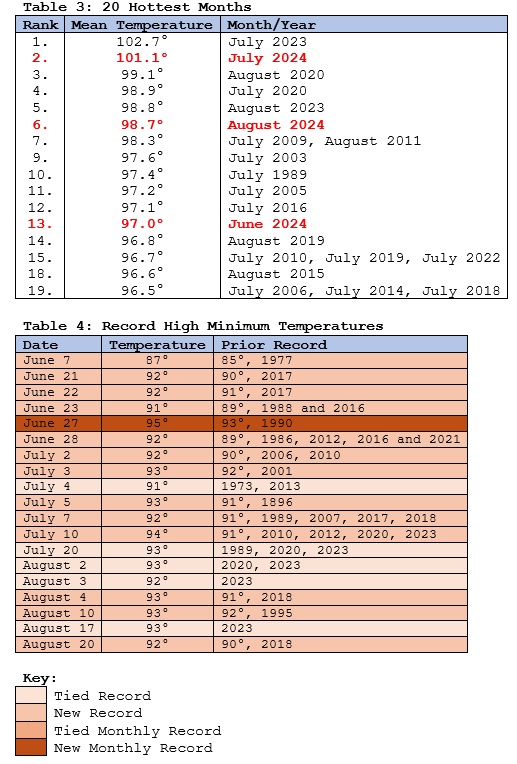
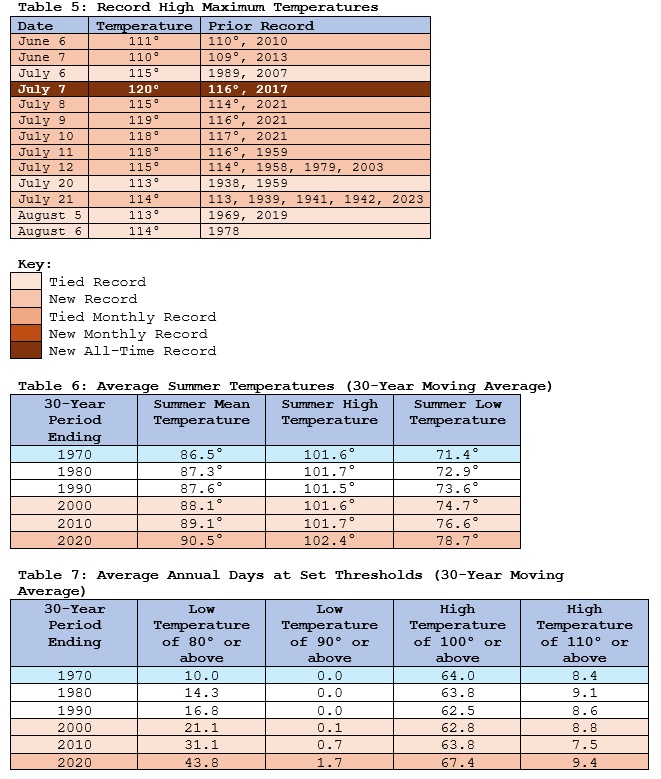
Last year, Phoenix experienced a historically hot summer. Although the extreme heat held off through May this year, a severe heatwave developed toward mid-June. The June 2021 heatwave was among Phoenix's and Tucson's most severe June heatwaves and their most severe heatwave this early in the season. This heatwave developed as an extreme upper air ridge evolved during an era of rising June temperatures and an ongoing drought. An extreme heat event commenced at Tucson on June 11 and it commenced at Phoenix on June 13. Such events are likely to become even more frequent in the years ahead. Anthropogenic warming is creating a growing likelihood of long-duration extreme events through more frequent wave resonance events (Kornhuber et al., 2016 and Mann et al., 2017). Already, the frequency and intensity of compound summertime hot extremes (events that combine daytime and nighttime heat where such temperatures are above their 90th percentile for their calendar) has been increasing especially in geographic locations that include the U.S. Southwest (Wang 2020). The increase in forcing associated with anthropogenic greenhouse gases is the dominant driver of this outcome (Wang 2020). Table 1: Phoenix's High Temperatures during June 12-20, 2021 Table 2: Phoenix's Average June Temperatures (30-Year Moving Average) Table 3: Phoenix's Record High Maximum Temperatures Table 4: Phoenix's Record High Minimum Temperatures A portion of this heatwave qualified as the 8th Extreme Heat Event (EHE) on record for June, as at least 3 days saw the maximum , temperature exceed the 97.5th percentile (Phoenix: 115° or above; Tucson: 110° or above), the high temperature average exceeded the 97.5th percentile (Phoenix: 115° or above; Tucson: 110° or above), and all high temperatures exceeded the 81st percentile (Phoenix: 110° or above; Tucson: 105° or above) in June-August high temperatures for the 1971-2000 base period (Clarke, et al.,2014). The extreme heat event began on June 11 in Tucson and June 12 at Phoenix. Table 5: Phoenix's Extreme Heat Events in June (1896-2021) Additional Records: Earliest 116° or above high temperature: June 17, 2021 (old record: June 19, 2016 and 2017) Earliest 4 consecutive 115° days: June 15-18, 2021 (old record: June 19-22, 1968) Most consecutive 115° days: 6, June 15-20, 2021 (old record: 4, June 19-22, 1968; June 25-28, 1979; June 25-28, 1990; July 26-29, 1995; July 28-31, 2020; and, August 16-19, 2020) Earliest 4-day average high temperature of 115° or above: June 14-17, 2021 (old record: June 18-21, 2017) Earliest 5-day average high temperature of 115° or above: June 14-18, 2021 (old record: June 17-21, 2017) Earliest 6-day average high temperature of 115° or above: June 13-18, 2021 (old record: June 18-23, 2017) Earliest 7-day average high temperature of 115° or above: June 13-19, 2021 (old record: June 18-24, 2017) Earliest 8-day average high temperature of 115° or above: June 13-20, 2021 (old record: June 18-25, 2017) Earliest mean temperature of 100° or above: June 15, 2021 (old record: June 17, 2008) Earliest 2-day average mean temperature of 100° or above: June 15-16, 2021 (old record: June 17-18, 2008 and 2015) Earliest 3-day average mean temperature of 100° or above: June 14-16, 2021 (old record: June 17-19, 2015) Earliest 4-day average mean temperature of 100° or above: June 14-17, 2021 (old record: June 18-21, 2017) Earliest 5-day average mean temperature of 100° or above: June 13-17, 2021 (old record: June 18-22, 2017) Earliest 6-day average mean temperature of 100° or above: June 13-18, 2021 (old record: June 18-23, 2017) Earliest 7-day average mean temperature of 100° or above: June 13-19, 2021 (old record: June 18-24, 2017) Earliest 8-day average mean temperature of 100° or above: June 12-19, 2021 (old record: June 17-24, 2017) Earliest 91° minimum temperature: June 17, 2021 (old record: June 22, 2017) Earliest 92° minimum temperature: June 18, 2021 (old record: June 25, 2017) Earliest 2 consecutive 90° low temperatures: June 16-17, 2021 (old record: June 21-22, 2017) Earliest 3 consecutive 90° low temperatures: June 16-18, 2021 (old record: June 29-July 1, 2013) Earliest 4 consecutive 90° low temperatures: June 16-19, 2021 (old record: July 8-11, 2020) Most consecutive 90° low temperatures in June: 4, June 16-19, 2021 (old record: June 26-27, 1990; June 29-30, 2013; June 26-27, 2016; June 21-22, 2017; and, June 25-26, 2017) Earliest 2-day average low temperature of 90° or above: June 16-17, 2021 (old record: June 21-22, 2017) Earliest 3-day average low temperature of 90° or above: June 16-18, 2021 (old record: June 24-26, 2017) Earliest 4-day average low temperature of 90° or above: June 16-19, 2021 (old record: July 4-7, 2018) Earliest 5-day average low temperature of 90° or above: June 16-20, 2021 (old record: June 22-26, 2017) Earliest 6-day average low temperature of 90° or above: June 16-21, 2021 (old record: June 21-26, 2017) Highest average June minimum temperature after over 4 days: 91.0°, June 16-19, 2021 (old record: 89.8°, June 24-27, 1990; June 25-28, 1990; June 26-29, 1990; June 27-30, 1990; and, June 23-26, 2017) Highest average June minimum temperature after over 5 days: 90.6°, June 16-20, 2021 (old record: 90.0°, June 26-30, 1990 and June 22-26, 2017) Tucson also experienced extreme heat. As with Phoenix, Tucson has seen a steady increase in June minimum and maximum temperatures. This outcome has increased the statistical probability of extreme heat events. Table 1: Tucson's High Temperatures during the June 11-21, 2021 Heatwave Table 2: Tucson's Average June Temperatures (30-Year Moving Average) Table 3: Tucson's Record High Maximum Temperatures Table 4: Tucson's Record High Minimum Temperatures Table 5: Tucson's Extreme Heat Events in June Additional Records: Most consecutive days with high temperatures of 110° or above: 8, June 12-19, 2021 (old record: 6, June 24-29, 1994) Most consecutive days with high temperatures of 111° or above: 7, June 13-19, 2021 (old record: 6, June 24-29, 1994) Most consecutive days with high temperatures of 112° or above: 7, June 13-19, 2021 (old record: 4, June 25-28, 1990) Highest average high temperature over 8 days: 112.5°, June 12-19, 2021 (tied record set during June 23-30, 1994) Updates: Phoenix has its hottest June on record
- 33 replies
-
- 1
-

-
- heatwave
- extreme heat event
- (and 5 more)
-
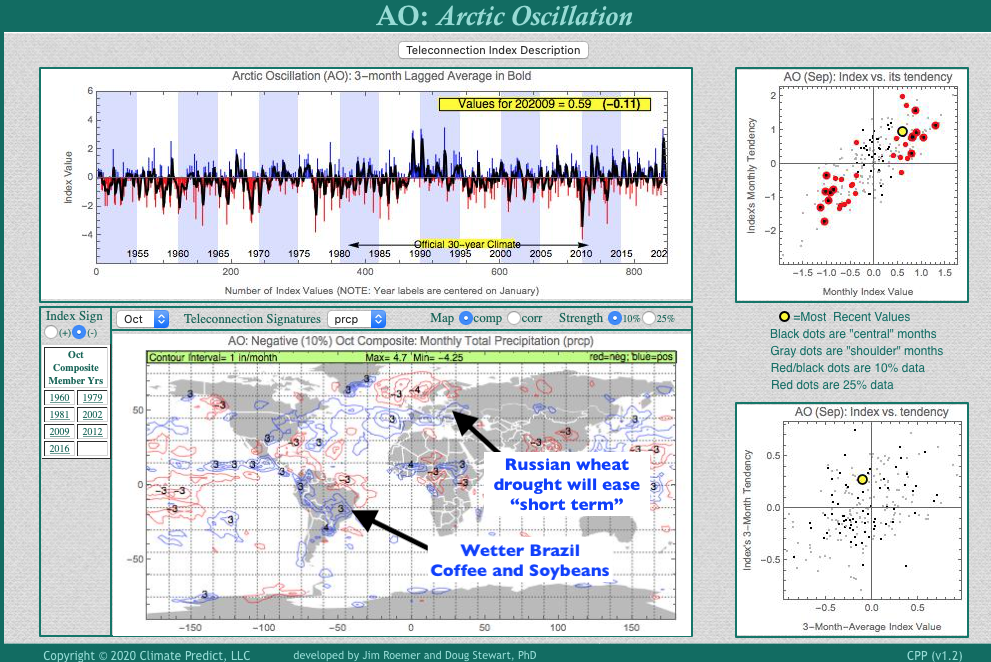
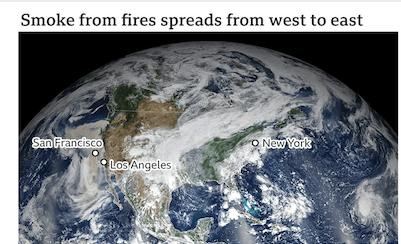
 As a lover of the weather, many of you are probably interested and potentially talented enough to learn how to use your skill to trade commodity futures and conservative options such as natural gas (UNG), coffee (JO) and the grain market. While everyone gets excited about snowstorms, there is just as much potential excitement watching stocks and commodities affected by weather. Yes, watching stocks such as Apple and Amazon soar over the years may. not be your cup of tea, so why not learn how to use weather forecasts to make investments in things affected by weather. While I am firm believer in climate change and a warming planet, this winter has the potential to be much colder. I began telling clients last week that I thought we would go into a negative Arctic Oscillation Phase as shown on the upper right. Other than La Nina, it is quite possible that "aerosols" from the historic western fires are getting caught up in the atmosphere and warming the Arctic. This will help the AO index to go negative with cold late fall weather in at least the Midwest and possibly the eastern U.S. OCTOBER GLOBAL RAINFALL ANAMOLIES WHEN THE AO INDEX IS NEGATIVE My teleconnection program at www.climatepredict.com is free for you to use and you can click on different teleconnections such as the AO index and see historical rainfall, snowfall and temperature trends months in advance. Notice, for example, how in October other commodities such as coffee, wheat and soybeans are influenced by the negative AO index. I will be starting a much less expensive, monthly global commodity weather newsletter that is much more affordable from my web site www.bestweatherinc.com. and if you are interested in learning about commodities and weather you can always sign up for a FREE trial Regards, Jim
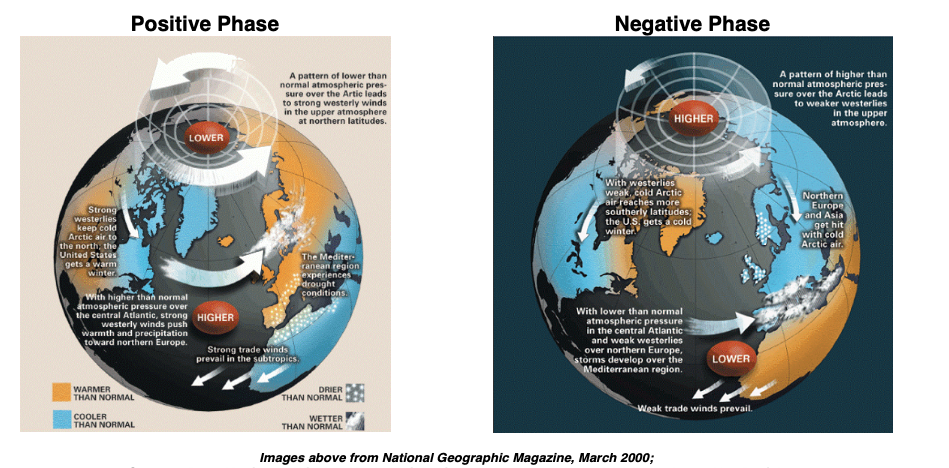
-
Abstract: Extreme weather events in Asia have been occurring with increasing frequency as the globe warms in response to rising concentrations of greenhouse gases. Many of these events arise from weather regimes that persist over a region for days or even weeks, resulting in disruptive heatwaves, droughts, flooding, snowfalls, and cold spells. We investigate changes in the persistence of large-scale weather systems through a pattern-recognition approach based on daily 500 hPa geopotential height anomalies over the Asian continent. By tracking consecutive days that the atmosphere resides in a particular pattern, we identify long-duration events (LDEs), defined as lasting longer than three days, and measure their frequency of occurrence over time in each pattern. We find that regimes featuring positive height anomalies in high latitudes are occurring more often as the Arctic warms faster than mid-latitudes, both in the recent past and in model projections for the twenty-first century assuming unabated greenhouse gas emissions. The increased dominance of these patterns corresponds to a higher likelihood of LDEs, suggesting that persistent weather conditions will occur more frequently. By mapping observed temperature and precipitation extremes onto each atmospheric regime, we gain insight into the types of disruptive weather events that will become more prevalent as particular patterns become more common. https://www.nature.com/articles/s41598-020-71945-4
-
- 1
-

-
- arctic amplification
- climate change
- (and 1 more)