

GaWx
-
Posts
16,452 -
Joined
Content Type
Profiles
Blogs
Forums
American Weather
Media Demo
Store
Gallery
Posts posted by GaWx
-
-
17 hours ago, GaWx said:
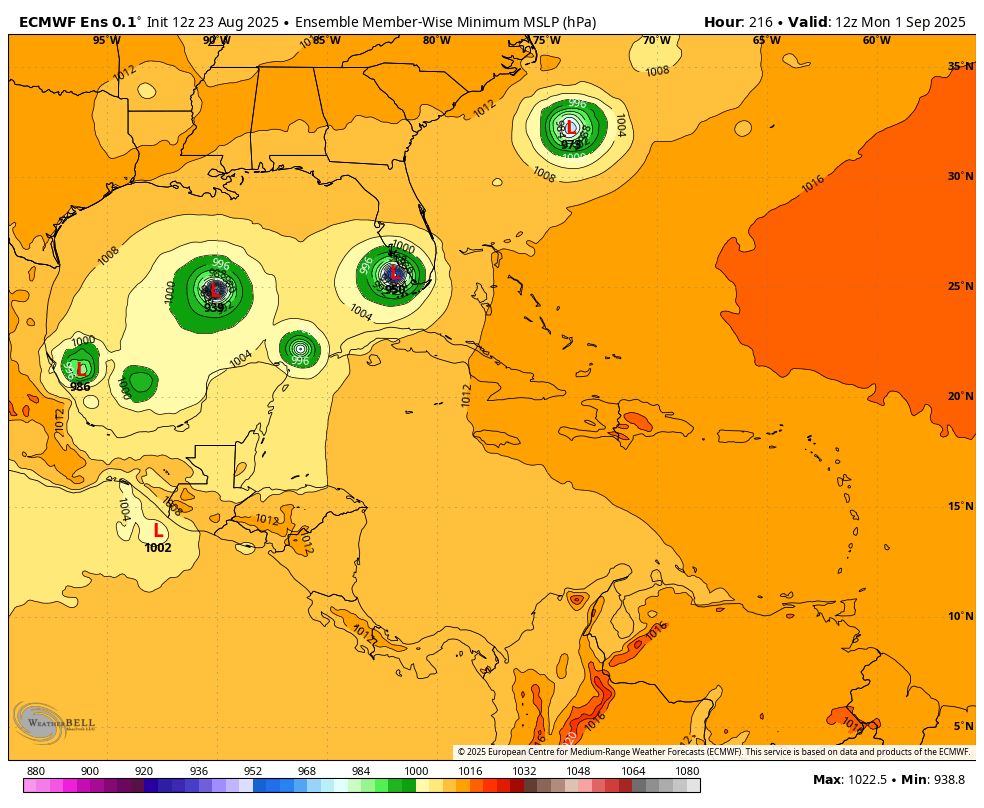
In addition to the 12Z Icon being still another of its runs developing this in the W Caribbean, the 12Z Euro ens is significantly more active:
However, the 0Z Euro ens wasn’t nearly as active as the 12Z EE.
The 6Z GEFS by my eyeballing has 5 (17%) TS+ members. So, not dead by any means but not all that active either.
-
6 hours ago, NorthHillsWx said:
With the anomalous trough and major fronts already impacting the east coast I would say the odds of an east coast impact from something other than home brew are likely decreasing. We’re in an October pattern in August
Being a near east-coaster and also considering last year’s devaststing killer season, especially in NC, I sincerely love your optimism and hope the current pattern holds. One hit already this season is more than enough. Besides it’s fortunately not easy for the EC to be hit compared to the Gulf. Getting two EC TS+ hits in one year isn’t too common…~1/3 of years since 1995.
However, regarding EC hits from storms that weren’t home-brew:
-2022’s only hit wasn’t til 9/30 (Ian)
-2018’s only hit wasn’t til 9/14 (Florence)
-2016’s only hit other than TS Bonnie in May wasn't til 10/8 (Matthew)
-2012’s only hit other than TS Beryl in May wasn't til 10/29 (Sandy)
-2003’s only hit wasn’t til 9/18 (Isabel)
-1999’s only H hit wasn’t til 9/15-6 (Floyd)
-1989’s only hit wasn’t til 9/21-2 (Hugo)
-1985’s worst hit by far wasn't til 9/26-7 (Gloria)
-1950’s only hit wasn’t til 10/17 (King)
-1947 had a rare 3 EC hits and they were all 9/17+ and only one was home-brew
-1945 had one H hit and it wasn’t til 9/15
-1944’s worst H hit wasn’t til 9/14
-1941’s only hit wasn’t til 10/6
-1938’s only hit wasn’t til 9/21
-1928’s worst hit wasn’t til 9/16
-1898’s worst hit by far wasn’t til 10/2
So, these 16 years’ EC hits weren’t til 9/14+ and 50% weren’t til 9/21+.-
 4
4
-
-
After that re-drenching ~2” that fell yesterday evening, I’ve had as of 11PM only some on and off largely light rain since early this morning amounting to <0.1” here despite some nearby areas having heavier rains. That gets me to a ridiculous ~16.7” MTD! The mosquitos have been constantly partying this month like it was 1999.
We’ll see how the rest of the night goes.-
2
-
-
12 minutes ago, donsutherland1 said:
I used the latest normals. That makes almost everything appear cold. Here’s the same chart using the NOAA’s 20th century mean as the baseline.
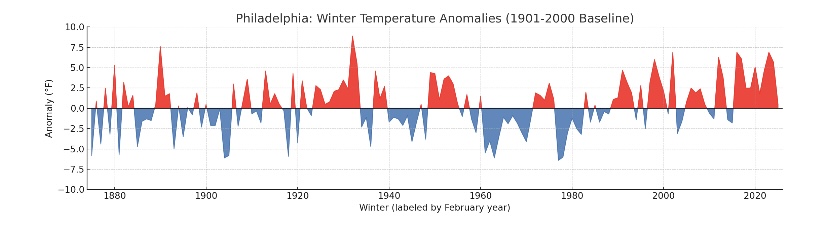
Yeah, I realized you were using 1991-2020 normals. But on that and even on the 2nd chart, it still looks to me like the bulk of the warming at Phil. has been since the late (or maybe mid) 1980s.
Imagine cutting the 2nd chart off in 1987. If so, I don’t think any longterm warming trend would show. Instead, it appears to me like the line would be pretty flat. Do you see what I’m seeing?-
2
-
-
14 minutes ago, donsutherland1 said:
Here's how Philadelphia's winters look against the current (very warm) baseline normals:
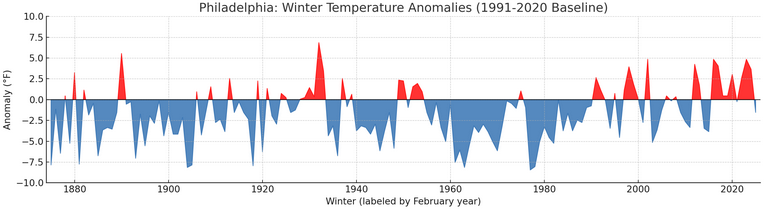
Don,
Am I looking at that graph right? Has virtually all of the warming at Phil been since the late 1980s?-
1
-
-
22 hours ago, gallopinggertie said:
The current rate of global warming is pretty much unprecedented in the geological record. Wouldn’t the current amount of undersea volcanic activity then also have to be unprecedented to be the main driver of the warming?
But it isn’t, is it? The Earth has gone through periods of volcanic activity way more intense than anything that’s currently taking place.
The rate of CO2 increase on the other hand is also pretty unprecedented…just like the speed of this warming. Hmm. Really makes ya think, doesn’t it?
3 hours ago, bdgwx said:He was the editor-in-chief for the now defunct predatory journal Environment Pollution & Climate Change owned by OMICS. OMICS, subsidiaries, and personnel were investigated for academic fraud in 2016 and were found to have run as many 700 predatory journals and deceived numerous article authors. A judge ordered the India based company to pay $50 million in damages. Viterito defended his involvement with the predatory journal he ran.
And his "scientific" positions defy credulity. He allowed an article that stated that the greenhouse effect cannot be real because the atmosphere does not have a roof like a real greenhouse. Even the most predatory of predatory journals would usually reject that kind nonsense. So this must have been a whole new level of ineptitude.
If Viterito isn't a climate troll then he is doing everything he possibly can to convince everyone that he is. Why? I have no idea.
Thanks for your replies!
I’m all for open discussion of alternative ideas and that’s why I posted this and others from him. If the alternative idea appears to be plausible, it would probably be supported to an extent. OTOH, if not, it would likely be refuted.
Also, I feel it’s important for others to be aware of what’s being spread to so many people (Weather Bell subs in this case) whether plausible or not. Thus, I expect to continue posting Dr. V stuff.
In this case, Dr. V’s idea has been refuted several times here. That helps others like myself to be more knowledgeable about the doubtfulness of the plausibility of his idea. Not only that, I learned thanks to bdgwx about OMICS and its fraud.
Today, JB posted this as a followup:
I'm now going to incorporate this into my (forever) paper which is now in its second draft. The finished product will then be submitted to The International Journal of Environmental Sciences and Natural Resources, a peer-reviewed journal that has accepted other papers I've written in the past (in fact, they solicit me on a regular basis for contributions). That paper will then get passed on to Tom Nelson, EPA Administrator Lee Zeldin, and my Congressional Representative, Mike Haridopolis. That will hopefully get the geothermal hypothesis onto a higher plane.
The bolded adds even more to my doubts about Dr. V. Why? I hate to bring politics into this, but Zeldin and Haridopolis are far righties, which imho has been the source of a lot of misinfo of all kinds, including CC. I’m saying that as a moderate independent as I’m not a liberal or a Democrat. Also, Thomas Nelson is the producer of “Climate The Movie: The Cold Truth”, which tries to minimize the significance of AGW.
-
1
-
 1
1
-
-
A hurricane is possible by Mon:
Tropical Storm Fernand Discussion Number 1
NWS National Hurricane Center Miami FL AL062025
500 PM AST Sat Aug 23 2025
The trough of low pressure (AL90) located a few hundred miles
south-southeast of Bermuda has become better organized today. An
Air Force Reserve Hurricane Hunter aircraft found a well-defined
center during the past couple of hours, with a central pressure of
about 1010 mb. The initial intensity is set to 35 kt, based on
earlier scatterometer data which had a few believable
tropical-storm-force wind vectors, and a Dvorak classification of
35 kt from TAFB.
The initial motion is north or 010/13 kt. A north-northeastward
motion is anticipated during the next couple of days with a slow
increase in forward speed due to Fernand moving around the western
periphery of the subtropical ridge. The storm will likely
accelerate to the northeast thereafter as the system gets caught up
in faster mid-latitude flow, well to the southeast of Newfoundland.
The global models are in good agreement on this scenario, and the
NHC forecast is on the eastern side of the guidance, closest to the
HFIP Corrected- Consensus Model (HCCA).
Fernand has about 48 hours over warm waters within generally light
shear to intensify. There is a fair bit of mid-level dry air,
however, which could hinder any rapid strengthening, so the
intensity forecast will just show a more gradual increase in winds.
All of the models peak the system as an upper-end tropical storm or
category 1 hurricane, and the NHC forecast is just shy of a
hurricane as a peak. After Monday, Fernand should weaken due
to the influences of cooler waters and increasing shear, and the
storm will likely become post-tropical in 3-4 days.
FORECAST POSITIONS AND MAX WINDS
INIT 23/2100Z 27.2N 61.4W 35 KT 40 MPH
12H 24/0600Z 29.0N 61.0W 40 KT 45 MPH
24H 24/1800Z 31.4N 60.3W 50 KT 60 MPH
36H 25/0600Z 33.6N 59.5W 55 KT 65 MPH
48H 25/1800Z 35.8N 58.5W 60 KT 70 MPH
60H 26/0600Z 38.2N 56.7W 55 KT 65 MPH
72H 26/1800Z 41.3N 54.0W 50 KT 60 MPH
96H 27/1800Z 47.0N 44.0W 40 KT 45 MPH...POST-TROP/EXTRATROP
120H 28/1800Z...DISSIPATED
$$
Forecaster Blake -
We’re apparently about to have TS Fernand a few hundred miles SSE of Bermuda. Also, Invest 99L is significantly more active on the 12Z Euro ens as it gets to the W Caribbean in ~a week. If it actually does develop there, watch out!
-
It appears they’re going right to TS Fernand based on this:
AL, 06, 2025082318, , BEST, 0, 266N, 617W, 35, 1010, TS, 34, NEQ, 0, 90, 0, 0, 1015, 110, 90, 0, 0, L, 0, , 0, 0, FERNAND, S, 0, , 0, 0, 0, 0, genesis-num, 019, TRANSITIONED, alB02025 to al062025,
-
In addition to the 12Z Icon being still another of its runs developing this in the W Caribbean, the 12Z Euro ens is significantly more active:
-
This is the 1st time I can recall them going near 100% and them not designating it a TC at the next 6 hourly normal issuance time! If they’re waiting for recon, why not go 90%? Or why not issue a PTC advisory?
-
2
-
-
Tropical Weather Outlook
NWS National Hurricane Center Miami FL
800 AM EDT Sat Aug 23 2025
For the North Atlantic...Caribbean Sea and the Gulf of America:
Southwestern Atlantic (AL90):
Satellite images indicate that an area of low pressure has formed
about 500 miles south-southeast of Bermuda, and the associated
showers and thunderstorms continue to show signs of organization. A
tropical depression is expected to form later today or tonight, with
further intensification to a tropical storm likely on Sunday while
the low moves northward over the southwestern Atlantic. An Air
Force Reconnaissance aircraft is scheduled to investigate the low
this afternoon. Interests in Bermuda should monitor the progress of
this system as watches could be still required later today. For
additional information, including gale warnings, please see High
Seas Forecasts issued by the National Weather Service.
* Formation chance through 48 hours...high...near 100 percent.
* Formation chance through 7 days...high...near 100 percent.-
 1
1
-
-
After light rain earlier this evening, heavier rain has developed here.
Edit:
Related to the above:
FLOOD ADVISORY
NATIONAL WEATHER SERVICE CHARLESTON SC
757 PM EDT FRI AUG 22 2025..FLOOD ADVISORY IN EFFECT UNTIL 10 PM EDT THIS EVENING
* WHAT...FLOODING CAUSED BY EXCESSIVE RAINFALL IS EXPECTED.
* WHERE...PORTIONS OF SOUTHEAST GEORGIA, INCLUDING THE FOLLOWING
COUNTY, CHATHAM AND SOUTHEAST SOUTH CAROLINA, INCLUDING THE
FOLLOWING COUNTY, JASPER.
* WHEN...UNTIL 1000 PM EDT.
* IMPACTS...MINOR FLOODING IN LOW-LYING AND POOR DRAINAGE AREAS.
* ADDITIONAL DETAILS...
- AT 756 PM EDT, DOPPLER RADAR INDICATED HEAVY RAIN DUE TO
THUNDERSTORMS. MINOR FLOODING IS ONGOING OR EXPECTED TO BEGIN
SHORTLY IN THE ADVISORY AREA. BETWEEN 0.5 AND 1 INCH OF RAIN
HAS FALLEN.
- ADDITIONAL RAINFALL AMOUNTS OF 0.5 TO 1.5 INCHES ARE EXPECTED
OVER THE AREA. THIS ADDITIONAL RAIN WILL RESULT IN MINOR
FLOODING.
- SOME LOCATIONS THAT WILL EXPERIENCE FLOODING INCLUDE...
POOLER, DOWNTOWN SAVANNAH, HUTCHINSON ISLAND, MIDTOWN
SAVANNAH, HUNTER ARMY AIRFIELD, WINDSOR FOREST, WILMINGTON
ISLAND, COFFEE BLUFF, SAVANNAH INTERNATIONAL AIRPORT AND
MONTGOMERY.——————-
Edit:
FLOOD ADVISORY
NATIONAL WEATHER SERVICE CHARLESTON SC
958 PM EDT FRI AUG 22 2025

GAC051-SCC053-230300-
/O.EXT.KCHS.FA.Y.0122.000000T0000Z-250823T0300Z/
/00000.N.ER.000000T0000Z.000000T0000Z.000000T0000Z.OO/
CHATHAM GA-JASPER SC-
958 PM EDT FRI AUG 22 2025

..FLOOD ADVISORY NOW IN EFFECT UNTIL 11 PM EDT THIS EVENING

* WHAT...FLOODING CAUSED BY EXCESSIVE RAINFALL CONTINUES.

* WHERE...PORTIONS OF SOUTHEAST GEORGIA, INCLUDING THE FOLLOWING
COUNTY, CHATHAM AND SOUTHEAST SOUTH CAROLINA, INCLUDING THE
FOLLOWING COUNTY, JASPER.

* WHEN...UNTIL 1100 PM EDT.

* IMPACTS...MINOR FLOODING IN LOW-LYING AND POOR DRAINAGE AREAS.

* ADDITIONAL DETAILS...
- AT 958 PM EDT, DOPPLER RADAR INDICATED HEAVY RAIN. MINOR
FLOODING IS ONGOING OR EXPECTED TO BEGIN SHORTLY IN THE
ADVISORY AREA. BETWEEN 1 AND 2.5 INCHES OF RAIN HAVE FALLEN.
- ADDITIONAL RAINFALL AMOUNTS OF 0.5 TO 1.5 INCHES ARE EXPECTED
OVER THE AREA. THIS ADDITIONAL RAIN WILL RESULT IN MINOR
FLOODING.
- SOME LOCATIONS THAT WILL EXPERIENCE FLOODING INCLUDE...
POOLER, DOWNTOWN SAVANNAH, HUTCHINSON ISLAND, MIDTOWN
SAVANNAH, HUNTER ARMY AIRFIELD, WINDSOR FOREST, WILMINGTON
ISLAND, COFFEE BLUFF, SAVANNAH INTERNATIONAL AIRPORT AND
MONTGOMERY.
———-
Edit: I ended up with ~2” (backyard is soaked yet again) bringing me to ~16.65” MTD!!
-
Fwiw, the 12Z JMA very similarly to the Icon has a TD that forms on 8/29 in the NW Caribbean and moves NW toward the N. Yucatan:
-
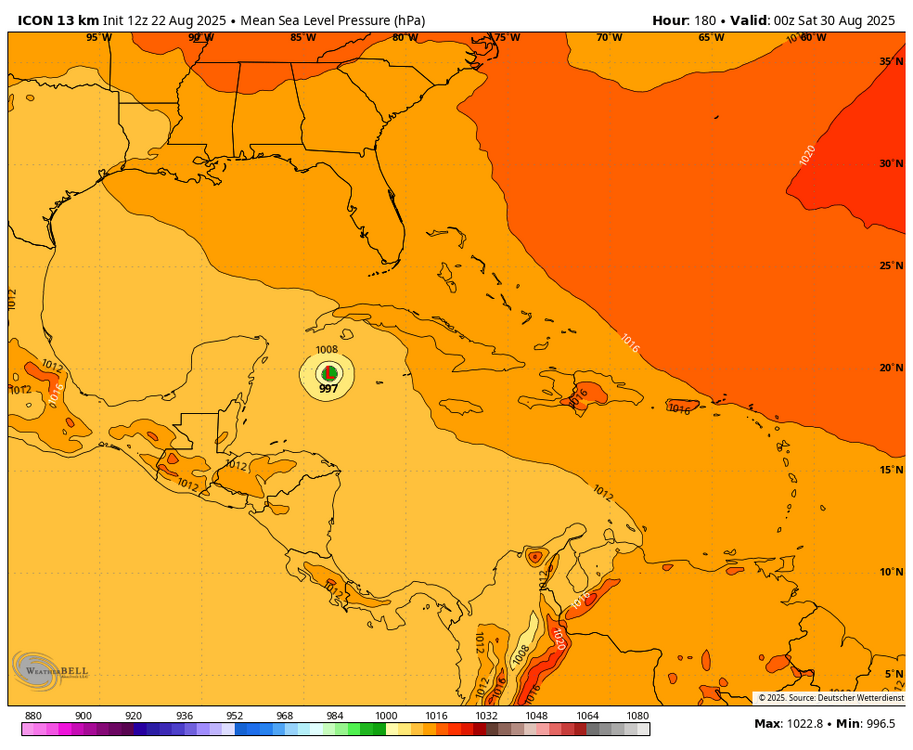
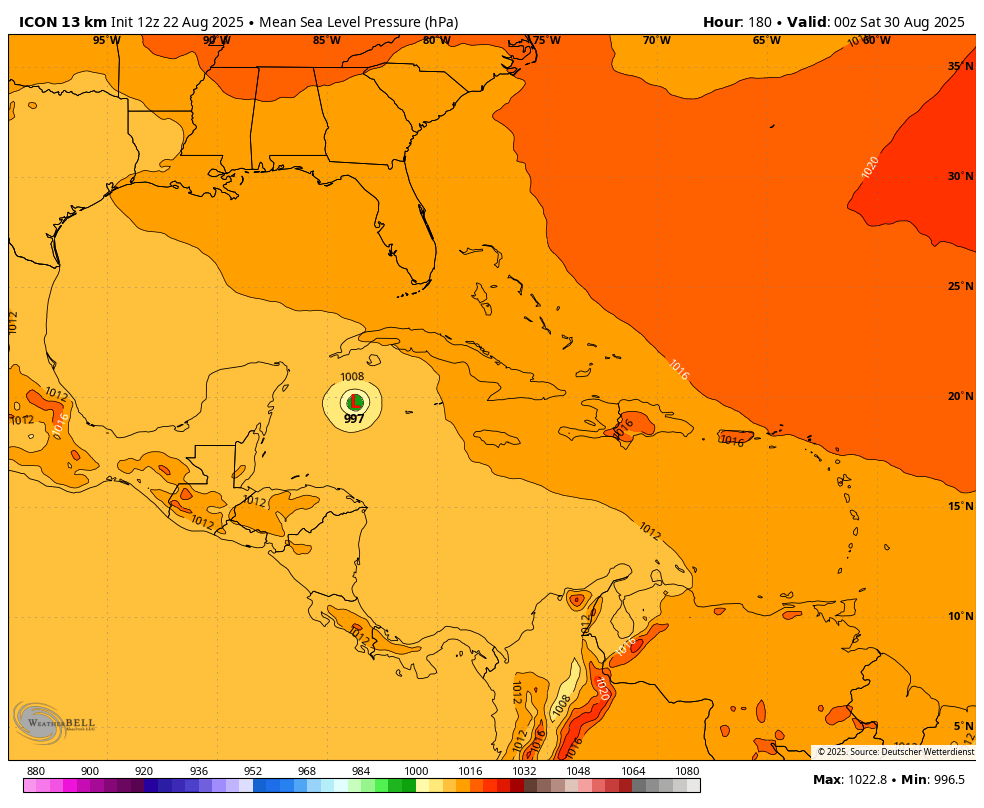
The 12Z Icon has this as a 997 TS at 180 in the W Caribbean moving WNW:
-
From Dr. Viterito (via JB), the person who thinks that warmer oceans (and thus GW) has been caused mainly by undersea volcanic activity: I’m putting this out for discussion purposes, not to take sides with him:
Arctic Ice Comment from Dr V..And now we have yet another research nugget that needs to be explored further. This recent article by Matt Vespa points to the fact that Arctic sea ice has not declined since around 2005.
So, the Climate Change Narrative Just Took a Broadside. Want to Guess What It Was Over?
A deeper dive into the data from Climate Reanalyzer paints a slightly different picture. Specifically, it pinpoints the year when the decline stopped as 2007. Here is their chart:
.png)
Climate Reanalyzer, University of Maine
As a correlate, the Mid-Ocean Spreading Zone Seismic Activity (MOSZSA) matches up VERY well. Here is that chart:.png)
Clearly, the "trough" in Arctic sea ice extent began the same year (2007) MOSZSA plateaued i.e., 2007!!!
Too many things correlate strongly with MOSZSA: global temperatures, global sea surface temperatures, Arctic sea ice, the AMO Index, oceanic heat content, Western Pacific thermocline depths, Kuroshio intensification, and other responsive geophysical phenomena.
More to follow...
-
Erin’s ACE is now crossing 32 and is headed to ~34 for its likely total. That’s pretty impressive and it has brought 2025 ACE up to 12th highest for the date of the last 75 years.
-
1
-
1
-
-
2AM TWO: up slightly from 50/50 to 50/60:
2. Central Tropical Atlantic (AL99):
Showers and thunderstorms associated with a tropical wave located
about a thousand miles west-southwest of the Cabo Verde Islands
remain well organized. This system could become a tropical
depression at any time, but the latest satellite-derived wind data
indicate that the system does not have a well-defined circulation
center. The system is expected to move into a less conducive
environment later today through Saturday, but could reach a slightly
more favorable environment again late this weekend into early next
week as it moves westward at 10 to 15 mph over the central tropical
Atlantic and approaches the Lesser Antilles.
* Formation chance through 48 hours...medium...50 percent.
* Formation chance through 7 days...medium...60 percent
—————
There’s lots of wx bb chatter that suggests this is already a TC. Hmmm.
-
Up from 60/80 to 70/80:

Tropical Weather Outlook
NWS National Hurricane Center Miami FL
200 AM EDT Fri Aug 22 2025

For the North Atlantic...Caribbean Sea and the Gulf of America:

Active Systems:
The National Hurricane Center is issuing advisories on Hurricane
Erin, located over the northwestern Atlantic Ocean.

1. Near the Leeward Islands (AL90):
An area of disorganized showers and thunderstorms associated with a
tropical wave is located a couple hundred miles east-northeast of
the northern Leeward Islands.  Environmental conditions appear
conducive for further development of this system, and a tropical
depression is likely to form this weekend while it moves
northwestward and then northward, in between the Lesser Antilles and
Bermuda.
* Formation chance through 48 hours...high..70 percent.
* Formation chance through 7 days...high...80 percent
-
The rain is still falling lightly this evening. Though a portion of the W part of the county received ~3”+ (centered on the junction of I-16 and I-95) necessitating a flash flood warning, my amount so far hasn’t added to that much…probably ~0.25” so far. That gets me to an amazing ~14.65” MTD with none of that from a TC! But that’s not the end of it!
From KCHS NWS office, a flood watch has been issued for its entire area:
SHORT TERM /FRIDAY THROUGH SUNDAY/
FRIDAY AND SATURDAY: A COLD FRONT IS FORECAST TO STALL OVER THE
AREA FRIDAY MORNING AND LINGER INTO SATURDAY. WAVES OF LOW
PRESSURE SHOULD DEVELOP AND MOVE EAST ALONG THE FRONT AS SPOKES
OF VORTICITY PASS THROUGH ALOFT. THIS COUPLED WITH BUILDING
PWATS OF 2.25-2.50" AND WEAK TO MODERATE LEVELS OF INSTABILITY
WILL SUPPORT NUMEROUS TO WIDESPREAD SHOWERS/TSTMS THROUGH THE
PERIOD.
THE STEERING FLOW WILL WEAKEN WITH TIME WITH MODIFIED
SOUNDINGS SUGGESTING LONG/SKINNY CAPE PROFILES DEVELOPING FRIDAY
AFTERNOON AND LINGERING INTO SATURDAY. THIS WILL SUPPORT
CONVECTION WHERE WARM CLOUD PROCESSES WILL SUPPORT INTENSE
RAINFALL RATES, POSSIBLY >3 IN/HR AT TIMES, GIVEN THE RICH,
TROPICAL MOISTURE PLUME THAT WILL BE IN PLACE. THIS MAY LEAD TO
AREAS OF FLASH FLOODING, ESPECIALLY IN THE CORRIDOR ROUGHLY
SOUTH OF A REIDSVILLE-SPRINGFIELD-WALTERBORO-MONCKS CORNER LINE
WHERE 20CM SOIL MOISTURE VALUES ARE RUNNING IN THE >98TH
PERCENTILE AS OF THE 18 AUGUST ANALYSIS.
GIVEN THE SATURATED SOIL MOISTURE PROFILES IN PLACE AND THE
INTENSE HOURLY RAINFALL RATES THAT ARE POSSIBLE, THE RISK FOR
FLASH FLOODING WILL BE ELEVATED INTO SATURDAY EVENING,
ESPECIALLY IN THE COASTAL CORRIDOR WHERE THE EVENING HIGH TIDES
BOTH FRIDAY AND SATURDAY COULD ENHANCED THE FLOOD THREAT. A
FLOOD WATCH HAS BEEN ISSUED FROM FRIDAY MORNING THROUGH EARLY
SUNDAY EVENING. STORM TOTALS DURING THIS PERIOD WILL RANGE FROM
2-4" WITH ISOLATED AMOUNTS POSSIBLY EXCEEDING 6".-
3
-
-
I’ve been getting the first thunderstorm since Sunday (8/17) since ~6:45PM in a band coming eastward that had collided with the sea-breeze front. Rain rates have been mainly moderate but with some heavy.
Before this rain, I had already been up to a whopping 14.4” MTD!
Light rain is still falling. I’ve gotten ~0.25” today so far. That gives me ~14.65” MTD. It may be ending shortly.
-
2
-
-
2 minutes ago, WxWatcher007 said:
An immensely powerful hurricane
Indeed, incorporating size, this is a MH.
-
3
-
-
Now the hurricane models will run. This could possibly affect Bermuda directly but would there even be much to it?
-
1 hour ago, olafminesaw said:
Looks like a fishy reading but technically Savannah-Hilton head airport dropped to a dewpoint of 62 on Monday, breaking the streak of dewpoint at or above 68 degrees, which ranks third highest all time
.thumb.png.85ea443c61a71a314ee834f9afa9c725.png)
Thanks as I missed those 60s dewpoints at KSAV Mon afternoon. So, I need to retract what I said about no dewpoints below the low 70s since June. Where I live is closer to the coast and thus typically has higher dewpoints, but not that much higher. Thus I just edited my earlier post for this correction.
My point was that the bulk of the cool, dry airmasses of earlier August didn't reach down here. That I’m still saying has been the case.

.png.5f608e41049c1cc65a4d1188e0ea5b58.png)
INVEST 99L - 40/40
in Tropical Headquarters
Posted
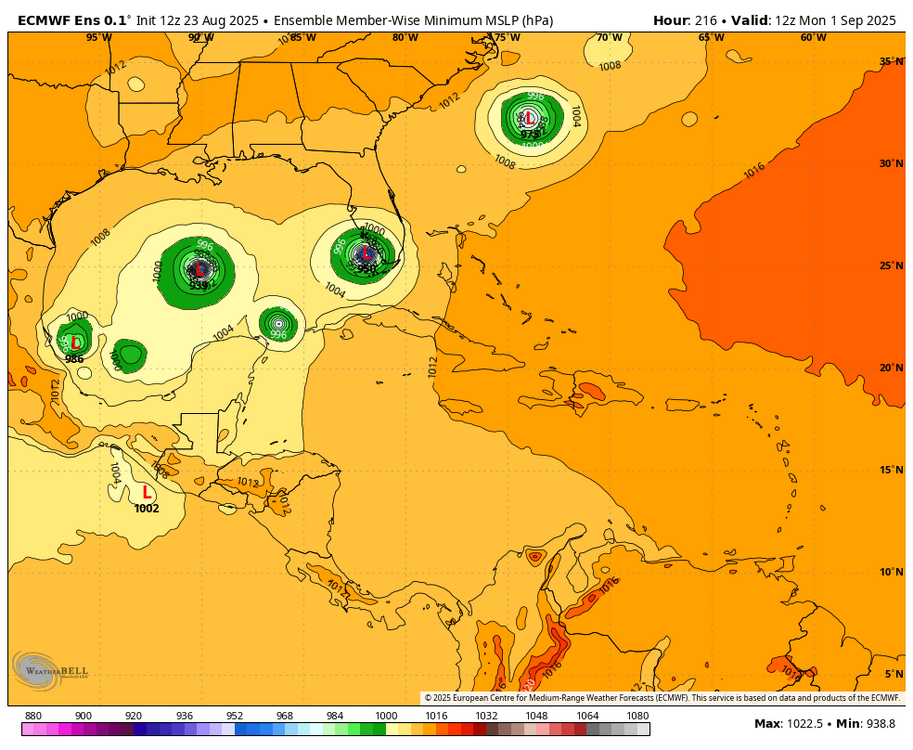
The Euro ensemble, which for Invest 99L had gotten significantly more active 24 hours ago and then on the 0Z significantly less active than yesterday’s 12Z run, was very quiet on today’s 12Z with virtually nothing. Check out the difference between 12Z yesterday and 12Z today:
12Z yesterday at 216: somewhat active
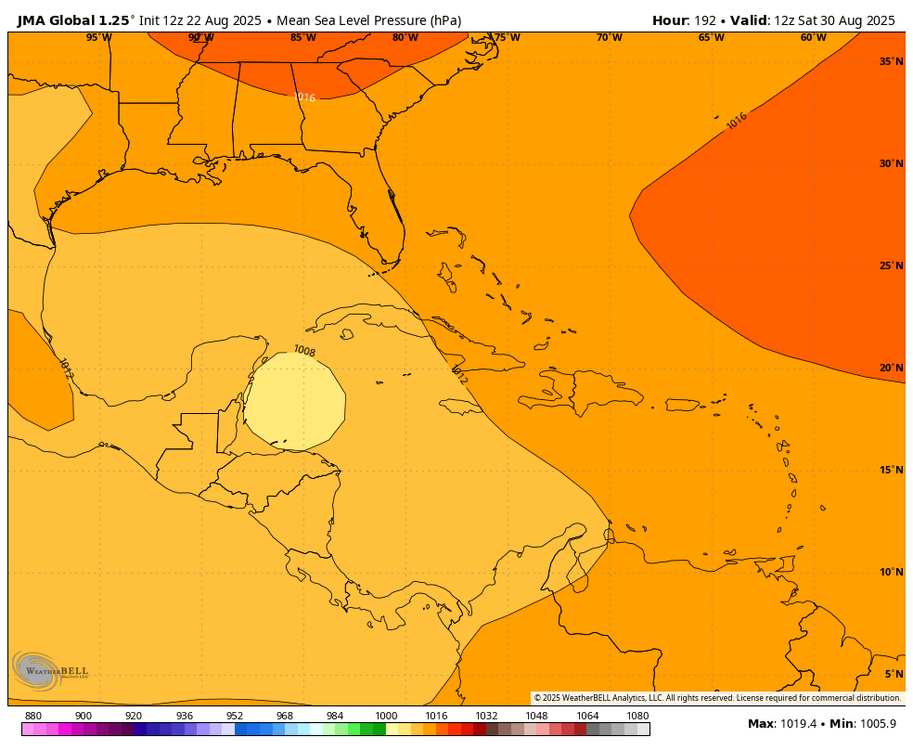
12Z today at 192: nothing!