
madwx
-
Posts
2,111 -
Joined
-
Last visited
Content Type
Profiles
Blogs
Forums
American Weather
Media Demo
Store
Gallery
Posts posted by madwx
-
-
the 0z 3km NAM is a step in the right direction, slowing down the wave and having slightly more realistic boundary layer heating. The WRFs seem to be convecting over Southern Wisconsin/Iowa in the late afternoon. Slightly intrigued by the setup. Think there could be some severe in Wisconsin, especially if the wave stays a bit slower.
-
 1
1
-
-
58 minutes ago, RogueWaves said:
Somehow, COVID's managed to kick Pneumonia to the curb..

I’m pretty sure this is a fake chart. Here is a screenshot from cdc.gov with the total pneumonia and influenza deaths

-
 1
1
-
-
17 minutes ago, snowstormcanuck said:
My theory on that is that the deaths are counted almost immediately, while they're is a lag in tabulating those who have recovered since it can take weeks to be free of the virus. I think once all the ongoing cases have an outcome (either death or recovery), the numbers should align with conventional thinking, with a mortality rate <1%.
And, that doesn't even factor in all the people who have the virus but are asymptomatic, which if factored in would suppress the mortality rate even further.
48 minutes ago, WestMichigan said:If you look worldwide at the number of those who are now clear after having had the virus or died the death rate is 20%. Not sure how reliable that is but that is a very high number.
its also because most people with mild to moderate symptoms are not going to get tested a second time to see if they are negative for the virus so theres no easy way to add them to the recovered statistic
-
1
-
-
Madison had its 13th warmest and 17th wettest March on record. Only 2.8" of snow for the month.
-
1
-
-
Now that the decade of March is over with it's time to look forward to the eon of April. Looks to be starting off on a warming trend for the region with storminess becoming more common from Friday through much of next week.
-
1
-
1
-
 3
3
-
-
looks like some lake effect showers moving into Chicago. Today looks like the dreariest day for awhile. Nice warm up for the end of the week
-
1
-
-
We’re about 15 posts away from an Alex Jones video getting posted in here
-
2
-
-
yeah even the GFS extended has flipped and does not look bad at all
-
1
-
-
7 minutes ago, Indystorm said:
I honestly thought most wx data came from wx balloons which were released but I have seen your concern raised elsewhere.
Most weather data comes from satellites these days
-
2 hours ago, kevlon62 said:
Quote prior day's update
Sent from my SM-N960U using Tapatalk
it went from 1285 with 12 deaths yesterday to
1535 and 16 deaths today
-
Overachieving up to 43 here today. This mornings snowfall is a distant memory. Looks like a roller coaster of temps between about 40-50 this week for highs and then rising to the upper 50s to lower 60s this weekend.
-
3
-
-
2 hours ago, madwx said:
just picked up a quick 1/2" with snow showers this morning. Sun should come out soon and melt most of it. Looks like another clipper moves just south of us overnight tonight bringing snow to northern illinois
And just like that all the snow has melted except the preexisting piles and patches. The old snow has some staying power but thinking all but the largest piles will be gone by this weekend.
-
1
-
-
just picked up a quick 1/2" with snow showers this morning. Sun should come out soon and melt most of it. Looks like another clipper moves just south of us overnight tonight bringing snow to northern illinois
-
1
-
-
As we wrap up February and met winter, I'm going to throw together some preliminary stats for the month and season, I'll update again in a few days but only the temp rankings should change
For Madison this is:
51st warmest February at 23.4 F
56th driest February with 0.94"
22nd snowiest February with 13.3"
For the Winter:
12th warmest Winter at 26.7 F
75th wettest(or 78th driest) winter with 4.20"
36th snowiest winter at 35.0"
-
21 minutes ago, Baum said:
ouch.
she's a beaut, just a few too many altocumulus blocking the view
-
1
-
-
11 minutes ago, Hoosier said:
It is actually kind of impressive that the final total should even end up within shouting distance of average given how mild of a winter it has been and the lack of any big individual snow. No doubt helped out by the early snows as pointed out.
Yeah Madison is 10.9" above average since July 1 but 0.7" below average since December 1st. Only 2.9" between Dec 1 and Jan 10, Basically the first half of met winter had almost no snow.
-
1
-
 1
1
-
-
On 2/20/2020 at 5:07 PM, madwx said:
Will enjoy the cirrostratus canopy
Not a bad canopy today. A few cumulus/stratucumulus at times and the sun is even peeking out.
-
1
-
-
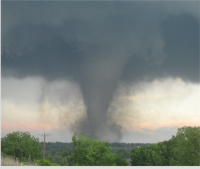
pretty impressive to see tornadoes right up against Lake Michigan that early in the season.
Definitely have positive feelings about this severe season. the jet has been ripping along so far and if continues into spring that will help promote increased shear and less meridional flow which will lead to more turning with height. Have seen 1990 thrown around as an analog and seeing some similarities in the March pattern(1990 also feature a double spike of extremely high AO values in February). Have also seen 1991, 2007 and a few other years thrown around that would portend average to above average tornado risk this spring.
Personally I'll be out chasing the last 10 days of may so hoping for an active stretch then.
-
1
-
 2
2
-
-
March(and spring!) is around the corner. The month looks to start off with a warming trend and then gets active with a few SW flow systems rolling through the area around the middle and end of next week.
-
1
-
-
3 minutes ago, michaelmantis said:
This data looks to be from the 3-4 AM model runs... How could they still be using it?!?!?
I actually think its the forecast snowfall amounts in the grids from each forecast office. Which had their last major update about 3 am. But in this case you should either create your own graphic for this situation or do something else to explain the situation because these are going to be drastically different in an hour or two
-
1
-
-
the NWS twitter account just sent out graphics showing 4" in Madison and 7" in Milwaukee LOL not a good look
-
1
-
-
GFS finally fully capitulated, down to less than an inch here on all models. Was looking back and at the 12z run two days ago the GFS had a 15" jackpot in green bay. Not the best winter for our hometown model.
-
1
-
-
Just now, King James said:
WI posters really got boned with this one
Eh we've been pretty lucky overall this winter with a few overperformers and deep snowcover for about the past month. Also my mind is switching to spring mode so by the end of this month I'm rooting for warmer weather and thunderstorms vs cold and snow.
-
4
-
-
The trend downward here continues on the GFS. Still warning criteria but losing about 2” per run

April 2020 Discussion
in Lakes/Ohio Valley
Posted
at least the models are staying true to their form in this crazy work. usually a middle ground between the two is the way to go, maybe a slight lean toward the HRRR