

jm1220
-
Posts
26,187 -
Joined
-
Last visited
Content Type
Profiles
Blogs
Forums
American Weather
Media Demo
Store
Gallery
Posts posted by jm1220
-
-
Eyewall should be at Punta Gorda/Pt Charlotte now.
-
 1
1
-
-
1 minute ago, olafminesaw said:
,based on current radar trends surge may be worse in Cape Coral than Port Charlotte. Absolute highest surge may go between the two population centers.
The bumps east in the last hour or two have made it much more serious in Cape Coral/Ft Myers. Port Charlotte/Punta Gorda may relatively luck out. Cape Coral looks like it has about double the population as Charlotte Harbor.
Captiva may be getting into the eye now.
-
Just now, SchaumburgStormer said:
Live feed from Cape Coral lock showing the water surging into the canal system.
That city's screwed, not sure how else to put it. Over 200,000 people in that area. Yikes.
-
 1
1
-
-
Just now, Normandy said:
Ian already showing the different between he and Charley. Its one thing dealing with 150 mph winds.....a while other thing dealing with that and tsunami like storm surges. the reverse surge out of Tampa Bay is wild. Historic storm, no other way to describe it.
Yeah, sad to think that all that water going out some place is coming back in at another place. It's really like a mound and like we're seeing, something like a tsunami.
-
1 minute ago, KPITSnow said:
It looks like Sarasota/Bradenton is going to get blasted by the western eye wall
We'll probably see some land confirmations soon for the stronger northern eye wall. Headed for Venice and Sarasota as you said. Thankfully for them the surge won't be too bad. Charlotte Harbor and Cape Coral though....

-
2
-
-
1 minute ago, NavarreDon said:
Reminiscent of Michael, TBX shows the core in the best shape I’ve seen all morning.
.Yep, presentation looks like it should be cover of a textbook. That EWRC yesterday was at the worst possible time clearly. Eye probably has the stadium effect. Captiva may be about to get into the eye.
-
2
-
 1
1
-
-
Just now, Michigander said:
Landfall at Sanibel
I don't think it's considered landfall until much of the eye is ashore. But a noticeable tick east again.
-
1
-
-
1 minute ago, Intensewind002 said:
Why would that happen? Brown ocean effect from it's own rainfall?
Much of FL is swamp land so it won't weaken as fast as if it was headed into a mountainous area, but it won't stay cat 4 or 5 for very long since perfect conditions are needed for that. If it speeds up it might stay as a hurricane across the peninsula though.
Unfortunately for Charlotte Harbor looks like a worst case track/scenario here. Cape Coral near the edge of the eyewall too and will experience hours of steep water rise. Naples is a good bit further away from the eye and seeing steep rises.
-
1
-
-
Sanibel/Captiva look to be in the eyewall now. That same water rise will be in Charlotte Harbor shortly.
-
1
-
-
1 minute ago, geddyweather said:
That Sanibel camera at Lindgren & East Gulf is horrifying. You could see the road when I started watching 10 minutes ago, now all submerged and rising fast.
The surge will come in very rapidly with the eyewall coming onshore. The much higher wind will pile in the water. Soon that same surge is probably coming for Cape Coral as their wind increases/changes direction to more onshore.
-
1
-
-
Definitely a bit of east movement now. Cape Coral may not be out of the woods getting into the eyewall.
-
4 minutes ago, Chuck said:
Will the result of the negative surge be similar to what happened with Katrina and Lake Pontchartrain where after the storm passed the surge came back the other way with a vengeance? If so, what would the guess be as to how bad Tampa could be affected?
The water would only really come back in like a surge if the wind switches direction to piling the water back in. Unfortunately for places like Charlotte Harbor, that’s where that mound of water is going, along with wherever the east eyewall hits. Tampa will still have a lot of problems from the 20” rain that might be falling there.
-
1
-
-
3 minutes ago, mob1 said:
Eye still looks great on radar, and still plenty of lightning too.

Seeing a bit of a move east recently and the eastern eyewall look a little healthier probably helped by friction. This is about to go WAY downhill from Captiva on north.
-
1
-
-
NE eyewall getting really close to Captiva. Conditions probably going way downhill there. We’ll see soon if that “frictional drag in” theory rings true for SW FL and it turns more NE.
-
6 minutes ago, GaWx said:
Ian moved from 24.6 N, 82.9 W at 10 PM to 26.1 N, 82.7 W at 9 AM. So, this was a move of only 0.2 east vs 1.5 north the last 11 hours. This equates to an average direction of movement of only 7 degrees vs the 15 degrees that the NHC has been saying. Compared to the 11 PM NHC forecast, it is now 15 miles due west of that projected track point. That may not seem like much, but that makes a significant difference regarding landfall point due to the angle of the FL west coast relative to the direction of movement.
Yes, almost due N movement with a tick east from time to time. Maybe the frictional effects will drag the center or at least eyewall onshore. But that Venice to Punta Gorda area is in huge trouble. Maybe Sarasota if it keeps the due N movement. I wonder if St Pete will have problems later with the N/NE reverse storm surge?
-
2
-
-
2 minutes ago, MANDA said:
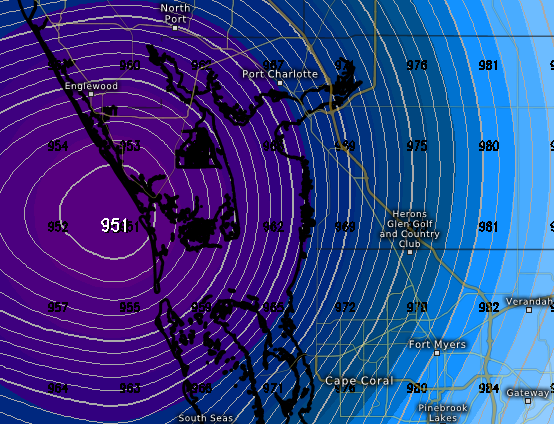
Eye continues to clear. Nothing short of spectacular at the worse possible time. So similar to Charley (only much larger) in the hours prior to landfall. Surge and near and to the right of landfall will be devastating. Per latest from TPC:
Peak Storm Surge Inundation has been increased for the following
locations:

* From Englewood to Bonita Beach...12-18 ft
* Charlotte Harbor...12-18 ft
* From Bonita Beach to Chokoloskee...8-12 ft
* From Chokoloskee to East Cape Sable...5-8 ft
The 12-18' foot forecast areas are no joke and life threatening is not an exaggeration. Bad.

Should be noted too that those surge heights are WITHOUT waves added on top.
-
1
-
-
6 minutes ago, AChilders said:
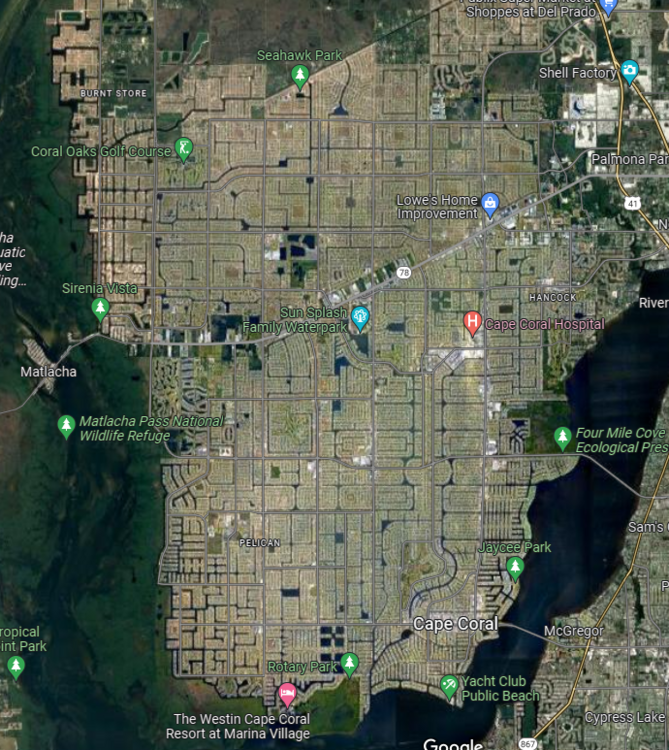
Nothing but canals and houses.
Yep-wow. They’re in trouble. Hopefully for them it ticks left. Guess the hordes moving to FL in the last 15 years have to go somewhere.
-
1
-
-
2 minutes ago, psv88 said:
Mostly new development so hopefully able to withstand these winds.
The slow movement might increase the impact of the winds but the fact so much property is a few feet above sea level is what’s going to be really devastating in these places. Entire towns are literally built around canals in these places, and they’ll be under 15 feet of water.
-
7 minutes ago, Hotair said:
Recon has found a central pressure of 933.1 mb, so Ian continues to flex and is still deepening
folks near Ft Myers better hope the cane stays on the water longer and comes in North of them.
Ft Myers might not be so bad. It’s the area from Sanibel to maybe Sarasota that’s in line to get wrecked along with any bays/harbors that will funnel water in. Thousands and thousands of homes on tiny canals in that stretch only a few feet above sea level along with plenty of built up beachfront property.
-
4
-
-
1 minute ago, MattPetrulli said:
Have to assume an extreme wind warning is coming very soon. Eyewall knocking on the door of the coast next few hours. Also frictional convergence should tighten up the eyewall and close it off again.
Yep, eyewall looks to be only 15 miles off the beach which is where the extremely strong surge and wind would be. Only a few hours away from Captiva on north.
-
Wow, certainly wasn’t expected for it to ramp up like this in intensity. Have to think this will be devastating to inland buildings even with the good building codes with this duration of strong winds, and the surge will be horrendous for a wide stretch probably from Ft Myers north. Charlotte Harbor area will be absolutely wrecked, probably much worse than Charley since that was a tiny core. Sarasota area also in for a huge impact with the north jog. Hopefully there can be a bit of a cycle down at least before it makes landfall so it can come in at 140-145 instead of 155. Just wow.
-
3
-
-
Looks like this EWRC will be completed pretty rapidly. Wonder if it’ll have time to strengthen more/consolidate the new eye before landfall.
-
1
-
-
3 minutes ago, dan11295 said:
I guess the real question at this point is how much further south can it go? At this point we have ~30 hours left for further corrections. But it seems even closer to Naples is now a real possibility.
It would have to hook NE pretty much to miss Naples/Marco Island to the south which is a stretch.
-
10 minutes ago, HKY_WX said:
If you look at the Hires images, the EURO strengthens Ian all the way till landfall at Charlotte Harbor. Devastating run for them. It's a whole different ball game now that the trough has caught Ian and is pulling it NE. This may act to encourage strengthening all the way till landfall with the additional aid to outflow ventilation. As opposed to meandering storm in the cooler waters near the big bend (further north).
Probably hoping for a lucky EWRC at this point. The dry air/cool water saving grace wont happen in time.


Hurricane Ian
in Tropical Headquarters
Posted
And it's 12 feet above ground level (if the camera is 12 feet above ground). The actual surge would probably be 15-16 feet or whatever it is above the normal water level.