RodneyS
-
Posts
1,423 -
Joined
-
Last visited
Content Type
Profiles
Blogs
Forums
American Weather
Media Demo
Store
Gallery
Everything posted by RodneyS
-
Congratulations to Tom on his 2025 win, and many thanks to Roger for all the time he has put into this contest over many years.
-
Dulles received 0.1 inch of snow this morning, and so here is the updated table, which shows a decreased departure for all entrants of 0.1.
-
December 2025 at DCA ended on a cold note, averaging 37.3 degrees, tied for 94th warmest December of 155 years in DC history and 4.4 degrees below the 1991-2020 normal of 41.7. The last time December was colder at DCA was 2010, which averaged 34.6. December 2025 precipitation at DCA was also below normal at 1.77 inches vs a December average of 3.41 during 1991-2020. The 2025 yearly average temperature at DCA was in marked contrast to 2024, averaging only 59.5 degrees, 18th warmest in DC history and down 2.3 from last year's record-breaking warm 61.8 degrees. Precipitation in 2025 at DCA totaled 35.56 inches, only the 119th wettest in DC history and below the 1991-2020 normal of 41.72 inches. The last time there was less precipitation at DCA was 2016, in which DCA received 31.70 inches. This marks the third consecutive year of below normal precipitation at DCA; however, the preceding five years were all above normal there, including the record-breaking 66.28 inches in 2018.
-
Those are interesting numbers, but a tad late for this season's contest.
-
DCA snow total today has been finalized at 0.4, and IAD snow total has been finallzed at 0.7. See updated seasonal totals below.

-
Preliminary snow reports are in this morning for BWI (1.0 inches), DCA (0.3), and IAD (0.5). These amounts are not enough to change the leaderboard, but @rjvanalscontinues to inch closer to leader @LittleVillageWx I will update the table late this afternoon.
-
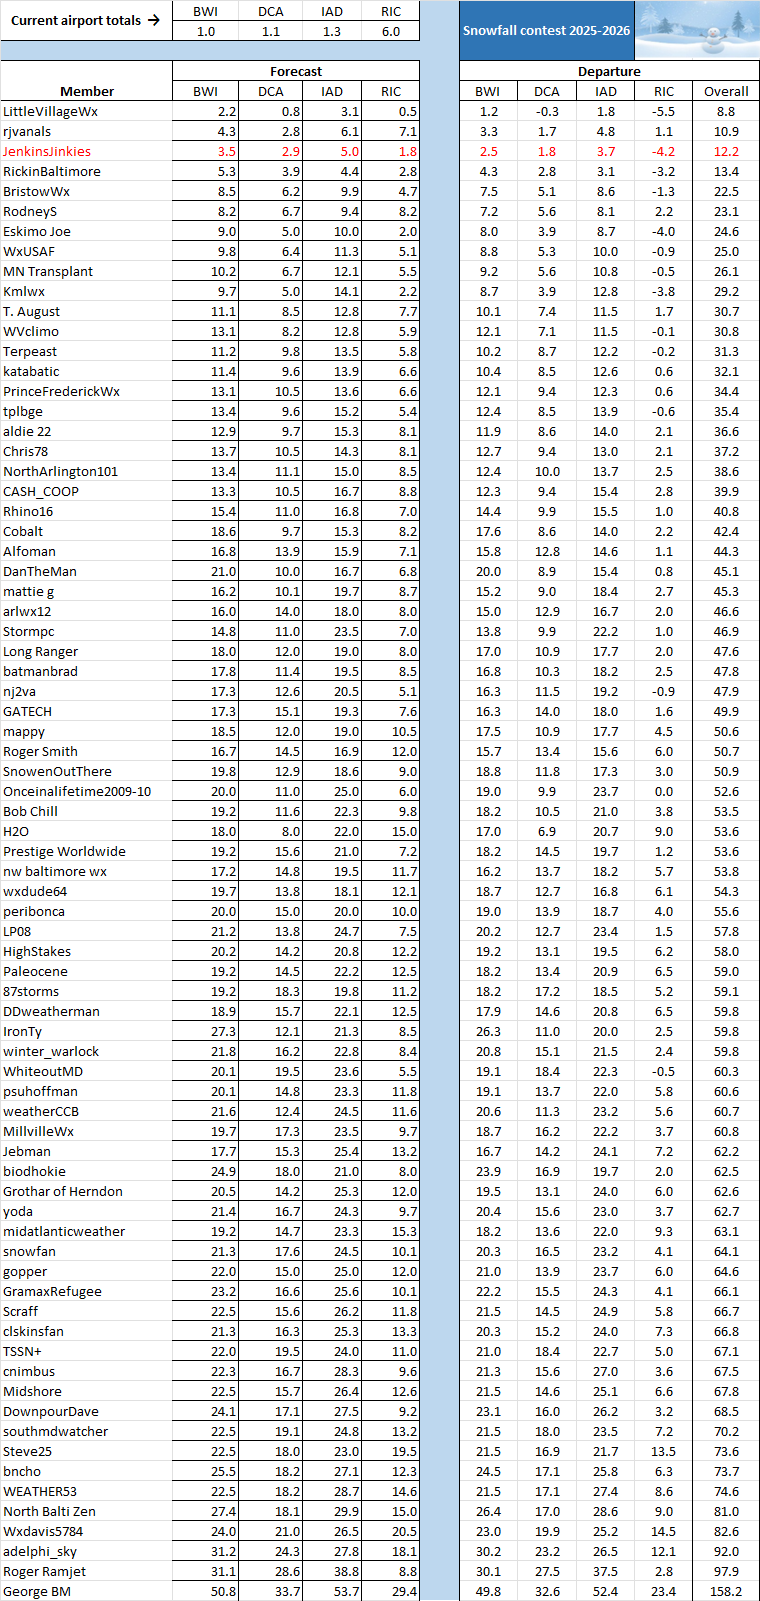
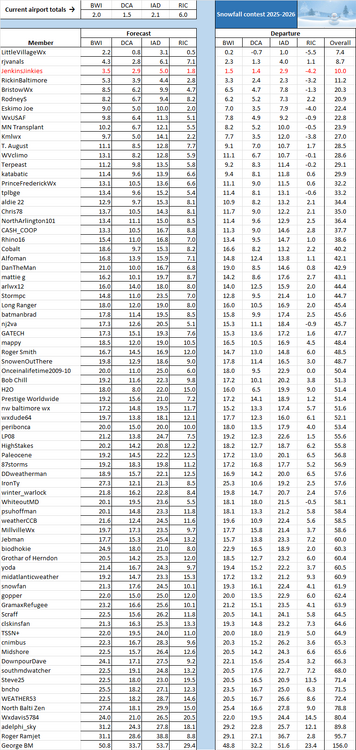
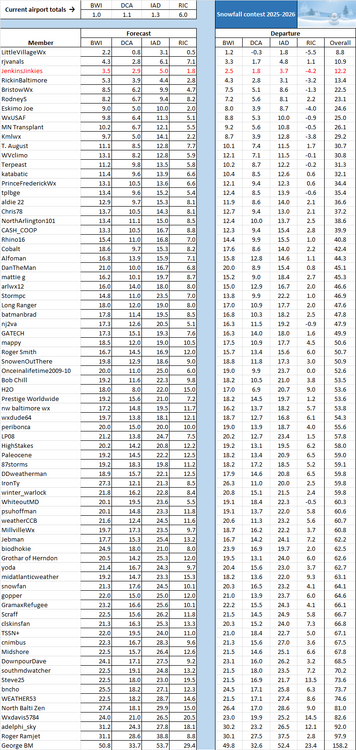
RIC snow has been finalized at 4.0 inches for December 8th, to bring the seasonal total there to 6.0 inches and shaking up our leaderboard. We now have 13 negative departures at RIC, and @JenkinsJinkiescannot now catch @rjvanalsoverall. @LittleVillageWxis still in the lead, but a combined 1.1 inches of additional snow at RIC and DCA will make @rjvanalsthe new leader.
-
Just last snow season, SBY recorded 21.3 inches vs 15.5 at IAD, 14.9 at DCA, 12.7 at BWI, 12.4 at LYH, and 11.7 at RIC.
-
Thanks. I will wait until tomorrow to update.
-
FYI, BWI snow has been upgraded to 1.0 inches and IAD snow has been upgraded to 1.3 inches. See below -- there is no relative change in the standings.

-
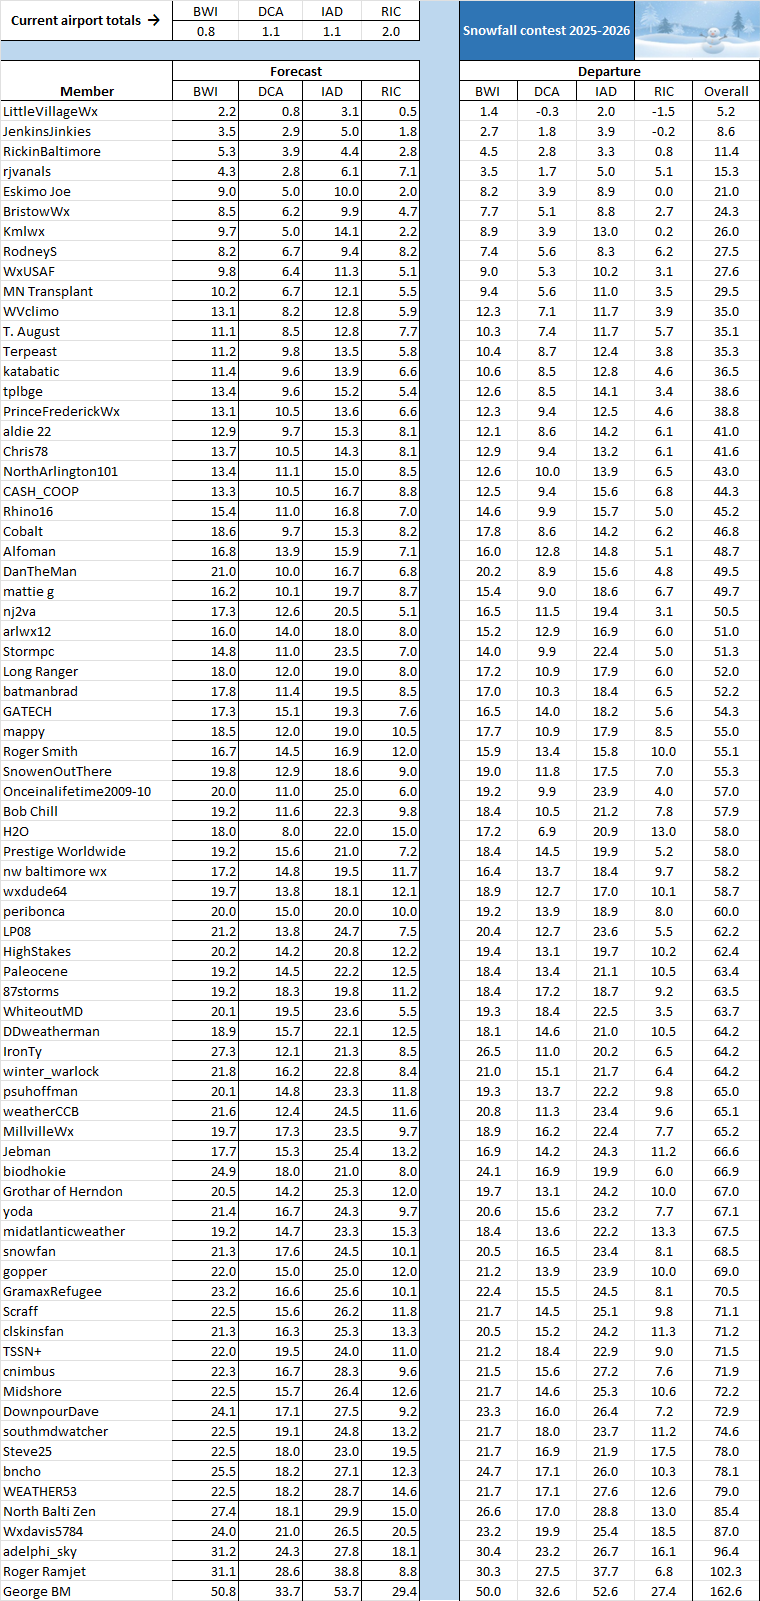
The above numbers have been finalized with no change, and to them is added 0.8 inches at BWI. The below table reflects no changes to the leaderboard, but does show negative departures at both DCA and RIC for current leader @LittleVillageWx and a negative departure at RIC for current runner-up @JenkinsJinkies
-
I just discovered an NWS website for real-time snow reports nationwide: https://www.weather.gov/source/crh/snowmap.html According to that website, DCA and IAD are currently reporting 1.1 inches each, and RIC is reporting 2.0 inches.
-
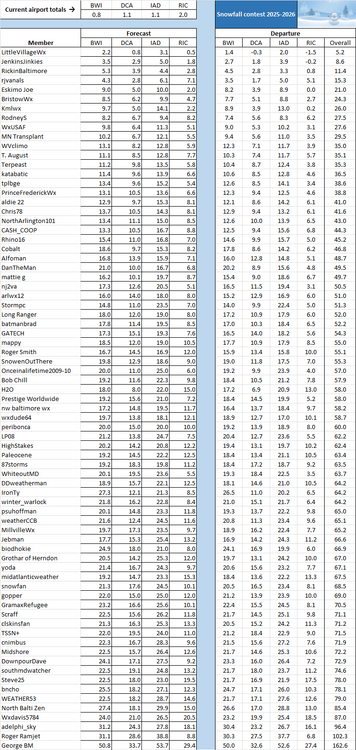
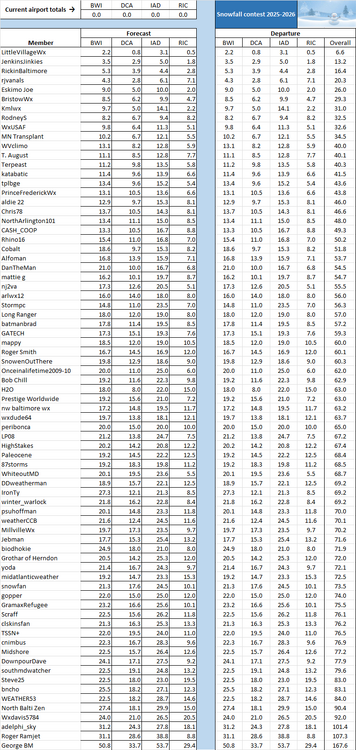
We have 75 entrants for this season's contest. That equals the number from two seasons ago and exceeds the 69 entrants that we had last season. Of those 69, 55 returned this season and 14 dropped out, with 20 additional entrants joining. The average number of inches of snow forecast (with median forecasts in parentheses) for the four contest airports are as follows: BWI: 18.2 (19.2) DCA: 13.4 (13.9) IAD: 20.2 (20.8) RIC: 9.6 (8.8) Total: 61.4 (63.0) The average number of inches of snow forecast (median forecasts) for the two tiebreaker airports are as follows, with eight entrants selecting LYH and 67 entrants selecting SBA: LYH: 9.8 (11.1) SBA:10.1 (9.4) Below is the summary table, with 2022-23 champion @LittleVillageWx at the low end with a 4-airport forecast of 6.6 inches, and perennial snow optimist @George BM at the high end with a 4-airport forecast of 167.6 inches.
-
Final Call for entries and revisions. When the clock strikes midnight (EST) on Monday evening, the entry deadline will be closed. Speaking of which, here is my entry: BWI: 8.2 DCA: 6.7 IAD: 9.4 RIC: 8.2 ----- SBY: 6.7
-
It appears that November 2025 at DCA ended the three consecutive months of below normal temperature streak by finishing at 50.2 degrees, vs the 1991-2020 November normal of 49.9 degrees. (However, there is uncertainty about this because for some reason there is missing temperature data for November 16th and 23rd.) Precipitation at DCA was below normal at 0.92 inches vs 2.90 during 1991-2020. The January-November 2025 temperature averaged 61.6 degrees at DCA, compared with the record warm 63.6 during January-November last year.
-
TEMP _________DCA _ NYC _ BOS __ ORD _ ATL _ IAH __ DEN _ PHX _ SEA -3.6 -3.0 -2.3 -4.7 -2.5 0.9 1.3 0.5 0.5 SNOW _______ DCA _ NYC _ BOS ___ ORD ____DTW ___ BUF __ DEN _ SEA _ BTV 6.7" 18.9" 35.7" 44.4" 49.1" 99.9" 55.6" 9.1" 70.4"
-
It's time for the 12th annual Mid-Atlantic snowfall contest! Those who participated last year will recollect an exciting contest through mid-February, when a blockbuster snowstorm seemed poised to produce a major change to our leaderboard. However, the storm turned south, and largely missed our contest airports. That left two of our entrants tied for first place, with many others close behind. But no one gained ground after that because snow was done for the season in these parts and @HighStakes held on to edge out @mattie g-- courtesy of a tiebreaker. The consensus view this snow season is that we are likely to experience a second consecutive borderline Weak La Nina. Does that mean that snow totals at our airports will parallel last season's moderate totals? I think the consensus there is: "Who knows?" Which should make for a wide-open contest this season. In any case, the focus of our contest is forecasting the total snow that will fall during the 2025-26 snow season at BWI International (BWI), Reagan National (DCA), Dulles International (IAD), and Richmond International (RIC) Airports. In the event a tiebreaker is required (that happened not only last year, but also seven years ago), please choose one of the following two airports: Salisbury, MD (SBY) or Lynchburg, VA (LYH). Choose only one. Please note that you are forecasting at each of five airports total snowfall for the entire snow season (NOT just Dec/Jan/Feb) to the nearest one-tenth of an inch. Generally, snow does not fall after early April at any of these airports, and so the contest is usually finalized by early to mid-April. The winner will be the entrant who has the lowest combined absolute value departure for all four major airports. For example, if you forecast zeroes at each airport except for Richmond: BWI: 0.0" DCA: 0.0" IAD: 0.0" RIC: 10.0" And the actual seasonal totals turn out to be: BWI: 2.5" DCA: 2.5" IAD: 2.5" RIC: 2.5" Your absolute value departures would be: BWI: 2.5 DCA: 2.5 IAD: 2.5 RIC: 7.5 Thus, your total departure would be 15.0. Please use the following format when posting your forecast, in this order: BWI: DCA: IAD: RIC: Tiebreaker (SBY or LYH): The deadline for entries is Monday, December 1, at 11:59 PM EST. You are welcome to update your forecast at any time up to the deadline. However, please do not edit your original post -- either submit a new post or send me a private message. If there's any accumulating snow before the deadline, be sure to include that in your forecast total. I think the best approach is to submit your forecast in advance of the deadline and update if necessary, just in case you get tied up on December 1st, when the contest will lock -- no late entries will be accepted. The winner gets an E-trophy made of snow and an induction into the Hall of Fame with the previous winners: 2014-15: @nw baltimore wx@S@S@Shadowzone 2015-16: @Shadowzone@Stormpchadowzone 2016-17: @StormpcStormpchadowzone 2017-18: @olafminesaw@Storm @olafminesaw 2018-19: @olafminesaw (tiebreaker win against @Stormpc) @Stormpc 2019-20: @Prestige Worldwide 2020-21: @NorthArlington101 2021-22: @IUsedToHateCold 2022-23: @LittleVillageWx 2023-24: @Kmlwx 2024-25: @HighStakes(tiebreaker win against @mattie g)@Storm Everyone is encouraged to play, including lurkers, new members, and people outside the region. Good luck everyone!
-
DCA _NYC _BOS __ORD _ ATL _IAH __ DEN _PHX _SEA -0.4 0.1 0.3 1.5 -0.5 1.9 3.3 1.0 1.5
-
October 2025 at DCA made it three consecutive months of below normal temperatures at 60.3 degrees, vs the 1991-2020 October normal of 60.8 degrees. Precipitation at DCA was also below normal at 1.89 inches vs 3.66 during 1991-2020. The January-October 2025 temperature averaged 62.7 degrees at DCA, compared with 64.5 last year and the record warm 64.7 during January-October 2012.
-
DCA _NYC _BOS _ ORD _ATL _IAH __ DEN _PHX _SEA 0.1 1.7 1.6 3.8 0.6 3.0 1.6 0.6 0.9
-
The September 2025 temperature at DCA was a tad below normal at 72.2 degrees, vs 72.4 during 1991-2020. Similarly, precipitation there was 3.72 inches vs 3.93 during 1991-2020. The January-September 2025 temperature averaged 63.0 degrees at DCA, compared with 64.7 last year and the record warm 65.1 during January-September 2012.
-
The 2025 astronomical summer (June 21-September 23) at DCA averaged 77.7 degrees (35th warmest in DC history), down 2.0 degrees from 2024, and the coolest since the above-mentioned one eight years ago beat it by 0.1 degrees. Also, the 2025 composite summer (June 1-September 23) at DCA averaged 77.0 degrees (38th warmest in DC history), down 2.3 degrees from 2024, and the coolest since 2009, which averaged 75.6 degrees.
-
DCA _ NYC _ BOS ___ ORD _ ATL _ IAH ___ DEN _ PHX _ SEA -2.3 -0.9 -0.8 -2.2 -2.3 0.9 0.3 0.5 1.8
-
Thanks, although I still did not foresee how cool DCA would actually be.
-
August 2025 at DCA proved to be memorable, coming in as the coolest August in 25 years and the driest in DC history. The average temperature was only 75.8 degrees, tied for the 91st warmest in DC history. That is 3.6 below the 1991-2020 DCA August normal of 79.4 and 0.8 below the 1871-2025 DC August average of 76.6. The cool August reduced the average daily temperature June 1-August 31 to 78.4 degrees, the 33rd warmest meteorological summer in DC history. January-August 2025 averaged 61.8 degrees, compared with 63.7 last year and the record warm 64.2 during January-August 2012. On the precipitation front, August 2025 at DCA produced only 0.20 inches, well below the previous record low of 0.55 set in 1962. That brought the June-August total to 9.22 inches, well below the 1991-2020 normal of 11.77, and only the 119th wettest meteorological summer in DC history. January-August 2025 at DCA produced 27.26 inches, the 87th wettest in DC history and slightly below the 1991-2020 normal of 28.67 inches. Here are the Top Ten driest months in DC history: 1) October 1963 trace 2) October 2000 0.02 inches 3) April 1985 0.03 inches 4) March 2006 0.05 inches 5) September 2005 0.11 inches 6) September 1884 0.14 inches 7) December 1889 0.19 inches 8) (tie) September 1967 and August 2025 0.20 inches 10) December 1955 0.22 inches