

bluewave
-
Posts
31,588 -
Joined
-
Last visited
Content Type
Profiles
Blogs
Forums
American Weather
Media Demo
Store
Gallery
Posts posted by bluewave
-
-
Very well defined backdoor pattern this month in the Northeast.

-
 1
1
-
 1
1
-
-
On 5/8/2024 at 12:54 PM, Terpeast said:
Although I didn’t think they were related before (couldn’t find a convincing enough link), I’m starting to believe that the AMO cycle leads to more SE ridge link ups with HL blocking. Do we know that if this happened in previous +AMO cycles let’s say, prior to 1980 or so?
It could be a combination of the record warm Atlantic SSTs along with the record warmth over the Western Pacific causing these further south Greenland blocks during the 2020s to link up with the Southeast ridge. In the 1950-1970 era of strong -PNA patterns, this wasn’t the case when there was a strong Greenland block. There was usually an upper low over the East at the same time there was a deeper -PNA trough out West.


-
3
-
-
Plenty of low pressure around on the ensembles over the next 10 days. So a continuation of rain chances every several days. The warmest days that are drier look like 70s to perhaps around 80°for the usual warm spots. But no 90° heat showing up yet like we got through the first 10 days of May. It’s same the back and forth pattern that began around March 20th.


-
3
-
-
1 hour ago, snowman19 said:
We are very clearly in a long term negative PDO cycle, when this one ends is anyone’s guess. Any volcano updates?
We have actually seen a shift in the way the -PDO has been manifesting in recent years. It’s now defined by the 2nd EOF which is being driven by the extreme marine heatwave east of Japan. So this is the first El Niño around +2.0 or higher with a -2.09 PDO in April.
https://www.ncei.noaa.gov/pub/data/cmb/ersst/v5/index/ersst.v5.pdo.dat
https://www.nature.com/articles/s43247-023-00839-w
In this study, we evaluate the ocean warming pattern derived from four decades of satellite measurements. We find widespread strong subtropical ocean warming, concentrating mostly on the western ocean basins. In contrast to these observations, studies of paleoclimate suggest that the greatest ocean warming occurs at higher latitudes. By pairing the observed warming pattern with SST evolution in long-term climate simulations, we propose that the observed warming pattern is constrained by ocean dynamics of surface convergence (downwelling, subtropical gyres) and divergence (upwelling, subpolar gyres) rather than being dominated by internal variabilities, such as thehttps://agupubs.onlinelibrary.wiley.com/doi/full/10.1029/2022GL101078
The fundamental result of this study is that the first EOF of SST in the North Pacific has changed starting in 2014. For more than 20 years, the PDO has been used to describe the state of the North Pacific. However, since the marine heatwave of 2014, there have been remarkable changes to the dominant mode of SST in the North Pacific. The spatial pattern of the first EOF of SST from 1950 to 2021 is notably different from the PDO, suggesting that though the PDO served as a useful metric of SST variations until 2014 (Johnstone & Mantua, 2014), it may no longer be as effective a climate index for the North Pacific. From 1950 until the 2014 MHW, the first EOF remained consistent in its proportion of positive and negative regions with both taking up roughly half the area of the North Pacific (and with the positive region taken to be the eastern Pacific). When EOFs are calculated from 1950 to endpoints after 2014, the first EOF has a maximum positive region covering 77% of the North Pacific, with a PC indicating the largest anomalies on record. These changes to the first EOF/PC of North Pacific SST are nothing short of remarkable.
In concert with these changes, the second EOF/PC of SST has also undergone profound evolution since 2014. This second EOF now accounts for approximately 18% of the variability, growing from 13% during the 1950–2013 period. The spatial structure of the second EOF now is positive over almost the entire basin, with a PC that has grown strongly positive in the last several years. Thus, the second EOF/PC describes warming over much of the Pacific not in the positive lobe of the first
-
1
-
-
Too bad we couldn’t get southward corrections like this during the winter.
")
New run

Old run
-
1
-
1
-
-
PHL has had a similar amount of 90° days since 2010 as more rural to suburban COOP sites in NJ.
Monthly Number of Days Max Temperature >= 90 for PHILADELPHIA INTL AP, PA
Click column heading to sort ascending, click again to sort descending.YearAprMayJunJulAugSepOctSeasonMean 0 2 6 15 9 3 0 35 2023 0 0 1 13 3 7 0 24 2022 0 3 5 19 19 2 0 48 2021 0 3 9 10 15 0 0 37 2020 0 0 5 21 10 0 0 36 2019 0 1 4 18 8 3 1 35 2018 0 1 4 11 10 4 0 30 2017 0 3 6 11 4 2 0 26 2016 0 3 5 16 17 5 0 46 2015 0 1 7 10 12 7 0 37 2014 0 0 3 11 3 2 0 19 2013 0 3 4 12 0 1 0 20 2012 0 2 7 21 8 1 0 39 2011 0 3 5 21 4 0 0 33 2010 0 2 15 19 12 7 0 55
Monthly Number of Days Max Temperature >= 90 for HIGHTSTOWN 2 W, NJ
Click column heading to sort ascending, click again to sort descending.YearAprMayJunJulAugSepOctSeasonMean 0 2 6 15 9 3 0 35 2023 0 0 2 18 5 6 0 31 2022 0 3 3 22 19 2 0 49 2021 0 3 10 14 13 1 0 41 2020 0 0 5 23 13 1 0 42 2019 0 0 4 16 10 4 1 35 2018 0 3 4 12 13 4 0 36 2017 0 3 6 11 4 2 0 26 2016 0 4 4 17 16 5 0 46 2015 0 3 7 9 10 7 0 36 2014 0 0 7 12 2 6 0 27 2013 0 1 7 11 0 2 0 21 2012 1 2 6 16 5 1 0 31 2011 0 2 4 16 5 0 0 27 2010 1 3 10 17 11 6 0 48
Monthly Number of Days Max Temperature >= 90 for FREEHOLD-MARLBORO, NJ
Click column heading to sort ascending, click again to sort descending.YearAprMayJunJulAugSepOctSeasonMean 0 2 6 15 8 3 0 34 2023 0 0 1 13 0 4 0 18 2022 0 2 4 22 11 3 0 42 2021 0 3 14 13 12 1 0 43 2020 0 0 6 18 14 2 0 40 2019 0 0 4 16 8 4 1 33 2018 0 5 7 15 17 4 0 48 2017 0 3 5 10 4 2 0 24 2016 0 4 2 16 14 6 0 42 2015 0 0 4 10 13 7 0 34 2014 0 0 4 10 0 5 0 19 2013 0 1 7 12 0 2 0 22 2012 1 1 5 17 5 1 0 30 2011 0 0 3 16 5 0 0 24 2010 1 3 12 19 12 5 0 52 -
2
-
-
Article Highlights
-
Satellite observations reveal that global mean net flux (NET) at the top-of-atmosphere (or equivalently, Earth’s energy imbalance) has doubled during the first twenty years of this century. The increase is associated with a marked increase in absorbed solar radiation (ASR) that is partially offset by an increase in outgoing longwave radiation (OLR)
-
While ASR and OLR changes within sub-periods corresponding to the hiatus (03/2000–05/2010), transition-to-El Niño (06/2010–05/2016), and post-El Niño (06/2016–12/2022) vary substantially, NET flux changes are remarkably stable (within 0.1 Wm−2 per decade), implying a steady acceleration of climate warming
-
The increase in ASR is associated with decreases in stratocumulus and middle cloud fraction and reflection in the Northern Hemisphere, and decreases in middle cloud reflection in the Southern Hemisphere. The cloud changes are especially large in areas with marked increases in sea-surface temperature, such as over the eastern and northern Pacific Ocean
-
Continued monitoring of Earth’s radiation budget and new and updated climate model simulations are critically needed to understand how and why Earth’s climate is changing at such an accelerated pace
-
2
-
-
34 minutes ago, LibertyBell said:
the 1990s were much hotter and drier dude, compare this spring to spring 1991 in New York City that was one of the hottest summers too, along with 1993 and 2010.
Check out maximum length of heatwaves 1990s vs now. Specifically between 1991-2002.
For 90° days they were much warmer than even 2010. There was a very +AO +NAO pattern during springs like 1986, 1991, and 2002. So if we ever got a pattern like that in our much warmer 2020s climate Newark would have its first spring with 10+ 90° days. The only thing that has been preventing this has been all the blocking during recent springs.
Time Series Summary for NEWARK LIBERTY INTL AP, NJ - Mar through May
Click column heading to sort ascending, click again to sort descending.RankYearNumber of Days Max Temperature >= 90Missing Count1 1991 8 0 2 1986 6 0 3 2002 5 0 - 1959 5 0 4 2022 4 0 - 2021 4 0 - 2018 4 0 - 2000 4 0 - 1987 4 0 - 1977 4 0 - 1965 4 0 - 1939 4 0 - 1936 4 0 5 2023 3 0 - 2017 3 0 - 2016 3 0 - 2010 3 0 - 2009 3 0 - 2001 3 0 - 1999 3 0 - 1996 3 0 - 1993 3 0 - 1992 3 0 - 1985 3 0 - 1974 3 0 - 1964 3 0 - 1962 3 0 - 1934 3 0 - 1931 3 0 
-
 1
1
-
-
2 hours ago, TheClimateChanger said:
I'm just not seeing any evidence of this so-called blocking in the actual data, which shows this to be among the hottest springs ever recorded in the northeast and much hotter than anytime in the 1990s? Like wouldn't blocking make it cold in the spring?
New York, NY
Newark, NJ
Hartford, CT
Philadelphia, PA
Burlington, VT
Harrisburg, PA
Pittsburgh, PA
Buffalo, NY
Washington - Dulles, VA
Blocking is always warm when it links up with the Southeast ridge and becomes more south based. But it results in frequent backdoor cold fronts in the spring. So we get a back and forth between warm ups and cool downs with the warm departures ultimately winning out.
We had very strong blocking in the spring during 2010 also. But it build down SW to the Great Lakes which made it the warmest spring blocking pattern on record. The ridge axis wound up to our west so we had less onshore flow than this spring.Since with more more S to SW flow. This spring the ridge axis is more into Eastern New England allowing more frequent onshore flow and backdoor cold frontal passages.


-
2
-
-
48 minutes ago, Allsnow said:
Can’t believe Friday might not get out of the upper 40’s in spots. Awful
Newark is still +3.6 on the month for max temperature departures. But it’s very rare in May to get repeating +15 to +21 days so close to -15 days. So plenty of back and forth.
Data for NEWARK LIBERTY INTL AP, NJ
Click column heading to sort ascending, click again to sort descending.DateMax TemperatureMax Temperature Departure2024-05-01 79 10.6 2024-05-02 90 21.3 2024-05-03 66 -3.0 2024-05-04 62 -7.3 2024-05-05 54 -15.6 2024-05-06 76 6.1 2024-05-07 83 12.8 -
1
-
-
13 minutes ago, Allsnow said:
Decent storm….
now let’s hits 90 today
Yeah, these morning warm fronts usually overperform this time of year.
-
2
-
-
14 minutes ago, Brian5671 said:
Big reversal of the drought over the northern gulf states
It’s easy to lose track of all the 20”+ flood events they have been getting in recent years.
-
1
-
-
22 hours ago, bkviking said:
Any prospect of this -NAO breaking down? Obviously we are not experiencing a Spring 2010 with similar ENSO transition.
The general pattern of 2-3 days making it to 80s in the warm spots before clouds,showers, and onshore flow along with cooler temperatures looks to continue. Ensembles keep a trough near by. So chances for showers and thunderstorms every few days with generally above normal rainfall.


-
4
-
1
-
-
Could be some locally heavy downpours with the elevated convection tomorrow morning due to the very high PWATS for this time of year.

-
2
-
-
10 minutes ago, TheClimateChanger said:
Interesting. I have been very skeptical of claims that HTHH caused climate warming. Never heard of a volcanic eruption producing a significant warming effect prior to 2022.
The cooling effect was very small so not much of a factor in regard to the big global temperatures.
One point to emphasize: the net effect is cooling, but it’s a small effect. Without it, globe would not be much warmer.
-
A recent study found that the volcanic eruption had a cooling effect.
-
-
-
While El Niño to La Niña transition summers usually have a high number of 90° days, all the added moisture may push back against that influence. Many transition summers have featured at least 40 days reaching 90° at Newark. So anything under that would probably need plenty of rain and clouds. It could also make exceeding a high end summer like 2010 with 50 days reaching 90° difficult to achieve. 33 days has been the average for Newark since 2010. The 51-80 average used to be 23 days.
El Niño to La Niña transition summers bolded
Time Series Summary for NEWARK LIBERTY INTL AP, NJ - Jan through Dec
Click column heading to sort ascending, click again to sort descending.RankYearNumber of Days Max Temperature >= 90Missing Count1 2010 54 0 2 2022 49 0 - 1993 49 0 3 1988 43 0 4 2021 41 0 - 2002 41 0 - 1991 41 0 5 2016 40 0 - 1983 40 0 - 1959 40 0 6 1994 39 0 - 1944 39 0 7 2005 37 0 - 1987 37 0 8 2018 36 0 - 1949 36 0 9 2015 35 0 10 1961 34 0 11 2012 33 0 - 1999 33 0 - 1995 33 0 - 1966 33 0 Monthly Number of Days Max Temperature >= 90 for NEWARK LIBERTY INTL AP, NJ
Click column heading to sort ascending, click again to sort descending.YearAprMayJunJulAugSepOctSeasonMean 0 2 5 15 8 3 0 33 2023 2 1 1 14 5 6 0 29 2022 0 4 6 20 18 1 0 49 2021 0 4 12 11 13 1 0 41 2020 0 0 5 17 9 0 0 31 2019 0 1 4 14 4 3 1 27 2018 0 4 5 9 14 4 0 36 2017 0 3 5 9 2 3 0 22 2016 0 3 3 16 13 5 0 40 2015 0 2 4 11 13 5 0 35 2014 0 0 2 8 2 3 0 15 2013 0 2 4 15 3 1 0 25 2012 0 2 6 16 7 2 0 33 2011 0 1 4 22 4 0 0 31 2010 1 2 13 21 11 6 0 54 Monthly Number of Days Max Temperature >= 90 for NEWARK LIBERTY INTL AP, NJ
Click column heading to sort ascending, click again to sort descending.YearAprMayJunJulAugSepOctSeasonMean 0 1 5 9 6 2 0 23 1951 0 1 3 9 5 0 0 18 1952 0 0 8 17 2 4 0 31 1953 0 1 9 10 9 3 0 32 1954 0 0 5 10 3 0 0 18 1955 0 1 5 17 9 0 0 32 1956 0 2 6 1 5 0 0 14 1957 0 2 6 12 4 4 0 28 1958 0 0 2 11 6 2 0 21 1959 0 5 5 8 15 6 1 40 1960 1 0 3 2 8 1 0 15 1961 0 0 4 13 8 9 0 34 1962 1 2 6 3 2 0 0 14 1963 0 0 6 11 3 0 0 20 1964 0 3 6 9 5 3 0 26 1965 0 4 9 7 5 1 0 26 1966 0 0 10 14 8 1 0 33 1967 0 0 5 1 1 0 0 7 1968 0 0 4 9 9 1 0 23 1969 0 1 3 4 6 1 0 15 1970 0 2 2 5 8 5 0 22 1971 0 0 6 7 7 2 0 22 1972 0 0 0 16 4 1 0 21 1973 0 0 5 9 12 5 0 31 1974 1 2 2 10 3 0 0 18 1975 0 1 3 3 5 0 0 12 1976 2 0 7 2 4 0 0 15 1977 1 3 1 14 6 1 0 26 1978 0 1 3 8 4 0 0 16 1979 0 2 1 8 9 0 0 20 1980 0 1 3 8 12 3 0 27 -
1
-
-
This gives new meaning to a backloaded El Niño winter.
-
2
-
1
-
-
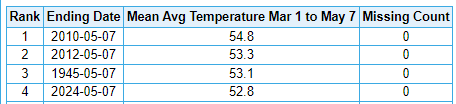
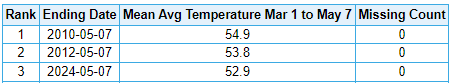
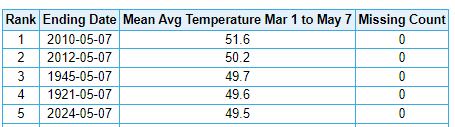
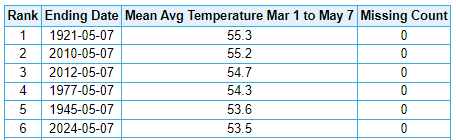
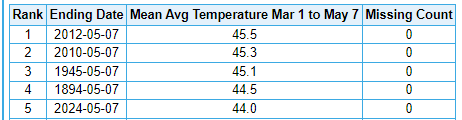
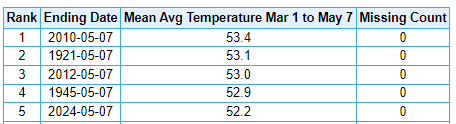
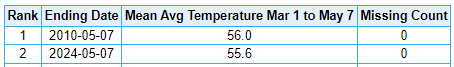
First time since 1965 and 1943 that Newark had a 90° or warmer high and a max under 55° during the first week of May. So plenty of contrast between the warm ups and back doors. Most other years had 80° days either side of the 90° day. Our last El Niño to La Niña transition in 2010 had 6 consecutive days over 80° to start the month.
Data for NEWARK LIBERTY INTL AP, NJ
Click column heading to sort ascending, click again to sort descending.DateMax Temperature2024-05-01 79 2024-05-02 90 2024-05-03 66 2024-05-04 62 2024-05-05 54 2024-05-06 M 2024-05-07 M
Data for NEWARK LIBERTY INTL AP, NJ
Click column heading to sort ascending, click again to sort descending.DateMax Temperature2018-05-01 83 2018-05-02 90 2018-05-03 94 2018-05-04 88 2018-05-05 76 2018-05-06 67 2018-05-07 75
Data for NEWARK LIBERTY INTL AP, NJ
Click column heading to sort ascending, click again to sort descending.DateMax Temperature2010-05-01 88 2010-05-02 90 2010-05-03 84 2010-05-04 83 2010-05-05 81 2010-05-06 80 2010-05-07 74 Data for NEWARK LIBERTY INTL AP, NJ
Click column heading to sort ascending, click again to sort descending.DateMax Temperature2001-05-01 87 2001-05-02 92 2001-05-03 91 2001-05-04 94 2001-05-05 78 2001-05-06 64 2001-05-07 59
Data for NEWARK LIBERTY INTL AP, NJ
Click column heading to sort ascending, click again to sort descending.DateMax Temperature2000-05-01 69 2000-05-02 68 2000-05-03 64 2000-05-04 71 2000-05-05 87 2000-05-06 90 2000-05-07 94
Data for NEWARK LIBERTY INTL AP, NJ
Click column heading to sort ascending, click again to sort descending.DateMax Temperature1986-05-01 82 1986-05-02 60 1986-05-03 57 1986-05-04 65 1986-05-05 85 1986-05-06 91 1986-05-07 77
Data for NEWARK LIBERTY INTL AP, NJ
Click column heading to sort ascending, click again to sort descending.DateMax Temperature1965-05-01 73 1965-05-02 74 1965-05-03 68 1965-05-04 91 1965-05-05 63 1965-05-06 78 1965-05-07 53
Data for NEWARK LIBERTY INTL AP, NJ
Click column heading to sort ascending, click again to sort descending.DateMax Temperature1955-05-01 66 1955-05-02 66 1955-05-03 69 1955-05-04 83 1955-05-05 91 1955-05-06 72 1955-05-07 71
Data for NEWARK LIBERTY INTL AP, NJ
Click column heading to sort ascending, click again to sort descending.DateMax Temperature1949-05-01 68 1949-05-02 71 1949-05-03 79 1949-05-04 83 1949-05-05 94 1949-05-06 93 1949-05-07 82
Data for NEWARK LIBERTY INTL AP, NJ
Click column heading to sort ascending, click again to sort descending.DateMax Temperature1943-05-01 51 1943-05-02 64 1943-05-03 73 1943-05-04 59 1943-05-05 73 1943-05-06 71 1943-05-07 90
Data for NEWARK LIBERTY INTL AP, NJ
Click column heading to sort ascending, click again to sort descending.DateMax Temperature1939-05-01 62 1939-05-02 62 1939-05-03 57 1939-05-04 71 1939-05-05 79 1939-05-06 88 1939-05-07 91
Data for NEWARK LIBERTY INTL AP, NJ
Click column heading to sort ascending, click again to sort descending.DateMax Temperature1934-05-01 67 1934-05-02 69 1934-05-03 62 1934-05-04 70 1934-05-05 89 1934-05-06 90 1934-05-07 83 -
3 hours ago, GaWx said:
After a significantly warmer ENSO run in April, this new Euro run also cooled ENSO back down considerably in addition to significantly warming the MDR (new run on left)(all fwiw of course):
Yeah, all the pieces are there for an extremely active season if everything comes together.
-
28 minutes ago, jm1220 said:
Looks also like more over the top heat dome in Canada. That big high up there last summer dried it up and allowed the huge fire season that brought the smoke down here on the N flow. Maybe it’ll help keep the hurricanes away if the flow is more east to west vs N up the coast. But that puts FL and the Gulf Coast in trouble. As we know SE FL is way overdue and would make the FL insurance industry go belly up if we have a Cat 4 or 5 into anywhere from PBI to Miami.
The temperature forecast varies a bit from past El Niño to La Niña transitions. Typically the strongest warmth is centered from the Great Lakes into the East. This time the Rockies has the warmest summer departures relative to the means. It looks like we get more onshore flow like recent summers with high dew points rather than dry westerly flow which was typical during past El Niño to La Nina transition summers. Plus tropical systems getting steered into the Southeast and Gulf. So there would be numerous opportunities for the tropical moisture to funnel north.


-
1
-
3
-
-
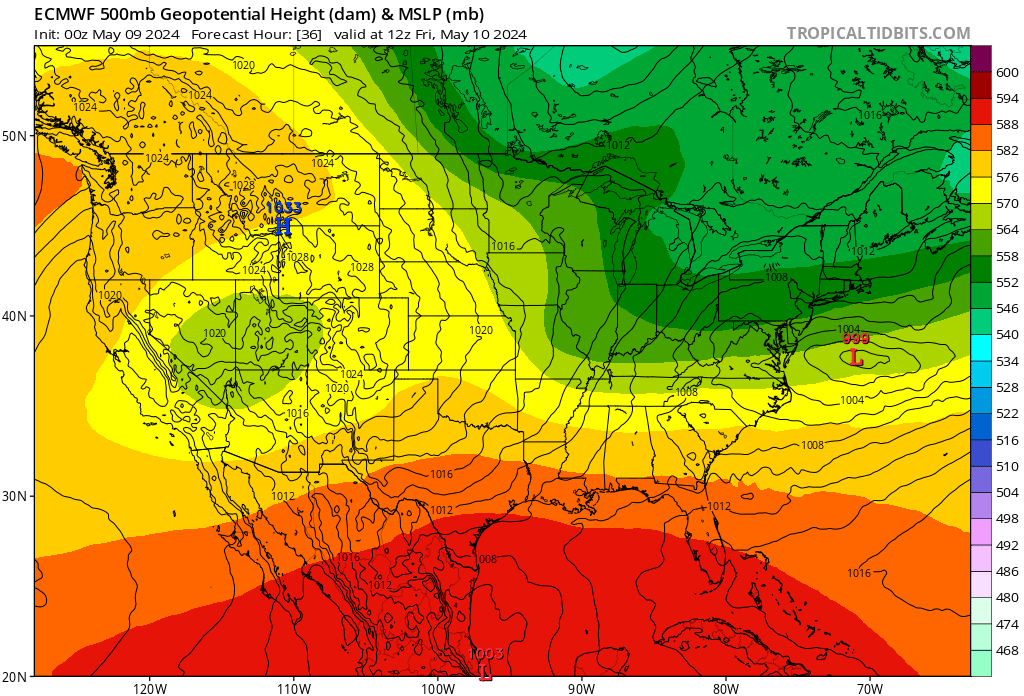
The Euro is going for a close in tropical tracks rather than recurves with plenty of high pressure over the Northeast.


-
3
-


Occasional Thoughts on Climate Change
in Climate Change
Posted
Yeah, the rise in minimum temperatures at the airport is nearly identical to the one in Mt Holly at the NWS forecast office over the last 30 years. The population at Mt. Holly has remained nearly steady at 10k as the population in Philadelphia has held steady around 1.5 million. So it doesn’t appear that the Philadelphia UHI intensity has changed much in 30 years. So all the warming over the last 30 years is the result of a steadily warming climate and not the local increase in UHI intensity.
Philadelphia International Airport 30yr minimum temperature rise +2.6°F.
Mt.Holly NWS WFO 30 year minimum temperature rise +2.8°F