

bluewave
-
Posts
34,739 -
Joined
-
Last visited
Content Type
Profiles
Blogs
Forums
American Weather
Media Demo
Store
Gallery
Posts posted by bluewave
-
-
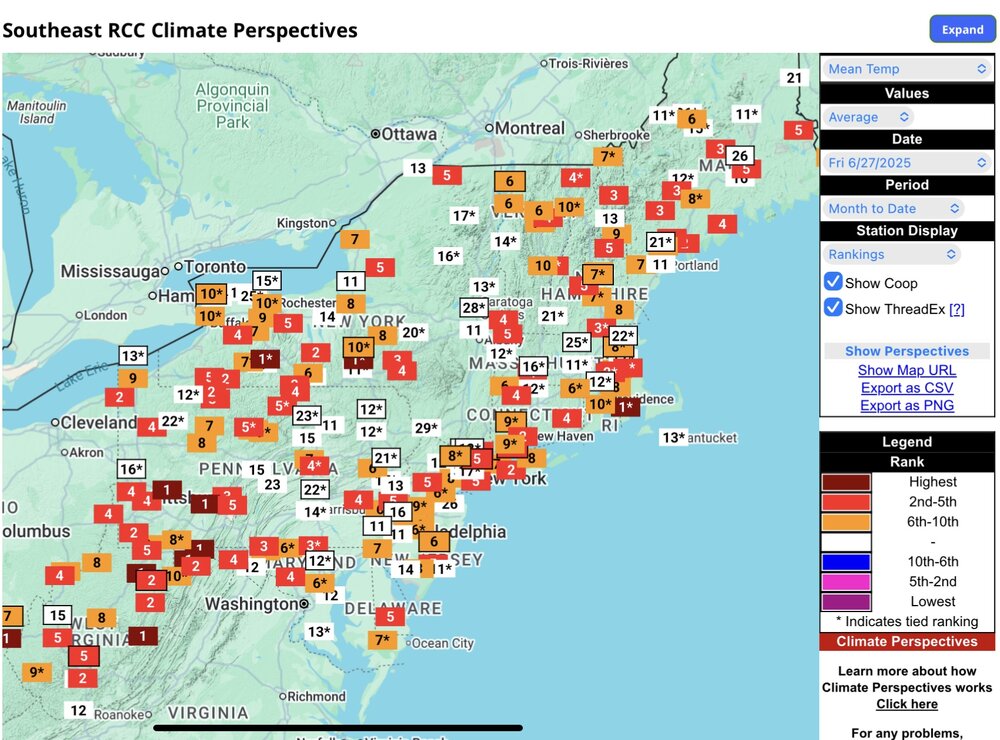
More top 10 monthly warmth around the area. Islip and Sussex, NJ recorded their warmest Junes on record. Since the new 1991-2020 climate normals are so warm, all it took was a +3.2 at Islip and +3.4 at Sussex.
Time Series Summary for SUSSEX AIRPORT, NJ - Month of Jun
Click column heading to sort ascending, click again to sort descending.1 2025 71.1 0 2 2024 71.0 0 - 2005 71.0 0 3 2021 70.1 0 4 2008 69.7 0 5 2014 69.6 0 6 2010 69.2 0 7 2020 68.8 0 8 2007 68.3 2 9 2001 68.2 0 10 2011 68.1 0
Time Series Summary for SOMERSET AIRPORT, NJ - Month of Jun
Click column heading to sort ascending, click again to sort descending.1 2024 72.4 0 2 2005 72.3 0 3 2010 71.9 0 4 2025 71.7 0 - 2008 71.7 0 5 2021 71.5 0 6 2020 70.5 0 7 2015 70.3 4 - 2013 70.3 0 - 2001 70.3 0 8 2014 70.2 0 - 2011 70.2 0 9 2016 70.1 0 10 2006 70.0 0 Time Series Summary for NEWARK LIBERTY INTL AP, NJ - Month of Jun
Click column heading to sort ascending, click again to sort descending.1 1994 77.8 0 2 2024 77.5 0 3 2021 76.2 0 - 2010 76.2 0 4 1993 75.8 0 5 2025 75.4 0 - 1943 75.4 0 6 2008 75.3 0 7 1984 75.0 0 8 1971 74.8 0 9 2005 74.6 0 - 1981 74.6 0 - 1973 74.6 0 10 2011 74.5 0 Time Series Summary for JFK INTERNATIONAL AIRPORT, NY - Month of Jun
Click column heading to sort ascending, click again to sort descending.1 2010 74.5 0 2 1984 73.9 0 3 2024 73.8 0 4 2008 73.4 0 5 2025 72.9 0 6 2001 72.5 0 7 1991 72.3 0 8 1952 72.2 0 9 2011 72.1 0 - 1971 72.1 0 10 1994 72.0 0 Time Series Summary for WESTCHESTER CO AP, NY - Month of Jun
Click column heading to sort ascending, click again to sort descending.1 2024 71.9 0 2 2025 71.5 0 3 2010 71.4 1 4 1999 71.3 1 - 1957 71.3 0 5 2005 70.9 2 6 2008 70.8 0 7 1952 70.7 0 8 1994 70.6 0 9 2021 70.5 0 - 1991 70.5 2 10 1949 70.4 1 Time Series Summary for ISLIP-LI MACARTHUR AP, NY - Month of Jun
Click column heading to sort ascending, click again to sort descending.1 2025 72.2 0 2 2024 72.0 0 3 2010 71.9 0 - 1999 71.9 0 4 2008 71.6 0 5 1994 71.3 0 6 2001 70.9 0 7 2020 70.7 0 8 2021 70.6 0 9 2014 70.5 0 - 1991 70.5 0 10 1984 70.1 0 -
On 6/27/2025 at 1:54 PM, Wannabehippie said:
Is there any link to this news? I want to be able to share it around.
Thanks.-
 1
1
-
-
11 hours ago, LibertyBell said:
It's hard to believe Central Park being 5 degrees cooler than me but here we are.
I'll also note that even when we went completely overcast here for an hour I was still 3 degrees hotter than Central Park's highest temperature of the day!
Measuring the temperatures under a mature stand of trees will always be 3° to 5° cooler than in a grassy clearing on sunny and warm days.
NYC was usually pretty close to the surrounding sites like Newark from 1936 to 1980. This is when the thermometer wasn’t underneath trees. Some heatwaves NYC was warmer than Newark. Many of the 100°+ readings from that era would have only been 98°-99°with a similar sitting to what NYC has seen since the increased tree growth in the last 10 years.
Tree growth was slowly becoming an issue from the 1980s into the early 1990s. Then there was a greater shift in 1995 when the new ASOS was installed. This became much more pronounced since 2014 along with the continuing tree growth.
Monthly Data for July 1936 for Upton NY NWS CWA
Click column heading to sort ascending, click again to sort descending.NJ PLAINFIELD COOP 106 NY NY CITY CENTRAL PARK WBAN 106 NY PORT JERVIS COOP 105 NJ ELIZABETH COOP 105 NJ JERSEY CITY COOP 105 NJ LITTLE FALLS COOP 105 NJ PATERSON COOP 105 NJ CHARLOTTEBURG RESERVOIR COOP 105 NY SCARSDALE COOP 105 NY BEDFORD HILLS COOP 105 NJ NEWARK LIBERTY INTL AP WBAN 104 NY FLUSHING COOP 104 NY WEST POINT COOP 104 NY MOUNT VERNON COOP 103 NY HICKSVILLE COOP 103 NY CARMEL COOP 103 CT WATERBURY ANACONDA COOP 103 CT WATERBURY CITY HALL COOP 103
Monthly Data for July 1949 for Upton NY NWS CWA
Click column heading to sort ascending, click again to sort descending.NJ NEWARK LIBERTY INTL AP WBAN 105 NJ PATERSON COOP 105 NJ PLAINFIELD COOP 104 CT MOUNT CARMEL COOP 104 CT NORWALK COOP 102 NJ CANOE BROOK COOP 102 NY NY CITY CENTRAL PARK WBAN 102 NJ RUTHERFORD COOP 102 CT WATERBURY ANACONDA COOP 102 NY SCARSDALE COOP 101 NJ ELIZABETH COOP 101 NJ RIDGEFIELD COOP 101 CT WATERBURY CITY HALL COOP 101 NY DOBBS FERRY-ARDSLEY COOP 100 NY WEST POINT COOP 100 CT GREENWICH COOP 100 CT BRIDGEPORT COOP 100 NY BEDFORD HILLS COOP 100 NY WESTCHESTER CO AP WBAN 100 NY LAGUARDIA AIRPORT WBAN 100
Monthly Data for September 1953 for Upton NY NWS CWA
Click column heading to sort ascending, click again to sort descending.NJ PATERSON COOP 106 NJ PLAINFIELD COOP 105 NJ ELIZABETH COOP 105 NJ NEWARK LIBERTY INTL AP WBAN 105 NJ LITTLE FALLS COOP 105 NY WEST POINT COOP 105 NJ WANAQUE RAYMOND DAM COOP 104 NY SUFFERN 2 E COOP 104 NY PORT JERVIS COOP 103 NY NEW YORK LAUREL HILL COOP 103 NJ ESSEX FELLS SERVICE BLDG COOP 103 NY NORTHPORT COOP 103 NY BEDFORD HILLS COOP 103 NY CARMEL COOP 103 CT WATERBURY ANACONDA COOP 103 NY NY WESTERLEIGH STAT IS COOP 102 NY LAGUARDIA AIRPORT WBAN 102 NY NY CITY CENTRAL PARK WBAN 102 NJ RIDGEFIELD COOP 102 NY STEWART FIELD WBAN 102 NY WALDEN 2 NE COOP 102 CT NORWALK COOP 102 NY SCARSDALE COOP 102 NY DOBBS FERRY-ARDSLEY COOP 101 CT STAMFORD COOP 101 CT NORWICH 5 SW COOP 101 NJ CHARLOTTEBURG RESERVOIR COOP 100 NY OSSINING SING SING COOP 100 NY MIDDLETOWN 2 NW COOP 100 NY FARMINGDALE 2 NE COOP 100 CT DANBURY COOP 100 NY WESTCHESTER CO AP WBAN 100 Monthly Data for August 1955 for Upton NY NWS CWA
Click column heading to sort ascending, click again to sort descending.NJ PLAINFIELD COOP 103 NJ ELIZABETH COOP 103 NJ PATERSON COOP 103 NY HEMPSTEAD MALVERNE COOP 103 NY PORT JERVIS COOP 102 NJ LITTLE FALLS COOP 102 NY NEW YORK FLOYD BENNETT FIELD WBAN 101 NY NEW YORK LAUREL HILL COOP 101 NY DOBBS FERRY-ARDSLEY COOP 101 NY WEST POINT COOP 101 NY CARMEL COOP 101 NJ JERSEY CITY COOP 100 NJ NEWARK LIBERTY INTL AP WBAN 100 NY NY WESTERLEIGH STAT IS COOP 100 NY LAGUARDIA AIRPORT WBAN 100 NY NY CITY CENTRAL PARK WBAN 100 NJ RIDGEFIELD COOP 100 NJ ESSEX FELLS SERVICE BLDG COOP 100 NJ WANAQUE RAYMOND DAM COOP 100 NY SUFFERN 2 E COOP 100 NY WALDEN 2 NE COOP 100 Monthly Data for July 1966 for Upton NY NWS CWA
Click column heading to sort ascending, click again to sort descending.NY LAGUARDIA AIRPORT WBAN 107 NJ NEWARK LIBERTY INTL AP WBAN 105 NY NEW YORK AVE V BROOKLYN COOP 105 NY JFK INTERNATIONAL AIRPORT WBAN 104 NY ISLIP-LI MACARTHUR AP WBAN 104 NY PORT JERVIS COOP 104 NY NEW YORK LAUREL HILL COOP 104 NJ LITTLE FALLS COOP 104 NY WEST POINT COOP 103 NY MINEOLA COOP 103 CT NORWALK GAS PLANT COOP 103 NJ ELIZABETH COOP 103 NJ CANOE BROOK COOP 103 NY NY CITY CENTRAL PARK WBAN 103 NJ ESSEX FELLS SERVICE BLDG COOP 103 NJ PATERSON COOP 103 Monthly Data for July 1977 for Upton NY NWS CWA
Click column heading to sort ascending, click again to sort descending.NY NEW YORK LAUREL HILL COOP 104 NY NY CITY CENTRAL PARK WBAN 104 NY DOBBS FERRY-ARDSLEY COOP 103 NJ NEWARK LIBERTY INTL AP WBAN 102 NJ TETERBORO AIRPORT WBAN 102 CT NORWALK GAS PLANT COOP 102 NJ ESSEX FELLS SERVICE BLDG COOP 101 NY WEST POINT COOP 101 NY VANDERBILT MUSEUM COOP 101 NJ PLAINFIELD COOP 100 NJ CRANFORD COOP 100 NY NEW YORK AVE V BROOKLYN COOP 100 NY NY WESTERLEIGH STAT IS COOP 100 NJ LITTLE FALLS COOP 100 NY MARYKNOLL COOP 100 CT STAMFORD 5 N COOP 100 NY SCARSDALE COOP 100 CT NEW HAVEN COOP 100 CT MIDDLETOWN 4 W COOP 100 NJ CANOE BROOK COOP 99 NY LAGUARDIA AIRPORT WBAN 99 NJ WANAQUE RAYMOND DAM COOP 99 NY SUFFERN COOP 99 CT DANBURY COOP 99 NY WESTCHESTER CO AP WBAN 99
Monthly Data for July 1980 for Upton NY NWS CWA
Click column heading to sort ascending, click again to sort descending.NY DOBBS FERRY-ARDSLEY COOP 104 NY NEW YORK LAUREL HILL COOP 104 NJ PLAINFIELD COOP 102 NJ CRANFORD COOP 102 NY NY WESTERLEIGH STAT IS COOP 102 NY NY CITY CENTRAL PARK WBAN 102 NJ LODI COOP 102 NJ TETERBORO AIRPORT WBAN 102 NJ WANAQUE RAYMOND DAM COOP 101 NJ NEWARK LIBERTY INTL AP WBAN 101 NY NEW YORK AVE V BROOKLYN COOP 101 NJ ESSEX FELLS SERVICE BLDG COOP 101 NJ LITTLE FALLS COOP 101 CT NORWALK GAS PLANT COOP 101 NY SCARSDALE COOP 101 NY WEST POINT COOP 100 NJ CANOE BROOK COOP 100 CT NEW HAVEN COOP 100 CT NORWICH PUBLIC UTILITY PLANT COOP 100 NY LAGUARDIA AIRPORT WBAN 99 -
4
-
-
56 minutes ago, LibertyBell said:
It's where I experienced the April 1982 Blizzard!!
That still remains one of my all-time favorite snowstorms. Probably the most electrified blizzard. The record cold and snow in April 1982 would have been impressive in the 1880s or 1780s.
-
1
-
-
On 6/28/2025 at 10:02 AM, LibertyBell said:
I grew up near Prospect Park, and spent my weekends playing frisbee in there growing up :-)
Yeah, great part of NYC. The whole area from around Prospect Park to the Brooklyn Waterfront has seen a real renaissance over the last 20 years. Gorgeous views especially when we get some snow.
-
3
-
-
19 minutes ago, LibertyBell said:
This was my favorite June, we even topped 2010 records!!
It’s possible that the 103° recoded out at Baiting Hollow could be the new all-time high for any month on Eastern Long Island.
GoClimatological Data for BAITING HOLLOW, NY - June 2025
Click column heading to sort ascending, click again to sort descending.Sum 2242 1700 - - 30 187 1.12 0.0 - Average 80.1 60.7 70.4 4.0 - - - - 0.0 Normal 76.7 56.2 66.4 - 52 93 3.86 M - Above Normals represent the month through 2025-06-29. 2025-06-01 71 45 58.0 -4.0 7 0 0.00 0.0 0 2025-06-02 68 50 59.0 -3.3 6 0 0.00 0.0 0 2025-06-03 73 45 59.0 -3.6 6 0 0.00 0.0 0 2025-06-04 81 50 65.5 2.6 0 1 0.00 0.0 0 2025-06-05 81 55 68.0 4.8 0 3 0.00 0.0 0 2025-06-06 89 64 76.5 13.0 0 12 0.00 0.0 0 2025-06-07 84 67 75.5 11.6 0 11 0.00 0.0 0 2025-06-08 79 60 69.5 5.3 0 5 0.10 0.0 0 2025-06-09 75 59 67.0 2.5 0 2 0.02 0.0 0 2025-06-10 64 60 62.0 -2.8 3 0 0.02 0.0 0 2025-06-11 71 57 64.0 -1.2 1 0 0.21 0.0 0 2025-06-12 84 61 72.5 7.0 0 8 0.00 0.0 0 2025-06-13 92 64 78.0 12.2 0 13 0.00 0.0 0 2025-06-14 78 58 68.0 1.9 0 3 0.18 0.0 0 2025-06-15 61 57 59.0 -7.5 6 0 0.22 0.0 0 2025-06-16 68 59 63.5 -3.3 1 0 0.00 0.0 0 2025-06-17 71 61 66.0 -1.1 0 1 0.00 0.0 0 2025-06-18 71 63 67.0 -0.4 0 2 0.15 0.0 0 2025-06-19 83 64 73.5 5.7 0 9 0.00 0.0 0 2025-06-20 90 67 78.5 10.4 0 14 0.00 0.0 0 2025-06-21 86 62 74.0 5.6 0 9 0.00 0.0 0 2025-06-22 88 70 79.0 10.3 0 14 T 0.0 0 2025-06-23 92 71 81.5 12.5 0 17 0.05 0.0 0 2025-06-24 95 70 82.5 13.2 0 18 0.00 0.0 0 2025-06-25 103 71 87.0 17.5 0 22 0.00 0.0 0 2025-06-26 98 65 81.5 11.7 0 17 0.12 0.0 0 2025-06-27 71 62 66.5 -3.6 0 2 0.00 0.0 0 2025-06-28 75 63 69.0 -1.3 0 4 0.05 0.0 0 2025-06-29 M M M M M M M 0.0 0 2025-06-30 M M M M M M M M M -
1
-
-
17 minutes ago, LibertyBell said:
To be fair, summers should always be judged by number of 90/95/100 degree days.
This June finished 3rd for 90° days at ISP and 1st for 95° and 100° days. The 70° day low count came in at 2nd place. This June set the new all-time high at 101° by a full 5°.The low max of 77° tied for the highest in June.
Time Series Summary for Islip Area, NY (ThreadEx) - Month of Jun 90° days
Click column heading to sort ascending, click again to sort descending.1 1988 6 0 2 2012 5 0 - 1999 5 0 3 2025 4 2 - 2003 4 0 - 1997 4 0 - 1991 4 0 - 1966 4 0 Time Series Summary for Islip Area, NY (ThreadEx) - Month of Jun 95° days
Click column heading to sort ascending, click again to sort descending.1 2025 2 2 2 2012 1 0 - 2008 1 0 - 1999 1 0 - 1994 1 0 - 1991 1 0 - 1988 1 0 - 1966 1 0 Time Series Summary for Islip Area, NY (ThreadEx) - Month of Jun 100° days
Click column heading to sort ascending, click again to sort descending.1 2025 1 2 2 2024 0 0 - 2023 0 0 - 2022 0 0 Time Series Summary for Islip Area, NY (ThreadEx) - Month of Jun 70° lows
Click column heading to sort ascending, click again to sort descending.1 2021 5 0 - 2013 5 0 - 2008 5 0 - 2002 5 0 - 1969 5 0 2 2025 4 2 - 2024 4 0 - 1999 4 0 Time Series Summary for Islip Area, NY (ThreadEx) - Month of Jun all-time high
Click column heading to sort ascending, click again to sort descending.1 2025 101 2 2 1994 96 0 - 1966 96 0 3 2012 95 0 - 2008 95 0 - 1999 95 0 - 1991 95 0 - 1988 95 0 Time Series Summary for Islip Area, NY (ThreadEx) - Month of Jun all-time low max
Click column heading to sort ascending, click again to sort descending.1 2025 77 2 - 2012 77 0 3 2010 75 0 4 2021 74 0 - 1999 74 0 5 2019 73 0 - 2013 73 0 - 2008 73 0 - 2001 73 0 - 1998 73 0 - 1991 73 0 6 2024 72 0 - 2003 72 0 - 1994 72 0 - 1984 72 0 -
1
-
-
27 minutes ago, qg_omega said:
28th warmest next to 4th warmest
70°+ Junes are becoming the new normal for Long Island.
Time Series Summary for ISLIP-LI MACARTHUR AP, NY - Month of Jun
Click column heading to sort ascending, click again to sort descending.1 2024 72.0 0 2 2010 71.9 0 - 1999 71.9 0 3 2025 71.6 2 - 2008 71.6 0 4 1994 71.3 0 5 2001 70.9 0 6 2020 70.7 0 7 2021 70.6 0 8 2014 70.5 0 - 1991 70.5 0 9 1984 70.1 0 10 2011 70.0 0 -
Another top 10 warmest month for the Northeast.
-
2
-
-
13 hours ago, Stormchaserchuck1 said:
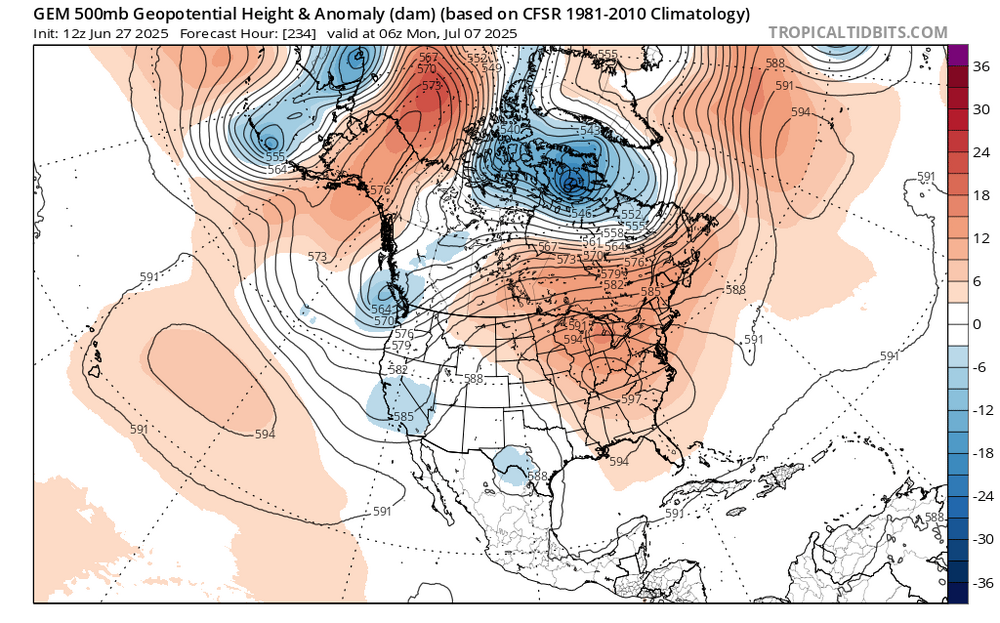
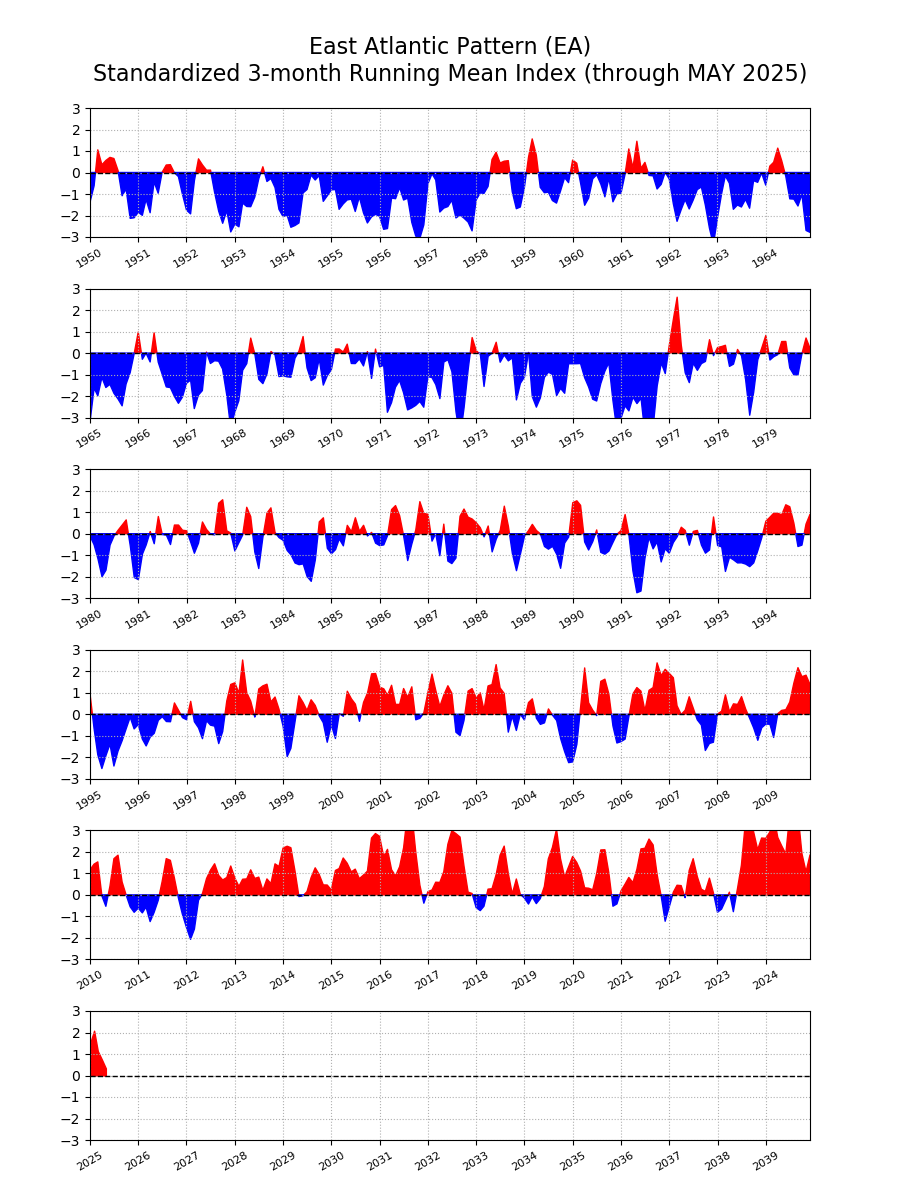
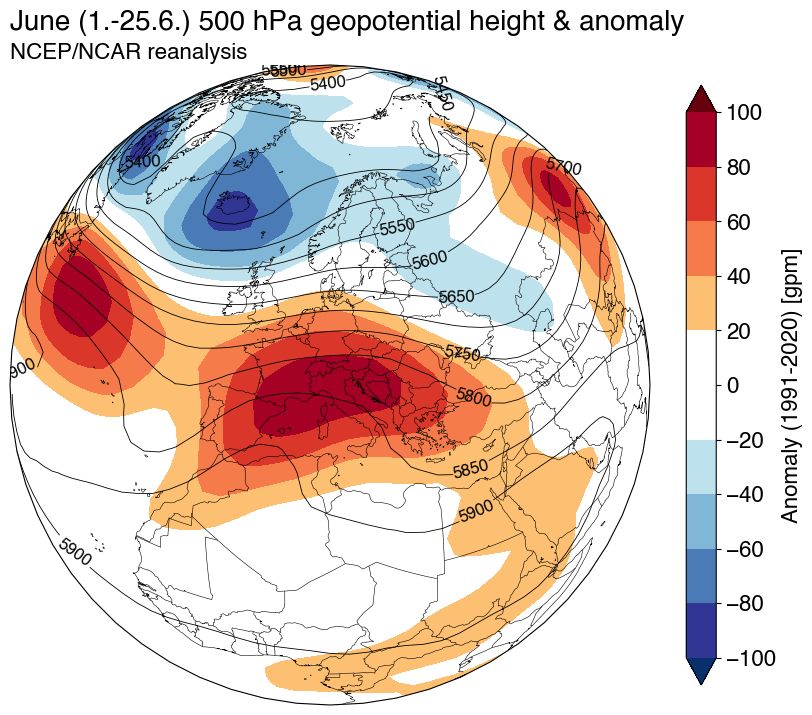
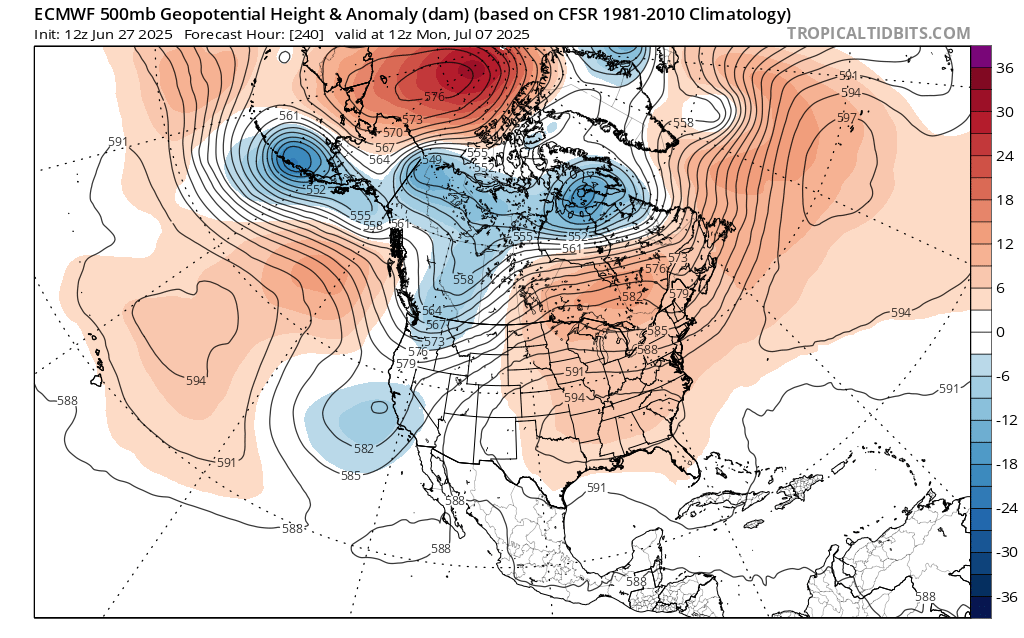
Looks like it maxes out over France.. I bet bluewaves 500mb anomaly record maps show historic ridging there.
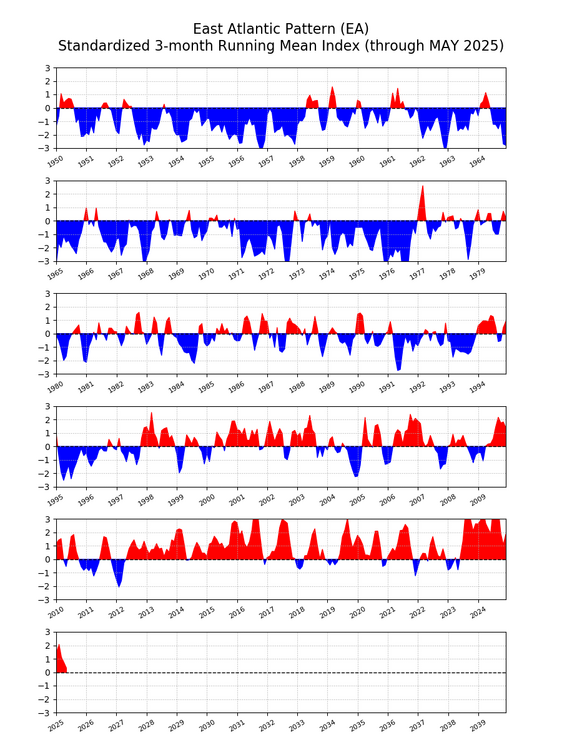
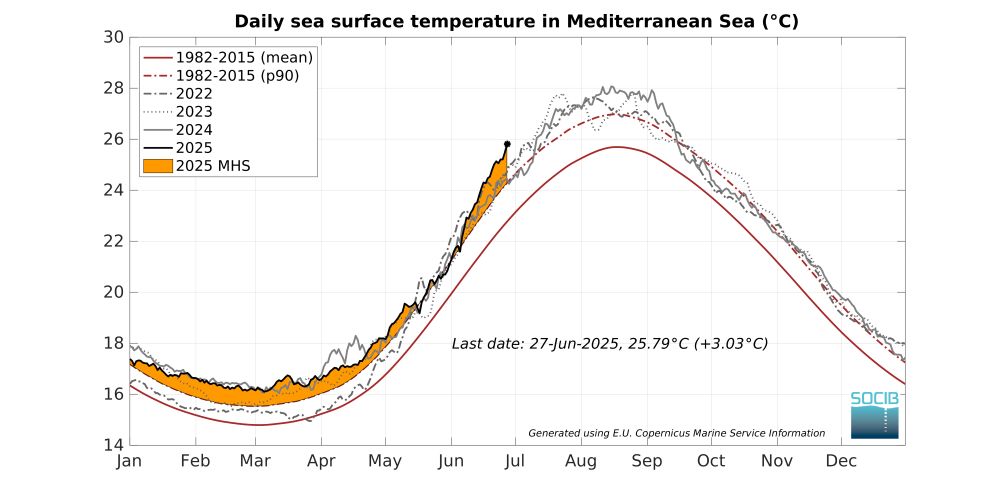
My guess is that this that the expanding subtropical ridges across the planet from Japan to the Eastern US and Europe as the climate warms are driving these multiple records. Notice how the EA has become so positive over time. So the +NAO could be driven by the expansion of these ridges. Plus the feedback from the record marine heatwaves east of Japan across the Atlantic to the Mediterranean.
 The Mediterranean is now warmer than it typically was in August during the recent 1982–2015 climate period. And it’s no wonder when you look at the atmospheric circulation: a strong upper-level ridge has parked over the western Mediterranean, allowing the marine heatwave to develop.ALTALT111
-
2
-
-
1 hour ago, SnoSki14 said:
I hope we don't repeat because that was brutal. Working outside was not fun those days, I don't know how southern folks deal with this
Yeah, working outside in that type of heat is brutal. I rode a few miles on the Long Beach Boardwalk back in July 1999 with 100° and a 75° dewpoint. It was pretty intense. But I actually enjoyed the 0° with 50 mph gusts in January 1985 more.
")
-
58 minutes ago, SnoSki14 said:
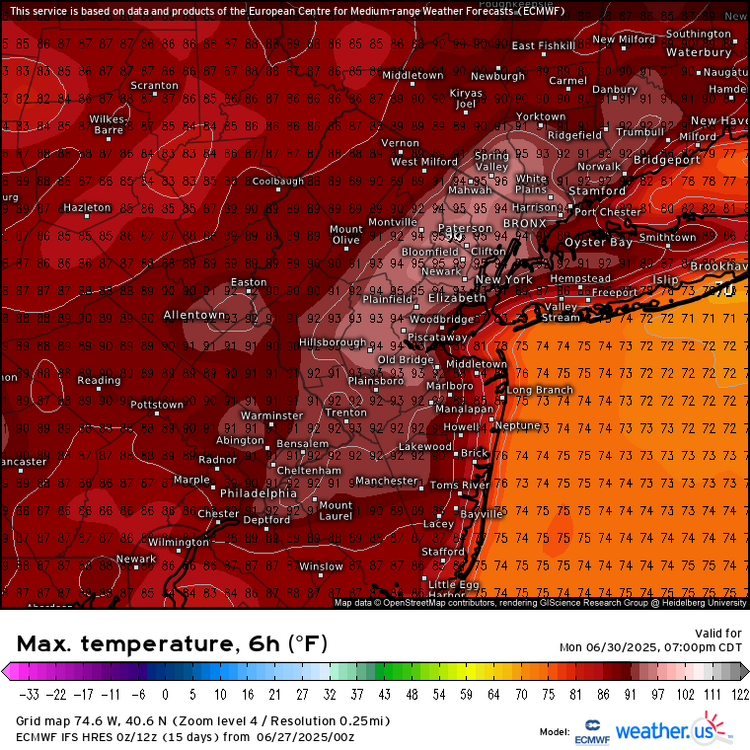
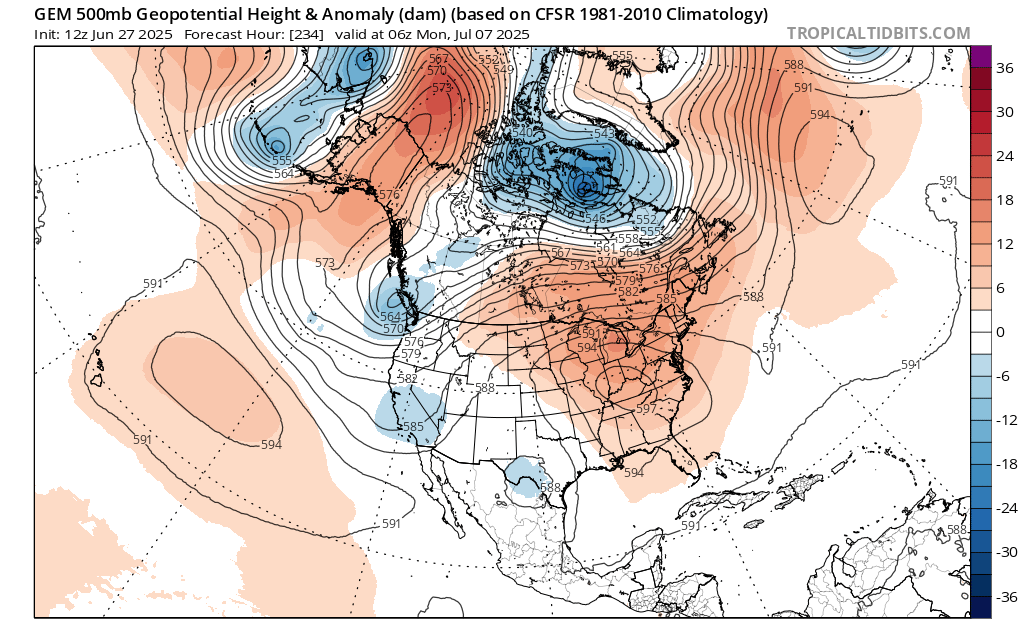
Models go for another strong ridge after the holiday but it's centered SW of us vs directly over and then it retros west.
If that holds true then we'll avoid another 100+ stretch.
Yeah, models starting to show a retrogression pattern. A piece of the Plains heat may try to come east in early July for a few days in the mid to perhaps upper 90s. But if the ridge axis remains west, then it won’t be nearly as hot as this last week was. That would follow the more historic precedent of no follow ups above 103° so soon. So maybe 95° to 99° for a day or two before the ridge pulls back. Then it’s possible that the WAR retrogrades in mid to late July with more 95° to 100° heat here. But hopefully nothing as strong as we just saw in late June.
-
1
-
 1
1
-
-
9 hours ago, GaWx said:
The PDO continues to plunge:
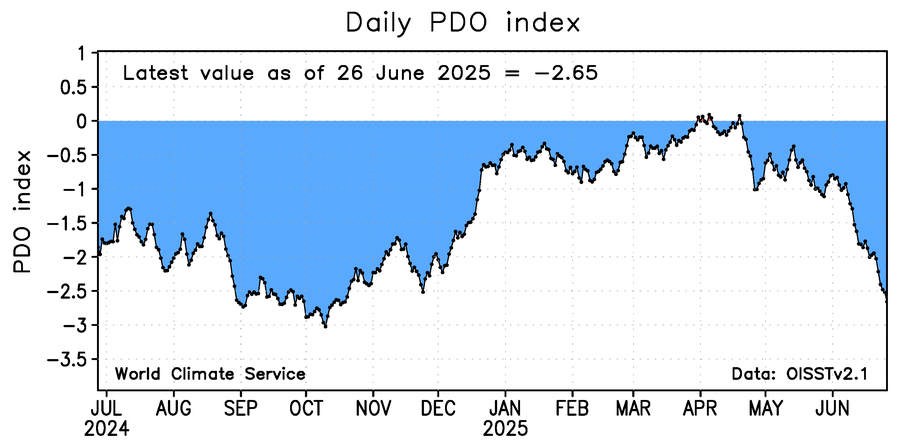
The NOAA PDO is likely pushing -3.5!
The record ridge over the WPAC driving the steep -PDO decline has resulted in the earliest end to the rainy season that the west of Japan has ever seen. Also part of the pattern which drove the all-time June heat the heat in the East a few days ago. So even with a neutral ENSO it’s creating a very strong La Niña background pattern. Very impressive forcing over the Maritime Continent.
https://japannews.yomiuri.co.jp/society/general-news/20250627-266163/Rainy season appears to have ended in various parts of western Japan, it was announced Friday.
According to the Japan Meteorological Agency, the season ended in the southern Kyushu region 18 days earlier than usual and 19 days earlier than last year. In the northern Kyushu region, the season ended 22 days earlier than usual and 20 days earlier than last year.
The Shikoku region saw the season finish 20 days earlier than average and 20 days earlier than last year, and the Chugoku region was 22 days earlier than average and 24 days earlier than last year. In the Kinki region, the season finished 22 days earlier than average and 21 days earlier than last year. With the exception of southern Kyushu, this marks the earliest end of the rainy season in western Japan since records began in 1951.
-
1
-
1
-
-
11 hours ago, rclab said:
Thank you so much BW. I sent it to my daughter. A portion of the video shows Congress street park. The small row houses shown were actually carriage houses for the transportation use of the wealthy families who lived in the brownstone residences opposite them. The park is the result of those homes being demolished to make way for a multi family high rise apartment building project that was supposed to be built there. It was delayed, then stopped.The park was the positive legacy. The carriage houses were converted to cottage residences. The pine trees lined up against the fence were post holiday waiting for recycling. The snow gives even the harshest urban setting a touch of beauty. I pray my grandchildren will not need a dated half century video to see it. Thank you again, BW. As always ….
Beautiful collection of photos. There is so much Brooklyn history there going back to the Dutch settlement. The neighborhoods from around Prospect Park back to through your area up to Williamsburg contain some of the most sough-after urban real estate in the United States. I was able to find a great old photo from the Blizzard of 1888.
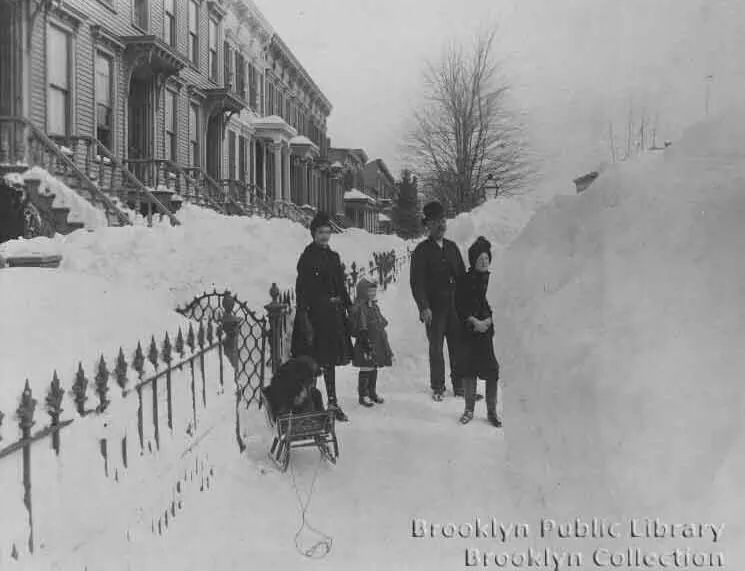
Out in the snow in Cobble Hill, possibly Clinton Street near Amity Street. Photo via Brooklyn Public Library
-
3
-
1
-
-
12 minutes ago, rclab said:
Over half century ago I thought as you do and wanted desperately to live as you describe. I didn’t want to live so that when I coughed a neighbor could reach over and pat my back. Now nearing the end of my eighth decade I’m better off living with all I need within a short walk. Perhaps the present inner city environment is a bit like our ancestors. Cave drawing becoming graffiti. Depression, anxiety, anger as side effects of a green less environment can not be disputed. I just wanted to imagine how nice it would be to see an urban environment with buildings that resemble forested mountains. Stay well and thank you for your response. As always ….
You live in a great neighborhood. Cobble Hill is one of the most in demand places to live in Brooklyn. Some people like a more urban setting and others more rural. You can be happy in many different types of environments.
https://www.instagram.com/reel/DEf_vA7B4Fm/
-
3
-
-
7 hours ago, jm1220 said:
Looks like a general steam bath pattern. 92/75 is no fun here either.
Unfortunately, the 12z guidance wants to reload another 594+ ridge in about 10 days. I was hoping we could get a break from the 100° heat. But it looks like the pattern may have other ideas. Past instances of 103° to 105° heat didn’t usually have such a quick follow up of the ridge rebuilding. So maybe we can keep it more in the 95° to 100° range in early to mid-July rather than pushing 105° again. But who knows for sure with this climate.

-
49 minutes ago, MJO812 said:
We need less buildings like upstate NY.
Upstate NY is turning into one of the most in demand real estate markets as we may be seeing the beginning of a reverse migration process.
-
2
-
-
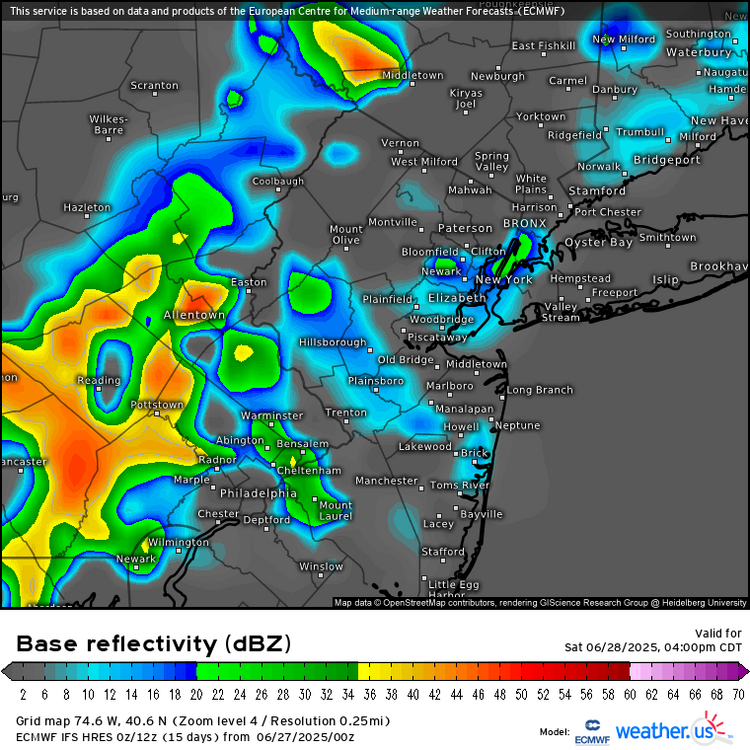
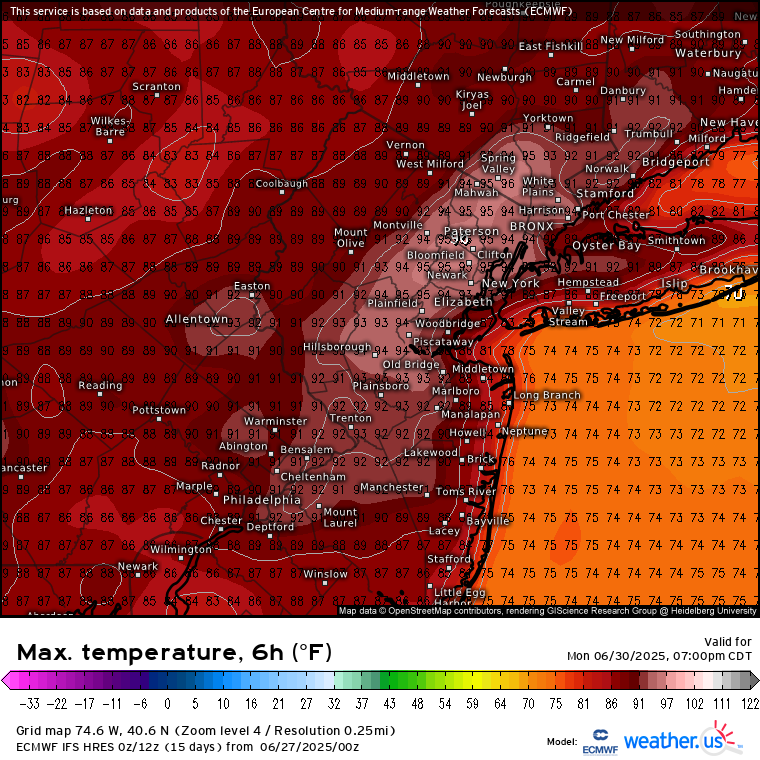
Continuation of the same pattern into late June. Another weekend with chances for rain but no washout. Saturday looks like the best chance for scattered convection. Drier on Sunday. Then mid 90s on Monday just inland from sea breeze front west of NYC.
-
1
-
-
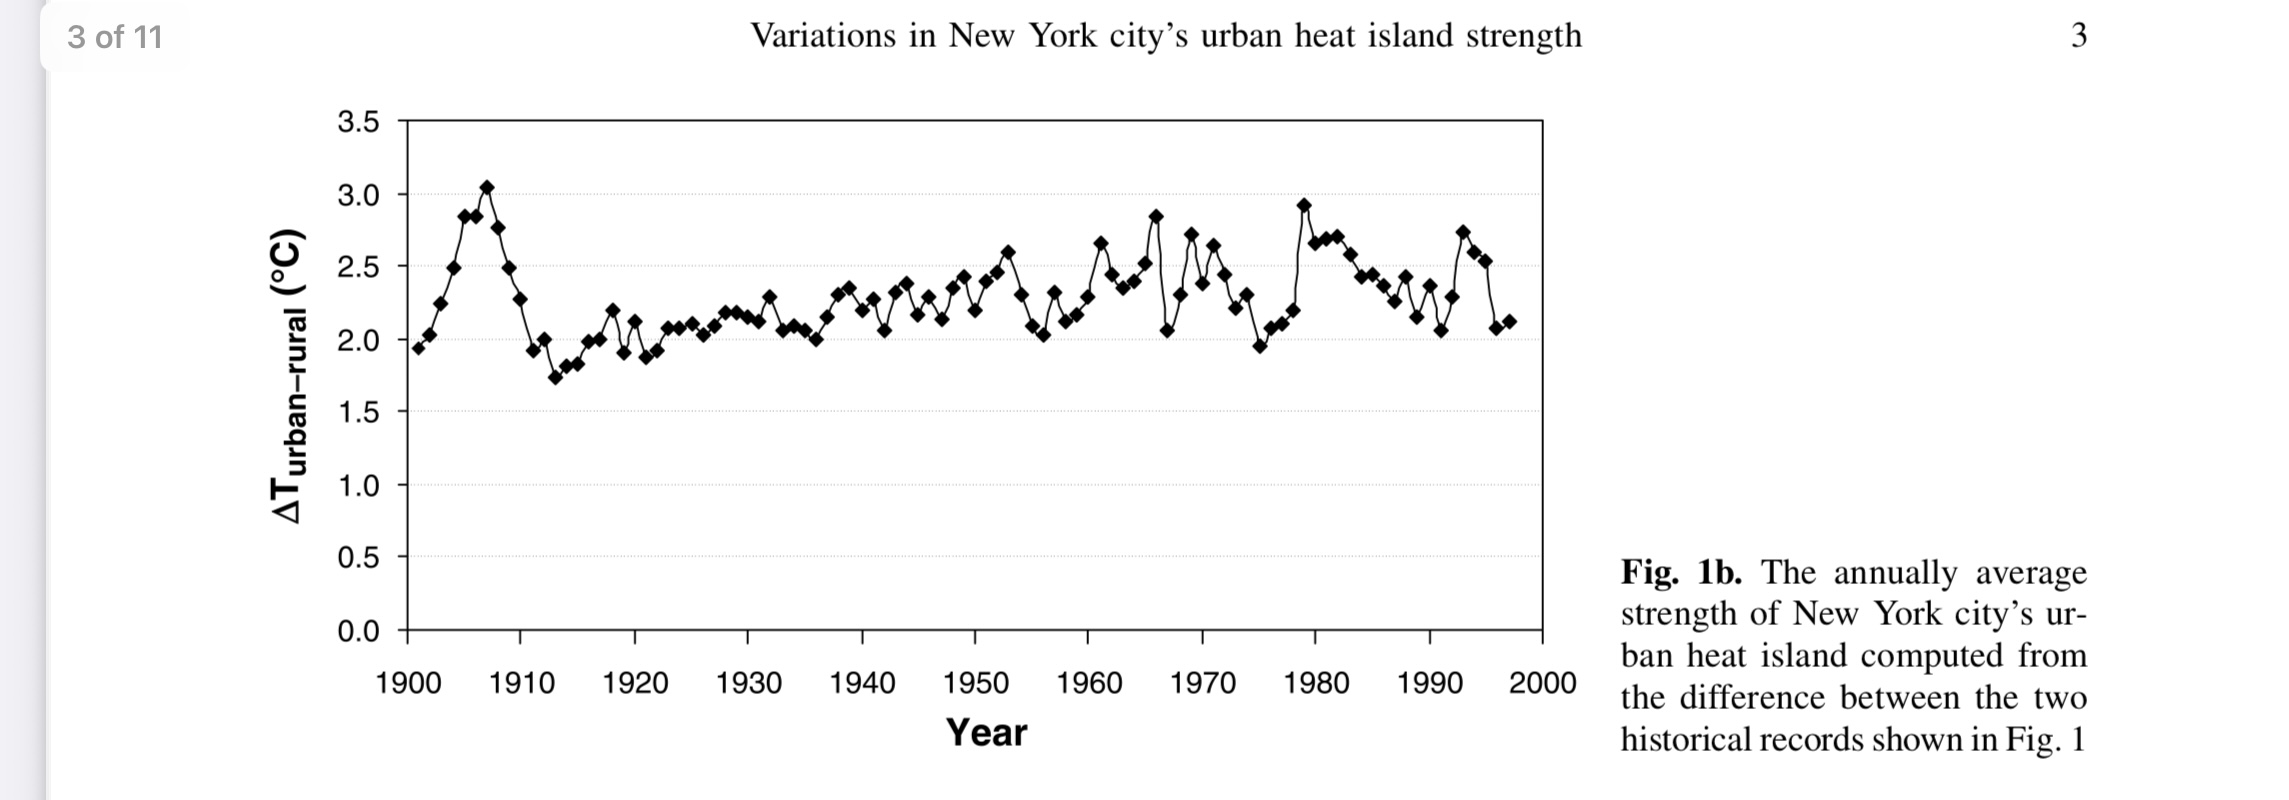
1 hour ago, Roger Smith said:
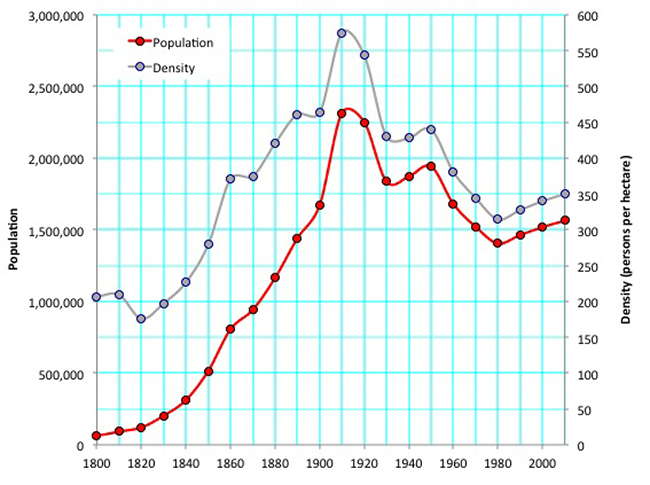
But even by around 1890 to 1900 large cities were beginning to display an urban heat island.
Manhattan UHI peaked in 1910 right before the population density began to decline.

-
2
-
-
The NAM is finally getting replaced after they stop updating it in March 2017.
Public Information Statement 25-41
National Weather Service Headquarters Silver Spring, MD
845 AM EDT Thu Jun 26 2025
To: Subscribers:
-NOAA Weather Wire Service
-Emergency Managers Weather Information Network
-NOAAPORT
Other NWS Partners, Users and Employees
From: Richard Bandy
Acting Director
NCEP/Environmental Modeling Center
Subject: Soliciting Comments on Proposed Discontinuation of the North
American Mesoscale (NAM) model and other Regional Modeling Systems to be
Replaced by the Rapid Refresh Forecast System (RRFS) through July 26,
2025.
The Environmental Modeling Center (EMC) at the National Centers for
Environmental Prediction (NCEP) is working towards replacing the North
American Mesoscale (NAM) model, the High Resolution Window (HiresW) aside
from the Guam domain, the High Resolution Ensemble Forecast (HREF) and
the North American Rapid Refresh Ensemble (NARRE) systems with the
implementation of the Rapid Refresh Forecast System (RRFS) in early 2026.
The NWS is seeking comments on this proposed change through July 26,
2025.
This transition to RRFS would provide an hourly updating modeling system
over a North America region at 3 km horizontal grid spacing, which,
combined with the model retirements, would greatly unify and simplify the
“convective scale” (approximately 3 km grid spacing) regional models
within the NWS operational modeling suite.
As a deterministic system running to 84 h, the RRFS would fully retire
the NAM, and nearly fully retire the HiresW (aside from the Guam domain).
As an ensemble forecast system, the RRFS Ensemble Forecast System (REFS)
would fully retire the HREF and NARRE systems.
The deterministic RRFS generates full domain output at 3 km grid spacing,
and subset grid output over the contiguous United States (CONUS) and
Alaska (AK) (at 3 km grid spacing), and Hawaii (HI) and Puerto Rico (PR)
(at 2.5 km grid spacing). The RRFS will also provide output from a
separate 1.5 km RRFS fire weather run, with output provided over a 5 x 5
degree rotated latitude longitude region. Details of the RRFS output
grids are available in
https://www.emc.ncep.noaa.gov/mmb/mpyle/rrfs_info/rrfs_grids.txt
Relative differences between RRFS output products and the proposed-to-be-
retired system products will be discussed individually by the modeling
-
2
-
-
10 minutes ago, LibertyBell said:
unfortunately it also means less extremely hot days so our climate is becoming compressed to higher mins and less high temperatures of 95/100 or more. 1949 must have had lower low temperatures to balance out the 8 high temperatures of 100+ at EWR and 5 high temperatures of 99+ at NYC.
1949 had record August cold despite the 100° days. So in those days, the heat tended to get balanced out with cold. Plus the following 1950 summer was the 6th coldest on record.
Newark Area, NJ
Period of record: 1931-01-01 through 2025-06-25DateLowest minimum temperatures (degrees F)8/20 52 in 1949 55 in 1943 56 in 2008+ 8/21 53 in 1949 53 in 1940 56 in 1977+ Newark Area, NJ
Period of record: 1931-01-01 through 2025-06-25DateHighest maximum temperatures (degrees F)Top Record 2nd Record 3rd Record8/10 102 in 1949 99 in 2001 97 in 1973+ 8/11 102 in 1949 102 in 1944 98 in 2005
Time Series Summary for NEWARK LIBERTY INTL AP, NJ
Click column heading to sort ascending, click again to sort descending.1 1940 71.0 0 2 1946 71.7 0 3 1945 72.4 0 4 1941 72.5 0 5 1936 72.7 0 6 1950 72.8 0 - 1935 72.8 0 - 1933 72.8 0 - 1932 72.8 0 -
2
-
-
50 minutes ago, LibertyBell said:
Maybe this will cycle back to more 40s-60s type long heatwaves? If not that, maybe a 1993 or 1999 type heatwave (which is still relatively recent), 1999 had two very long super heatwaves and the one extreme heatwave in 1993 really stands out.
Those heatwaves were all about severe droughts since it was a much cooler climate era. Just look at how many summers we had back then when even the warmest parts of NJ couldn’t make it to 20 days reaching 90° in a season. We haven’t seen a summer in NJ with under 20 days reaching 90° since 2014. These days the warm spots in NJ seldom get under 30 days even during our cooler summers.
-
8 minutes ago, LibertyBell said:
I think 1993 and 1999 were in drought patterns too weren't they Chris? We had much drier summers back then. July 1999 was one of the hottest months I have ever experienced. July 1993 right up there too.
Yeah, all the lawns in Long Beach during July 1999 turned brown. 1999 to 2002 was the last time that the NYC reservoirs ran low. These days flooding has become more of a concern than drought.
-
1
-
-
4 minutes ago, LibertyBell said:
I think this week demonstrated that Long Island can be just as hot as New Jersey if the ridge is strong enough. This intense heat was like what we had in 2011. The heat we have had since then wasn't strong enough to overcome the ocean like this one was.
1988 the heat wasn't nearly as intense as what we had in 1993 or 1999 or 2010 or 2011 or what we just had now.
1988 was all about duration. It’s what happens with drought feedback. This wetter pattern is why we don’t get those very long extended heatwaves anymore. But we can still get shorter and more intense ones like the last few days.
-
1
-


July 2025 Discussion-OBS - seasonable summer variability
in New York City Metro
Posted
Looks like the next chance for 95° to 100° heat will be early next week as the 500 mb ridge builds again. Models have more of a southerly flow. So the warmest spots should be further from the sea breeze and coast.