

bluewave
-
Posts
31,534 -
Joined
-
Last visited
Content Type
Profiles
Blogs
Forums
American Weather
Media Demo
Store
Gallery
Posts posted by bluewave
-
-
1 hour ago, LibertyBell said:
So maybe we'll have an early May like we did in 2020?
That combination of snow and cold in May was probably a one-off in our much warmer climate.
-
 1
1
-
-
2 hours ago, SACRUS said:
Looks similar to the 4/14 - 4/16 warmth progression 4/27 - 4/29, then the onshore / clouds could come back. 850s surging on guidance to >16c this coming Sunday (28th) but we'll seeif the onshore squashes next push 80+
Early indications are that the blocking will extend at least into early May. So the exact position of the back door will probably have to wait until we are under 120 hrs. Record blocking across Canada since last May.


-
3
-
-
2 hours ago, LibertyBell said:
34 wow, so close to freezing! Offhand, do you know the latest it's gotten to 32 degrees since 1974 (so over the last 50 years?)
I know the 34 was on May 9th in 2020, what date did that 36 in 2021 occur on?
Thanks!
EDIT I CHECKED TONY'S POST AND IT WAS 36 ON THIS DATE IN 2021-- SO THIS MUST BE THE DAY!
CHRIS, DO YOU KNOW WHAT THE LOW WAS IN MAY 2020 at JFK, when Central Park's low was 34? They both received a T of snow, right?
There was no measurable snow in our local area?
2020 set the record for latest 34° on record in NYC. The last time NYC had a freeze after 4-20 was in 1930. May 2020 was also the 3rd coldest low temperature on record in NYC. JFK tied with 1966 for the coldest reading ever in the month of May.
Frost/Freeze Summary for NY CITY CENTRAL PARK, NY
Each section contains date and year of occurrence, value on that date.
Click column heading to sort ascending, click again to sort descending.YearLastValueFirstValueSeason Length2020 05-09 (2020) 34 10-31 (2020) 32 174 1891 05-06 (1891) 32 11-03 (1891) 33 180 1874 05-03 (1874) 33 11-12 (1874) 32 192 1876 04-30 (1876) 34 10-15 (1876) 32 167 1883 04-29 (1883) 34 11-12 (1883) 30 196
Frost/Freeze Summary for NY CITY CENTRAL PARK, NY
Each section contains date and year of occurrence, value on that date.
Click column heading to sort ascending, click again to sort descending.YearLastValueFirstValueSeason Length1891 05-06 (1891) 32 11-04 (1891) 30 181 1874 04-30 (1874) 32 11-12 (1874) 32 195 1919 04-26 (1919) 31 11-14 (1919) 30 201 1892 04-25 (1892) 32 11-11 (1892) 32 199 1888 04-25 (1888) 31 11-17 (1888) 30 205 1930 04-24 (1930) 31 11-06 (1930) 31 195 1872 04-23 (1872) 29 11-16 (1872) 30 206 1875 04-22 (1875) 28 11-02 (1875) 31 193 1925 04-21 (1925) 32 10-29 (1925) 31 190 1922 04-21 (1922) 32 11-21 (1922) 32 213
Time Series Summary for NY CITY CENTRAL PARK, NY - Month of May
Click column heading to sort ascending, click again to sort descending.RankYearLowest Min TemperatureMissing Count1 1891 32 0 2 1874 33 0 3 2020 34 0 4 1947 35 0 - 1880 35 0 5 1977 36 0 - 1966 36 0 - 1913 36 0 - 1876 36 1
Time Series Summary for JFK INTERNATIONAL AIRPORT, NY - Month of May
Click column heading to sort ascending, click again to sort descending.RankYearLowest Min TemperatureMissing Count1 2020 34 0 - 1966 34 0 2 1992 37 0 3 2008 38 0 - 1977 38 0 - 1970 38 0 - 1956 38 0 -
 1
1
-
-
Warmth will attempt to make a push into the region by the weekend as the Southeast ridge flexes. But it’s uncertain how much of a 50/50 low will try to hold on. So the location of any backdoor will determine how warm we can get. The models have been jumping around much more than usual even for the day 6-10 period recently. Very strong west based block near Hudson Bay this month.

-
5
-
-
2 hours ago, LibertyBell said:
It's pretty rare to get below 40 degrees after 4/20, it's only happened a handful of times in my memory (and most of those were actually in early May like 2020, 1992, etc, and of course there was 1977.) 1983 stands out with a snowstorm on 4/20.
The last times NYC dropped under 40° after 4-20 was back in 2021 and 2020. The rarest was during early May in 2020 when it snowed. That was probably the most anomalous cold event of the 2020s so far.
Time Series Summary for NY CITY CENTRAL PARK, NY
Click column heading to sort ascending, click again to sort descending.Ending DateLowest Min Temperature Apr 21 to May 31Missing Count2023-05-31 43 0 2022-05-31 40 0 2021-05-31 36 0 2020-05-31 34 0 2019-05-31 41 0 2018-05-31 39 0 2017-05-31 44 0 2016-05-31 43 0 2015-05-31 38 0 2014-05-31 41 0 2013-05-31 37 0 2012-05-31 38 0 2011-05-31 40 0 2010-05-31 40 0 -
1
-
2
-
-
8 hours ago, LibertyBell said:
are we returning to early 80s type weather in spring lol?
It was below freezing on this date in 1981 and of course we know what happened in 1982 and 1983 also had a late April snowstorm on the 20th.
The -30C 850 mb temperature near James Bay is close to the record for late April. It looks like the TPV splits in a few days and a piece heads for Maine. So NYC has a shot at dipping under 40° with the interior northeast having a hard freeze potential.


-
5
-
 1
1
-
-
2 hours ago, LibertyBell said:
Chris, humanity is completely unsustainable in its current form. The world only works in its current form for the rich. The hard truth is the world as it is now needs to be completely and utterly destroyed to create a better system from its ashes. And I strongly believe that will happen-- whether we want it to or not. Either we do it, or Nature will do it for us.
Any system based on polarities like ours always runs the risk of falling out of balance. I would like to think that we can eventually shift our consciousness to a higher level which recognizes that we are part of nature rather than separate from it. But it may take until sea level rise begins to inundate our coastal cities or major crop failures occur due to extreme weather and climate events. Climate warming is still too much of an abstraction for society at large to begin to contemplate. The best we can do right now is for like minded individuals to take this information and make any adaptations we can for a much more extreme climate in the future.
It’s a bit of a paradox that the very nature of our evolution on this planet has selected more short term gains rather than long term sustainability. That’s how we have wound up with so many environmental degradation issues which are facing us. At some point we need to use our inherent creativity to override these outdated modes of existence which may have served prehistoric societies short term survival needs but have to be modernized for our current situation. Short term thinking served our ancestors coming out of the caves who had to be on guard in order to quickly get away from dangerous animals. Now we need to use our higher nature to shift toward an existence more in alignment with nature and fellow humans.
-
1
-
-
10 hours ago, LibertyBell said:
The last two springs have been very nice, dry and warm and last April we hit the 90s two days in a row.
Models back to a stronger cold front this week with a piece of the TPV heading for Maine. So interior sections need to watch for a hard freeze. NYC may dip below 40° which will feel very chilly for late April. The low pressure will become the new 50/50 low which has been so persistent since late March. So more continuing backdoor potential.


-
5
-
 3
3
-
-
9 hours ago, qg_omega said:
We are above normal for the month
Mostly driven by the warm minimums due to all the clouds, showers, and onshore flow keeping the high temperatures in check. The average high temperature is nearly 10° colder than last April.


Time Series Summary for NEWARK LIBERTY INTL AP, NJ
Click column heading to sort ascending, click again to sort descending.RankEnding DateMean Max Temperature Apr 1 to Apr 19Missing Count1 2023-04-19 70.6 0 2 2010-04-19 69.7 0 3 2002-04-19 69.1 0 4 1945-04-19 67.5 0 5 2012-04-19 67.0 0 6 1981-04-19 66.7 0 7 1941-04-19 66.2 0 8 2006-04-19 65.9 0 9 1968-04-19 65.5 0 10 2017-04-19 65.4 0 11 1976-04-19 65.0 0 12 1994-04-19 64.6 0 13 1955-04-19 64.3 0 14 1959-04-19 64.2 0 15 1991-04-19 63.8 0 16 2019-04-19 63.6 0 - 2005-04-19 63.6 0 17 1969-04-19 63.4 0 18 2015-04-19 62.9 0 - 1999-04-19 62.9 0 19 1974-04-19 62.8 0 20 1963-04-19 62.7 0 21 2014-04-19 62.5 0 - 1977-04-19 62.5 0 22 1985-04-19 62.4 0 23 2013-04-19 62.3 0 24 2008-04-19 61.9 0 25 1998-04-19 61.6 0 26 2024-04-19 61.5 0 -
3
-
2
-
-
15 hours ago, LibertyBell said:
why are we getting a polar vortex this late in April anyway? Isn't the -NAO gone?
No, the Greenland block is still going strong plus we have a -EPO. That MJO 8 back in late March reset the whole pattern to more blocking with a stronger 50/50 low. This pattern maintains a backdoor nearby with only brief warm ups between plenty of onshore flow, clouds, and showers. Canada is starting to get cold after so much record winter warmth. Figures the relaxation from MJO 4-7 would wait until the spring.


-
3
-
-
Nice improvements today on the 12z Euro. While there will still be a near record polar vortex near James Bay next week, the cold goes more to the east rather than the south. So the lowest NYC may get next week is the 40s rather than the 30s which were shown yesterday. But we’ll continue to watch further runs since these forecasts involving a PV nearby in Canada can jump around a lot from run to run. This is more something we see in the winter rather than in late April.
New run

Old run

-
3
-
-
On 4/15/2024 at 7:52 AM, MJO812 said:
I'm buying this

You should probably invest in a set up like this.
")
-
2
-
-
16 minutes ago, SACRUS said:
96, 2000, 2003 also had to be close.
They were a few degrees warmer for the high temperatures.
Time Series Summary for NEWARK LIBERTY INTL AP, NJ
Click column heading to sort ascending, click again to sort descending.RankEnding DateMean Max Temperature Jun 1 to Jul 31Missing Count1 2009-07-31 79.8 0 2 1969-07-31 80.8 0 3 1972-07-31 80.9 0 4 1985-07-31 81.0 0 - 1979-07-31 81.0 0 - 1958-07-31 81.0 0 5 1996-07-31 81.3 0 - 1947-07-31 81.3 0 6 2000-07-31 81.4 0 - 1945-07-31 81.4 0 7 2003-07-31 81.5 0 - 1936-07-31 81.5 0 8 1956-07-31 81.6 0 9 1967-07-31 81.7 0 10 1982-07-31 81.8 0
Time Series Summary for NEWARK LIBERTY INTL AP, NJ
Click column heading to sort ascending, click again to sort descending.RankEnding DateHighest Max Temperature Jun 1 to Jul 31Missing Count1 2009-07-31 91 0 2 1996-07-31 92 0 - 1979-07-31 92 0 - 1960-07-31 92 0 3 1976-07-31 93 0 - 1970-07-31 93 0 4 1985-07-31 94 0 - 1975-07-31 94 0 - 1939-07-31 94 0 - 1938-07-31 94 0 5 2003-07-31 95 0 - 1973-07-31 95 0 - 1967-07-31 95 0 - 1946-07-31 95 0 -
1
-
-
15 minutes ago, LibertyBell said:
I don't know how you can enjoy that without any records weather gets boring lol
It was the only June and July on record with the average high under 80° at Newark. Very unusual summer for the modern era. As soon as the pattern began to warm in August Central Park got that big microburst.

-
1
-
-
21 minutes ago, FPizz said:
I don't know. I know in winter I love cloudy days with snow showers with the sun setting at 4:30. If I can like that, I can see people liking cool damp days in Spring.
I really enjoyed the 2009 summer since it was still warm enough to go to the beach and boardwalk and it kept the beach crowds down in Long Beach. I was willing to put up with extra rainfall especially early on in June.
Time Series Summary for NEWARK LIBERTY INTL AP, NJ
Click column heading to sort ascending, click again to sort descending.RankEnding DateMean Avg Temperature Jun 1 to Jul 31Missing Count1 1940-07-31 71.5 0 2 2009-07-31 71.6 0 3 1947-07-31 71.7 0 4 1936-07-31 72.0 0 5 1932-07-31 72.1 0 -
3
-
-
11 hours ago, BucksCO_PA said:
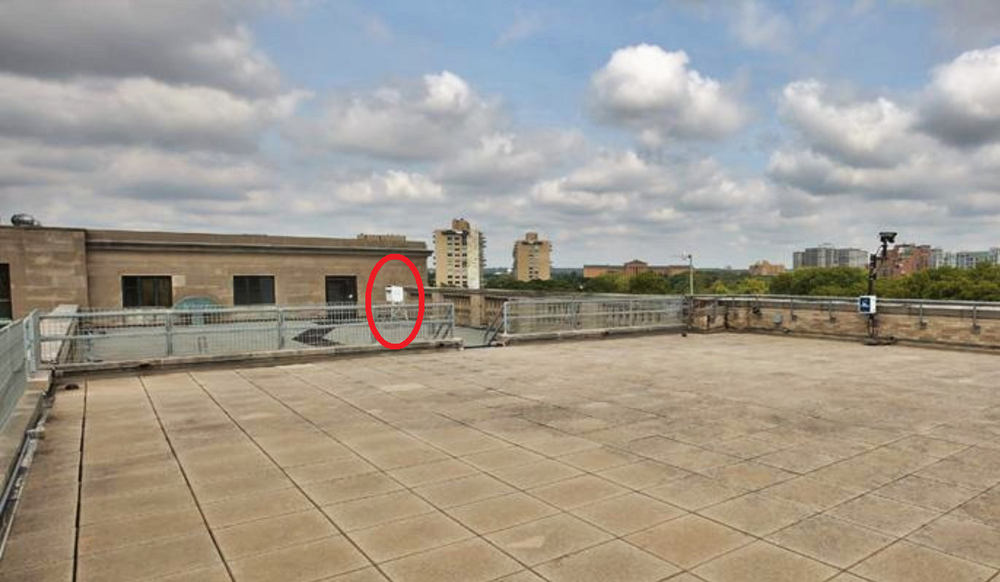
Officially Philadelphia, Wilmington, Trenton, Allentown & Reading have not recorded 100 degrees since 2012, same as Central Park. A # of locations listed above are known warm bias sites, take for instance the Franklin Institute. Pic of that rooftop instrument shelter is attached. Any wonder why that location would run warm LOL. Newark is a joke and has been addressed on multiple occasions by the NJ State Climatologist. NE Philly & SJ Regional have been running out of tolerance warm for years.
You clearly lack consistency & need to treat the warm bias rooftops, helicopter pads, an ASOS next to miles of runway asphalt & 12 lanes of traffic.....garbage sites with the same degree of scrutiny as you do with the supposed vegetation issues at Central Park.
 11 hours ago, BucksCO_PA said:
Officially Philadelphia, Wilmington, Trenton, Allentown & Reading have not recorded 100 degrees since 2012, same as Central Park. A # of locations listed above are known warm bias sites, take for instance the Franklin Institute. Pic of that rooftop instrument shelter is attached. Any wonder why that location would run warm LOL. Newark is a joke and has been addressed on multiple occasions by the NJ State Climatologist. NE Philly & SJ Regional have been running out of tolerance warm for years.
You clearly lack consistency & need to treat the warm bias rooftops, helicopter pads, an ASOS next to miles of runway asphalt & 12 lanes of traffic.....garbage sites with the same degree of scrutiny as you do with the supposed vegetation issues at Central Park.
You continue to mix apples and oranges in your comparisons. First, NYC is the only site in the region that is situated under shade trees and every other site gets direct sunlight. It’s well known that you don’t take temperatures under trees. Second, that Franklin institute rooftop site can run cooler than the street level sites as has been the case with the NYC micronet rooftop sites. Third, PHI runs cool since it’s situated in a swamp on the Delaware River at one of the widest points. Your argument about Newark holds no water since it’s actually been shown to run cooler than surrounding sites on days where it’s subject to sea breezes since it’s in a swampy area near the bay. Plus none of the sites other than NYC shows a summer high temperature cooling pattern while the minimums have been rising. So blocking solar radiation to any site with trees is going to taint your observations. Numerous sites have hit 100° around the region since 2012. The area approaching NE NJ is naturally warmer even if there was no urbanization due to a downsloping effect on a SW to W flow. While the temperature measurements from the 1930s were less reliable, the NJ state record was set in Runyon during the 1930s and is located in this warmer corridor. So no urbanization was needed. It’s naturally a warmer part of the region than areas further to the SW due to typography alone.
-
6
-
-
42 minutes ago, tmagan said:
If we can get through this summer without a 100 degree day, Central Park will set the record for most consecutive days without a maximum temperature of at least 100 degrees. Right now we are 318 days from setting the record and are at 4291 days as of yesterday without a 100 degree day.
They already have the record for not getting above 98° due to how thick the tree growth has become over the sensor.
Number of Consecutive Days Max Temperature <= 98
for NY CITY CENTRAL PARK, NY
Click column heading to sort ascending, click again to sort descending.RankRun LengthEnding DatePeriod of record: 1869-01-01 to 2024-04-17 1 4291 2024-04-17 2 4022 1977-07-17 3 3260 1894-06-24 4 2844 1911-07-02 5 2212 1917-07-30 6 1786 2010-07-04 7 1763 1988-07-09 8 1761 1962-05-18 9 1476 1923-07-19 10 1475 1948-08-25
Data for January 1, 2013 through April 18, 2024
Click column heading to sort ascending, click again to sort descending.StateNameStation TypeHighest Max TemperatureNJ NEWARK LIBERTY INTL AP WBAN 103 NJ HARRISON COOP 102 NJ CANOE BROOK COOP 101 NY LAGUARDIA AIRPORT WBAN 101 CT NORWICH PUBLIC UTILITY PLANT COOP 101 NJ CRANFORD COOP 100 NJ TETERBORO AIRPORT WBAN 100 NJ CALDWELL ESSEX COUNTY AP WBAN 100 NJ TETERBORO AIRPORT COOP 100 NY JFK INTERNATIONAL AIRPORT WBAN 100 NY SETAUKET STRONG COOP 100 NJ RINGWOOD COOP 99 NY WEST POINT COOP 99 NY WORLD TRADE CENTER WBAN 99 NY ISLIP-LI MACARTHUR AP WBAN 99 CT STAMFORD 5 N COOP 99 CT PUTNAM LAKE COOP 99 CT IGOR I SIKORSKY MEMORIAL AIRPORT WBAN 99 NY NY CITY CENTRAL PARK WBAN 98
Data for January 1, 2013 through April 18, 2024
Click column heading to sort ascending, click again to sort descending.StateNameStation TypeHighest Max TemperaturePA MARCUS HOOK COOP 103 PA NORRISTOWN COOP 102 PA PHOENIXVILLE 1 E COOP 101 NJ SOMERSET AIRPORT WBAN 101 NJ HIGHTSTOWN 2 W COOP 101 NJ FREEHOLD-MARLBORO COOP 101 NJ MANASQUAN 1 NW COOP 101 PA PHILADELPHIA FRANKLIN INSTITUTE COOP 101 NJ ATSION COOP 101 NJ SOUTH JERSEY REGIONAL AIRPORT WBAN 101 MD STEVENSVILLE 2SW COOP 100 DE GEORGETOWN-DELAWARE COASTAL AIRPORT WBAN 100 NJ WRIGHTSTOWN COOP 100 PA NORTHEAST PHILADELPHIA AIRPORT WBAN 100 NJ MARGATE COOP 100 NJ LONG BRANCH-OAKHURST COOP 100 NJ NEW BRUNSWICK 3 SE COOP 100 NJ ATLANTIC CITY INTL AP WBAN 100 MD ROYAL OAK 2 SSW COOP 99 PA READING REGIONAL AIRPORT WBAN 99 NJ CAPE MAY 2 NW COOP 99 NJ PENNSAUKEN 1N COOP 99 NJ POTTERSVILLE 2 NNW COOP 99 NJ FLEMINGTON 5 NNW COOP 99 NJ EB FORSYTHE NEW JERSEY RAWS 99 PA PHILADELPHIA INTL AP WBAN 99 NJ HAMMONTON 1 NE COOP 99 NJ ESTELL MANOR COOP 99 NJ PHILADELPHIA/MT. HOLLY WFO COOP 99
Data for January 1, 2013 through April 18, 2024
Click column heading to sort ascending, click again to sort descending.StateNameStation TypeHighest Max TemperatureCT COLEBROOK RIVER LAKE COOP 102 NY SARA NEW YORK RAWS 100 NY MELROSE 1 NE COOP 100 NY POUGHKEEPSIE AIRPORT WBAN 99 NY STONYKILL NEW YORK RAWS 99 NY ROSENDALE 2 E COOP 99 NY SCHOHARIE COOP 99 CT FALLS VILLAGE COOP 99 NY CAMBRIDGE COOP 99 CT THOMASTON DAM COOP 99 NY ALBANY INTERNATIONAL AIRPORT WBAN 99 -
2
-
-
11 minutes ago, SACRUS said:
Get that ridge more east of Hawaii . This April similar to '19
It’s really impressive how persistent the Canadian blocking has been since last spring. Figures it would mainly wait until the winter to link up the Southest ridge. The degree to which the blocking holds on will probably help to refine some of our summer weather details. While we usually have been very warm during El Niño to La Niña summer transitions, a continued wet pattern and more high pressure to the north could work to temper the heat potential somewhat.


-
2
-
1
-
-
47 minutes ago, SACRUS said:
currently looks like the chill shives south 4/25 - 4/27 in /out with some ridging pushing heights up behind it 4/29. Perhaos -10 below normal to a +10 in 48 hours - way out there.
The forecast beyond day 10 will probably come down to how strong the 50/50 low remains. The OP Euro maintains a stronger 50/50 with continued backdoor potential. We would want something closer to EPS to have a shot at more than a day or two warm up before getting backdoored again. The original day 10+ EPS underestimated the backdoor influence this week. So would want to see improvement show up under 168 hrs to have confidence that this pattern was going to relax.


-
3
-
-
Looks we have a shot at near the coldest 850mb temperatures on record near James Bay next week for late April. A -28C cold core at 850mb is pretty ridiculous this late in the season. Will be interesting to see how close this gets to the Northeast day 6-10. It’s possible that interior regions could see a hard freeze with 30s all the way to the coast. We probably won’t know for sure until we get under 120 hrs since pinning down exact polar vortex positions day 6-10 can be tricky.


-
3
-
2
-
-
Where was this pattern during the winter?


-
1
-
 1
1
-
1
-
-
5 minutes ago, BucksCO_PA said:
it most certainly is underrepresented when you limit to a specific hour that does not capture the full scope of the temp drop
It’s based on hourly reports which is what it was designed to do.
-
15 minutes ago, BucksCO_PA said:
Since you have "exactly" 48hrs as one of the data points the full scope of the 4/16-18 2003 temp drop is missed. Question would be how many others are underrepresented on that list?
4/16/2003, 4:00pm - 87 degrees
4/17/2003, 4:00am - 49 degrees
4/17/2003, 4:00pm - 40 degrees
4/18/2003, 4:00am - 37 degrees
The actual high at Newark on 4/16/2003 was 88 degrees so that's a 51 degree temp drop in less than 36 hrs.
There is no underrepresentation since it all depends on what time interval you use. Set it to 24 hrs and the April 2003 drop is the top one. Anytime you have an afternoon within 24-72 hours with a 30°+ difference it’s noteworthy.

-
1
-
-
1 hour ago, FPizz said:
It was mid-May. I was getting my pool opened, midday, and snow flakes were falling.
That one was in May 2020 but the one last May was equally as extreme for some locations.
https://www.nrcc.cornell.edu/regional/narrative/narrative.html
Northeast Overview - May 2023
Notable Weather Events
An upper-level low pressure system that had stalled near the region in late April finally meandered away during the first few days of May but continued to bring persistent below-normal temperatures and rounds of precipitation during that time. In fact, a rare May snow event occurred in some higher-elevation locations of West Virginia and southwestern Pennsylvania. The greatest storm snow total reached 20.3 inches in Davis, West Virginia, ranking as West Virginia’s largest May snowstorm and the snowiest May for any West Virginia site on record. Davis saw 10.1 inches of snow on May 3, ranking as the greatest daily snowfall for May for any West Virginia site. Meanwhile, Snowshoe, West Virginia, had its snowiest May since records began in 1975 with 16.0 inches and its snowiest May day with 7.0 inches on May 3. The site’s snow depth of 15 inches on May 4 was the greatest May snow depth on record for any West Virginia site. The event was also notable even at sites that saw less snowfall, such as Donegal, Pennsylvania, which had its snowiest May since records began in 1945 with 0.7 inches of snow. In addition, on May 1, a storm system associated with the upper-level low set record-low sea level pressures for May at least eight sites including Boston, Massachusetts; Williamsport, Pennsylvania; and New York City. Low temperatures on May 18 bottomed out in the 20s and 30s in multiple parts of the Northeast, running as much as 22 degrees F colder than normal. For instance, lows of 30 degrees F in Scranton, Pennsylvania, and 33 degrees F in Providence, Rhode Island, ranked among the 10 coldest low temperatures for May at those sites. After a mild April, some crops were ahead of schedule, leaving them particularly susceptible to the unusually cold temperatures. There was widespread frost/freeze damage to grape vines, particularly in central and eastern New York where early estimated losses of 70 to 100 percent of some grape varietals were reported at some vineyards. Early estimates indicate around a third of Massachusetts’ apple crop was damaged, while preliminary estimates from New Hampshire indicate damages to the state’s apple crop could exceed $1 million. Vermont officials reported severe damage to thousands of acres of crops, while Connecticut officials also have reported significant crop losses. The full extent of damage will take more time to assess.-
2
-


April 2024
in New York City Metro
Posted
The memorable cold combined with snow at times records since 09-10 have pretty much been one hit wonders. We haven’t seen a repeat of the June-July 2009 average high at Newark staying under 80°. Same goes for the record October snowstorm in 2011 all the way down to Central Park. The February 2015 -10 or lower departure looks safe also. Plus the first below zero in NYC during February 2015 since January 1994 also looks hard to beat for the month of February.