donsutherland1
-
Posts
23,763 -
Joined
Content Type
Profiles
Blogs
Forums
American Weather
Media Demo
Store
Gallery
Everything posted by donsutherland1
-
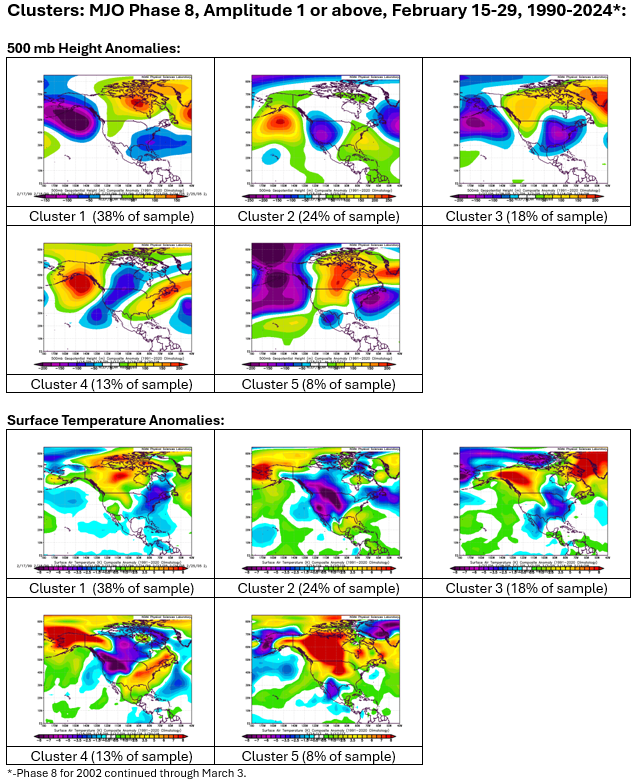
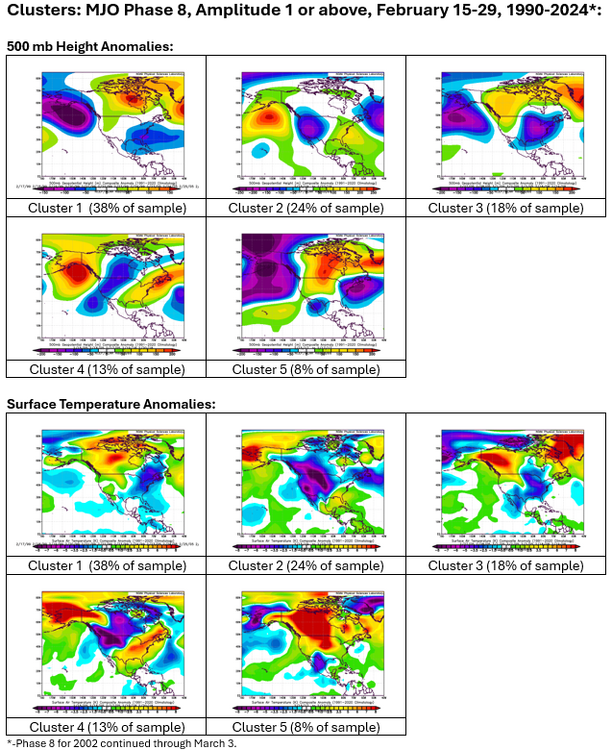
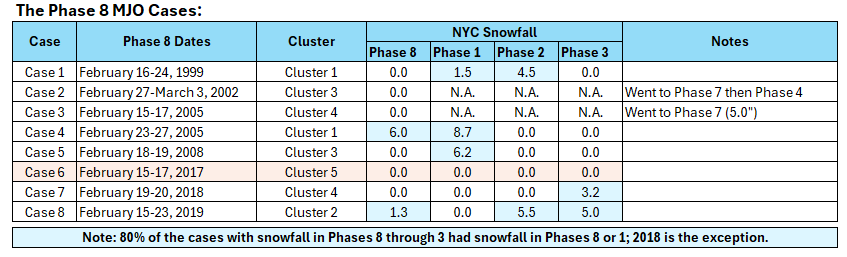
Given the discussion of the MJO, below is the experience for the second half of February when the MJO went into Phase 8 at an amplitude of 1 or above. The key takeaway is that should the MJO go into Phase 8 at a high amplitude (1 or above) during the second half of February, that would indicate that New York City had a good chance of seeing at least some additional measurable snowfall this winter (and likely in Phase 8 or Phase 1).
-
The massive increase in capability from quantum computing should, in theory, unleash numerous breakthroughs. Hopefully, quantum computing will advance to a stage where such work is possible this decade.
-
IMO, there are some building blocks for a SSW, but there is no guarantee that things will come together. Even if they do, how it would propagate and what impact that would have remains to be seen. Having said that, I would be surprised to see something of the magnitude of 2018, much less the sensible weather impacts of March into April 2018.
-
Not a torch, but a warmer than normal seasonal forecast.
-
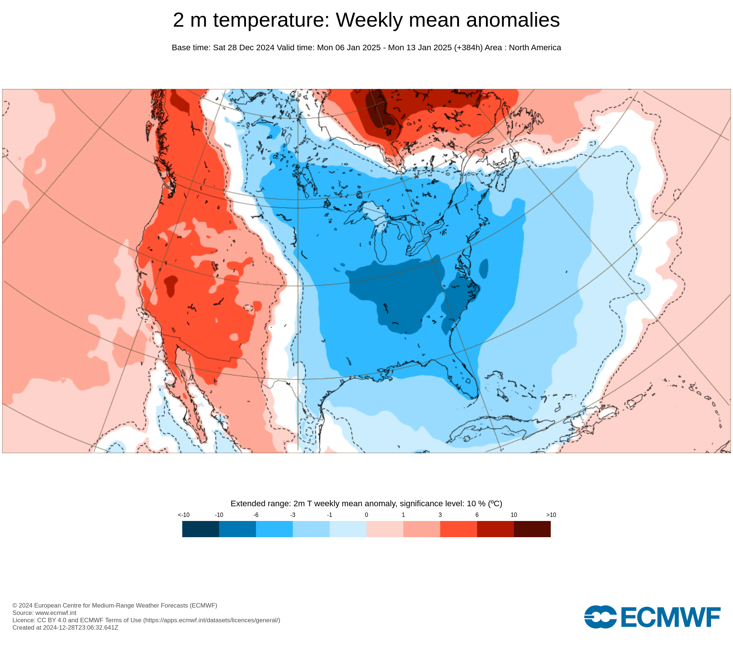
Model skill, including those I cited, is low that far out. As Eric Webb noted, there is no guarantee about the development of an NAO-. Previously, the ECMWF weeklies had near normal temperatures for Weeks 3 and 4. That changed with yesterday's run. Having said that, I believe the CFSv2 is overdone with the warmth (3°C-4°C/5.4°F-7.2°F above normal in the New York City area). My assumption is based on the continuation of an EPO- pattern that would allow some intrusions of colder air and greater reliance on the ECMWF weeklies. All said don't think this will be a "torch" February (monthly mean temperature of 40° or above), but see it coming out clearly on the warm side of normal. Indeed, the overperformance of the warmth this few days in January (including the outbreak of record warmth in the Upper Midwest/Great Lakes) shows how things can break much warmer when conditions allow.
-
Simon Lee's findings are interesting. The reality is that stratospheric warming events remain relatively poorly understood even today, making modeling challenging. Heat fluxes from wave 1 and wave 2 have an impact. However, which specific wave will trigger a stratospheric warming event--especially a major one--remains elusive. Is something else involved e.g., preconditioning? At present, one finds many "false alarms" and also some "misses" (the type Simon Lee has identified). Hopefully, machine learning will lead to improvement when it comes to the development of such events and, probably just as importantly, their propagation and impact on the polar vortex (displacement, stretch, split).
-
February DCA _ NYC _ BOS __ ORD _ ATL _ IAH __ DEN _ PHX _ SEA 3.2 3.0 2.5 2.5 5.2 4.5 1.8 0.5 -4.5
-
I suspect that the still strengthening La Niña is driving a divergence in the long-range guidance. The CFSv2 is very warm for Weeks 3 and 4. The ECMWF weeklies have gone warm for that timeframe, as well, though not as warm as the CFSv2 is. All said, I think February will wind up warmer than normal in much of the East. However, I don't think it will be so warm that it will deprive the region of an overall colder than normal winter.
-
Parts of the Great Lakes region saw exceptional warmth today. Some highlights: Green Bay: 53° (old record: 42°, 1989) La Crosse: 58° (old record: 48°, 1890 and 1931) ***New January monthly record*** Madison: 57° (old record: 47°, 1974) Milwaukee: 56° (old record: 53°, 1988) Minneapolis: 52° (old record: 48°, 1879 and 1989) Prairie du Chien: 60° (old record: 52°, 1903) Rochester, MN: 56° (old record: 48°, 1919) Waupaca: 56° (old record: 47°, 1974) Some of this warm air will sweep into the Northeast tomorrow. As a result, January will end with a rebound in temperatures. New York City will see temperatures reach the lower and middle 40s. Farther south, Washington, D.C. could have a high in the middle or perhaps upper 50s. Rain will also develop. New York City and Philadelphia will likely see a general 0.25"-0.75" rainfall. Upstate New York State and northern New England could see snow and ice. January 2025 is on course to become New York City's coldest January since January 2022. January 2022 had a mean temperature of 30.3°. January 2022 was far snowier with 15.3" monthly snowfall in New York City vs. 2025's 3.0". In contrast, January 2024 (2.3") and January 2023 (Trace) saw even less snowfall than January 2025. In fact, five of the six past years have seen less snowfall in New York City than January 2025. The first few days of February will see cooler readings, but moderation will follow after the coming weekend. The AO is now positive and is expected to remain predominantly positive through at least the first week of February. As a result, prospects for a 6" or above snowstorm in the New York City area will be limited. Since 1950, just 2 of 19 (11%) of storms with an AO of +2.000 or above during January 15-February 15 saw 6" or more of snow in New York City. Opportunities for a 6" or above snowstorm could persist for parts of southern New England, including Boston, through the first week of February. There is substantial uncertainty concerning the AO following the first week of February. The spread among ensemble members is currently a remarkable 8 sigma. The ENSO Region 1+2 anomaly was -0.4°C and the Region 3.4 anomaly was -0.9°C for the week centered around January 22. For the past six weeks, the ENSO Region 1+2 anomaly has averaged -0.08°C and the ENSO Region 3.4 anomaly has averaged -0.80°C. La Niña conditions are underway and will likely persist into the start of spring. The SOI was +11.83 yesterday. The preliminary Arctic Oscillation (AO) was +0.425 today. Based on sensitivity analysis applied to the latest guidance, there is an implied near 100% probability that New York City will have a colder than normal January (1991-2020 normal). January will likely finish with a mean temperature near 31.0° (2.9° below normal).
-
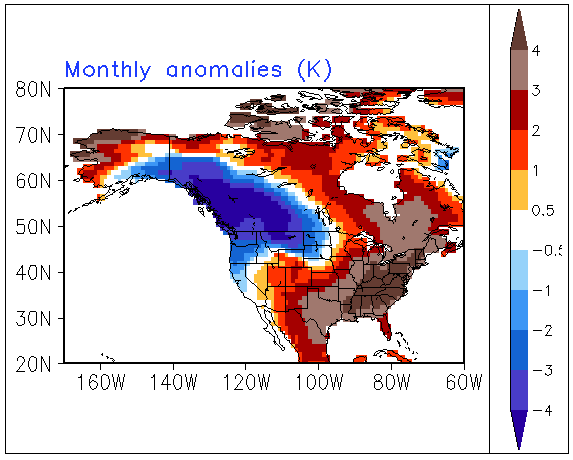
Parts of the Northwest Territories and northern Saskatchewan are near or below -40.
-
I believe it was Eric. I will have to look through the statistics to see what I have. I don’t recall any connection to the following winter.
-
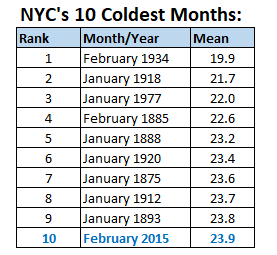
Only February 2015 would have made the top 10 list.
-
Ahead of a cold front, the temperature surged across the Middle region. High temperatures included: Atlantic City: 57° Baltimore: 58° Bridgeport: 52° Islip: 53° New York City-Central Park: 52° New York City-JFK Airport: 55° New York City-LaGuardia Airport: 53° Newark: 54° Philadelphia: 53° Washington, DC: 64° A cold front crossed the region this afternoon. The frontal passage was followed by winds that gusted past 40 mph in much of the region. In the wake of the front, it will turn briefly colder, but the coldest anomalies will occur across Upstate New York and New England. Moreover, the cold won't rival that of last week. Although the cold air mass has origins in northern Russia, that region has been experienccing near record and record warmth. As a result, the air mass is not exceptionally cold. January will likely end with a rebound in temperatures and rain developing across the Middle Atlantic region on Friday morning. New York City and Philadelphia could pick up 0.50" or more. Upstate New York State and northern New England could see snow and ice. January 2025 is on course to become New York City's coldest January since January 2022. January 2022 had a mean temperature of 30.3°. January 2022 was far snowier with 15.3" monthly snowfall in New York City vs. 2025's 3.0". In contrast, January 2024 (2.3") and January 2023 (Trace) saw even less snowfall than January 2025. In fact, five of the six past years have seen less snowfall in New York City than January 2025. The AO is now positive and is expected to remain predominantly positive through at least the first week of February. As a result, prospects for a 6" or above snowstorm in the New York City area will be limited. Since 1950, just 2 of 19 (11%) of storms with an AO of +2.000 or above during January 15-February 15 saw 6" or more of snow in New York City. Opportunities for a 6" or above snowstorm could persist for parts of southern New England, including Boston, through the first week of February. There is substantial uncertainty concerning the AO following the first week of February. The spread among ensemble members is currently a remarkable 8 sigma. The ENSO Region 1+2 anomaly was -0.4°C and the Region 3.4 anomaly was -0.9°C for the week centered around January 22. For the past six weeks, the ENSO Region 1+2 anomaly has averaged -0.08°C and the ENSO Region 3.4 anomaly has averaged -0.80°C. La Niña conditions are underway and will likely persist into the start of spring. The SOI was +14.28 yesterday. The preliminary Arctic Oscillation (AO) was +0.549 today. Based on sensitivity analysis applied to the latest guidance, there is an implied near 100% probability that New York City will have a colder than normal January (1991-2020 normal). January will likely finish with a mean temperature near 30.9° (3.0° below normal).
-
Central Park has reached 50° for the first time since January 1st. The last time January had just two 50° days was in 2010. Last year, there were 11 such days in January.
-
With Savannah, the sample size would be too small. Since 1950, there were 3 years with 3" or above snowstorms. Only one of those storms occurred during a La Niña winter.
-
I included it to provide some insight into La Niña cases where the storm track was suppressed for a portion of the winter.
-
I believe the recent cloud-related evidence essentially eliminates the lingering notions that cloud feedbacks would be negative, reaffirms research done by Tierney et al., and that cloud feedbacks can lead to higher climate sensitivity for a doubling of CO2. Moreover, cloud feedbacks seem to be a more robust explanation than aerosol reduction for the modest but real increase in the rate of warming that has been observed. It's uncertain how cloud feedbacks have contributed to the persistence of the warmth since the onset of La Niña. January 2025 will very likely become the warmest January on record globally despite the ongoing La Niña event.
-
I don't think so. Models are often off by the timing until events draw closer. I don't have a hypothesis to explain the timing difference, as numerous variables are involved. It's not as as straight-forward as, in this case, the modeling of the air mass appears to have been.
-
At the time, the guidance suggested that the closing days of January would be much colder than they will be. The guidance had the air mass originating in northern Russia, which appears on course to verify. But my hypothesis is that the guidance didn't adequately consider that the air mass was actually producing record warmth in that area and wouldn't be exceptionally cold. As the event drew closer, the guidance adjusted temperatures, but remained essentially unchanged with regard to the origin of the air mass. That's why I believe the initial runs didn't adequately consider that the air mass was an unusually warm one from that part of the world.
-
It was intense, but nowhere near the duration of the one in 2020 (essentially a six-month heatwave).
-
That's a global temperature. Numerous parts of the world have been experiencing exceptional heat. Indeed, the cold air mass moving into the NYC area for tomorrow originated in northern Russia. Normally, it would be frigid, but that area has been seeing record warmth, so the cold won't be severe when it gets here.
-
Winter 1895-96.
-
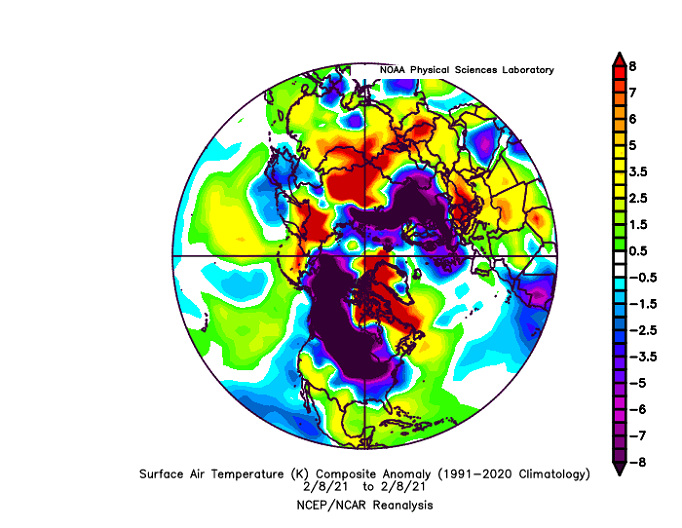
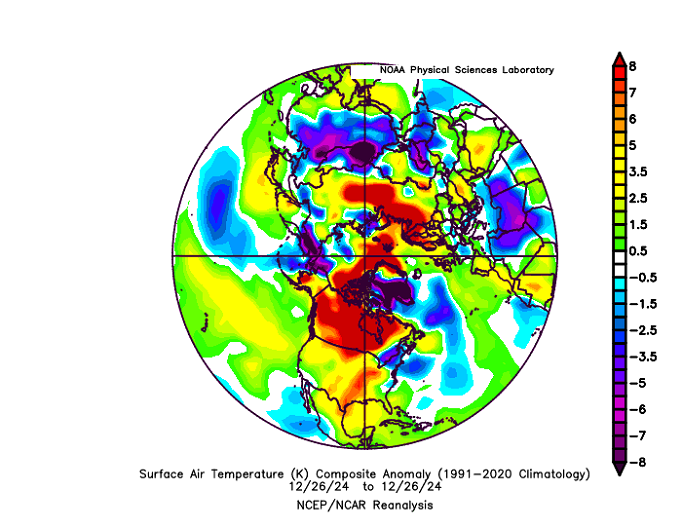
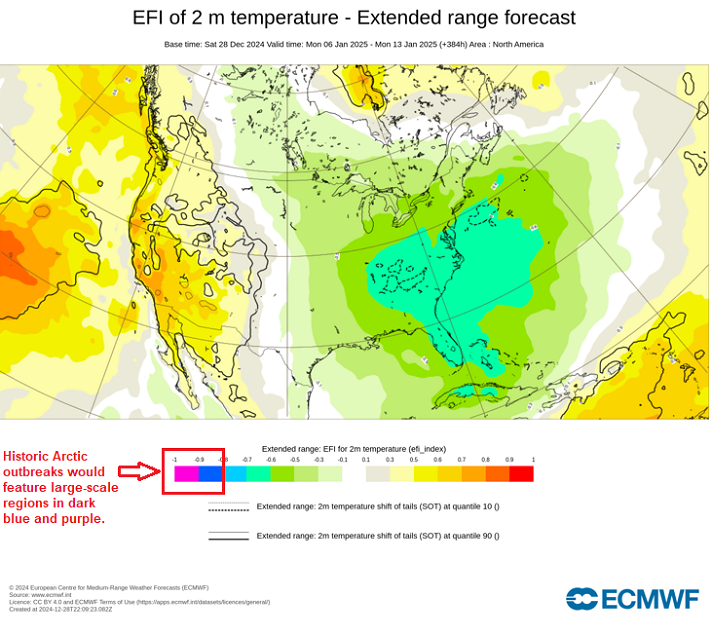
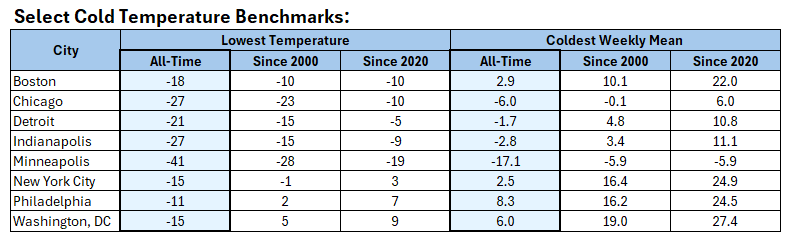
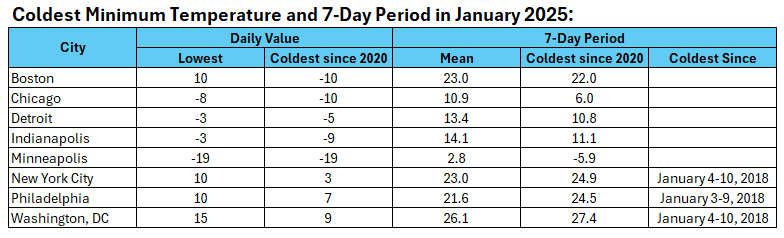
Verification: Here's what actually happened. None of the cities had their coldest temperature or coldest 7-day period since 2000. Most of the cities didn't even have their coldest low temperature or coldest 7-day period of the 2020s. Historic cold did not materialize in the area outlined.

-
Temperatures rose into the 40s across the Middle Atlantic Region today. Baltimore and Washington, DC topped out at 50° and 54° respectively. The mild weather will likely continue through tomorrow before another cold front arrives. The front could be accompanied by some snow flurries. Behind the front, it will turn briefly colder, but the coldest anomalies will occur across Upstate New York and New England. The cold won't rival that of last week. Although the cold air mass will originate in northern Russia, that region has been experienccing near record and record warmth. As a result, the air mass will not be exceptionally cold when it reaches eastern North America. January will likely end with a rebound in temperatures and rain developing across the Middle Atlantic region. New York City and Philadelphia could pick up 0.50" or more. Upstate New York State and northern New England could see snow and ice. The AO is now positive and is expected to remain predominantly positive through at least the first week of February. As a result, prospects for a 6" or above snowstorm in the New York City area will be limited. Since 1950, just 2 of 19 (11%) of storms with an AO of +2.000 or above during January 15-February 15 saw 6" or more of snow in New York City. Opportunities for a 6" or above snowstorm could persist for parts of southern New England, including Boston, through the first week of February. The ENSO Region 1+2 anomaly was -0.4°C and the Region 3.4 anomaly was -0.9°C for the week centered around January 22. For the past six weeks, the ENSO Region 1+2 anomaly has averaged -0.08°C and the ENSO Region 3.4 anomaly has averaged -0.80°C. La Niña conditions are underway and will likely persist into the start of spring. The SOI was +14.28 today. The preliminary Arctic Oscillation (AO) was +1.847 today. Based on sensitivity analysis applied to the latest guidance, there is an implied near 100% probability that New York City will have a colder than normal January (1991-2020 normal). January will likely finish with a mean temperature near 30.7° (3.2° below normal).
-
The warmest January is very likely. Currently, 2025 is running 0.14C ahead of 2024. That edge will be very difficult to erase with the five remaining days (on ERA-5).