

WxUSAF
-
Posts
24,679 -
Joined
-
Last visited
Content Type
Profiles
Blogs
Forums
American Weather
Media Demo
Store
Gallery
Posts posted by WxUSAF
-
-
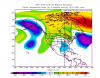
Here's a nice reference for the upper air pattern when a KU is about to happen:
-
^that was the greatest quake meme ever
-
Speaking of CAPE and following up about the skew-T discussion, the amount of CAPE can be directly calculated from the skew-T by adding up the area between the parcel trajectory (along a moist adiabat) and the environmental temperature profile. So, if there's a lot of room between the two, you can know the CAPE is high before looking at the calculated parameters directly.
The "opposite" of CAPE is CIN (convective inhibition) and is also measured in J/kg. CIN occurs when the parcel trajectory will lead it to be colder than the environmental temperature. If the parcel is colder, it's not buoyant in the free atmosphere and needs to be forced to a height in the atmosphere where it is bouyant before it can freely begin to rise. When people speak of a "cap", there means the atmospheric profile has a certain amount of CIN to overcome.
-
When lows vertically stack it signals the occlusion process happening and the ceasing of much further strengthening.
Bingo.
-
"Vort" refers to vorticity maximum. Vorticity is a measurement of spin in the atmosphere, where positive vorticity refers to counter-clockwise rotation, which in the northern hemisphere, is associated with cyclonic storms. In strict mathematical terms, it is the curl of the velocity vector. Associated with that, an important quanity is "positive vorticity advection (PVA)". Areas experiencing PVA are having the vorticity increase overhead, and that is associated with upward vertical motion and can encourage cyclogenesis. The "X" on a 500mb vorticity chart usually is the location of maximum vorticity within a trough.
"Shortwave" (sometimes abbreviated "s/w") is short for "shortwave trough", which I think is also your reference to "trough". However, shortwave troughs are distinct from LONGwave troughs. Shortwaves are embedded in a broader longwave pattern. When people say "we want a trough in the east for cold weather", they are referring to a longwave trough. Shortwaves are associated with positive vorticity maxima (in the northern hemisphere), so many times those 3 words you referenced are used interchangeably even if they technically mean different things. Shortwaves are often associated with baroclinicity (a potentially unstable difference in temperature) and thus can be associated with cyclogenesis and/or thunderstorm development.
-
I see dtk replying, so I hope he fields the verification score question since I'm not going to.
I think the SREFs have some value inside of 72 hours and certainly inside 48. I really enjoy looking at the plume charts to get a sense of the spread and clusters of the different solutions.
The NAM certainly struck out this weekend, but I'm certainly not as down on it as zwyts and Ian. Much of my forecasting in the AF was very short-range, so perhaps I just didn't notice if/when the NAM blew a 72 or 48 hour forecast. But it always did pretty well for me, and indeed, we were obligated to use it unless it was really REALLY out to lunch.
I use Raleighwx's website for most of my model analysis, but I don't have a favorites menu full of wx links like many on here.
I wouldn't worry about GGEM ensembles. The GGEM doesn't go out to 10 days on its home website, so I wouldn't bother looking for it even if it exists.
-
Guide to the gray lines:
Solid lines that slant upward and to the right from the surface are temperature--> hence the "skew" of skew-T
Solid lines parallel to the bottom are pressure levels
Solid curved lines that curve upward and to the left are dry adiabats
Dashed curved lines that curve upward and then slightly bend left are moist adiabats
Dotted straight lines that slant upward and right are water vapor mixing ratios
-


Best ever

-
Biggest facepalm moment so far...a met on WTOP radio saying that a 2.8 magnitude aftershock was "half as strong" as the 5.8 primary quake.

The Richter scale is LOGARITHMIC. A 2.8 is 1000 times weaker than a 5.8.

-
I presume that's preliminary? I note it's described as "poorly constrained," but have no idea what that means.
It's the 3rd update to the depth I've seen...but they've all said "poorly constrained". First depth was ~4km (can't remember exactly), then 1km, and now 0.1km.
-
I see folks using the word "violent" a lot.
That's actually a semi-technical term with a specific meaning-- i.e., that the quake produced MM IX shaking or higher. Usually in violent shaking, you have kitchen cupboards and refrigerators flying open and emptying and buildings collapsing and things like that. I don't think this quake produced violent shaking.
Here's an entry about the MM scale: http://en.wikipedia....intensity_scale
Thanks for the link, Josh! Wish I had that before I sent my report in to USGS. I said "Moderate" in my report, but based on that, it was "Rather Strong" or possibly even "Strong". My exact thought was that it felt like a freight train was speeding by my office.
-
Updated depth...0.1 km!!

-
Bethesda...how many downed trees, broken water mains, collapsed buildings and fatalties in your area?
-
Not sure where people are getting 6.0 magnitudes from. Still says 5.9 on USGS.
-
Was two distinct periods here. First one was relatively minor, then a pause for a few seconds, then stronger shaking (made my computer screen shake). Are those the p and s waves? Or vice versa?
-
Holy sh!t!!!!!! 5.8 magnitude!!!!!!!!!!!!!!!!!
http://earthquake.usgs.gov/earthquakes/recenteqsww/Quakes/quakes_all.html
-
Jesus fu*king Christ!!!!!


Our region's extreme run
in Mid Atlantic
Posted
Wow…62F is the record. Lowest record high max of the entire month and only set 2 years ago! That's a gimmee. IAD's record is 61F, also set in 2011. Both of those are probably locks. DCA is 68F. That's going to be close.