

weatherwiz
-
Posts
71,159 -
Joined
-
Last visited
Content Type
Profiles
Blogs
Forums
American Weather
Media Demo
Store
Gallery
Posts posted by weatherwiz
-
-
Just now, WinterWolf said:
Bro..just drive in the snow and save yourself some dough...it’ll be pedestrian at best here.
my job would pay for the room. I would probably pay one night though (tonight ) and have them cover tomorrow night. The motel 6 up the street is only about $60/night.
My main issue is I have to leave about 4:45 AM...probably earlier given roads and if we do get measurable snow at BDL and anything ices up...I'm not sure when our association does snow removal.
-
Just now, Hoth said:
Fire up the Countdown to May thread?
If we go through December without anything that will be fired up
-
Hell...at this point I'm even debating whether I should just go back to BDL and not even get a hotel room. Although...I was more worried about what happens tomorrow into Monday.
-
Well the CCB tries to crank briefly here but that dry slot is racing in.
It's not even December yet and I'm already tired of winter
-
 7
7
-
-
2 minutes ago, CTWeatherFreak said:
How bout the way its got the surface jumping around .. Does this make meteorological sense?


It's possible though something like that may be related to contouring or something...I doubt (or would hope anyways) that this wouldn't really impact the output of the model at all.
Since it's more of an elongated low it's probably just picking coordinates where pressure is lowest (????)
-
 1
1
-
-
3 minutes ago, WinterWolf said:
Ya A snow/subsidence Hole is one thing....but the whole State of CT? While the Hudson valley to our west, and NYC to our SW, and NJ to our SW. and western Mass to our north, and Boston to our NE all get whaled? That just seems like the ultimate cosmic Dildo for an entire State-not just a 10 -15 mile Snow hole. I mean absolutely everything would have to go wrong for that to ever happen..everything. And that’s as rare as needing everything To go absolutely right.
Even in Boxing Day I did ok relatively speaking with that mess..just never got into the absolute crazy stuff(after being forecasted to) and ended up with about a foot. But this is showing practically nothing for the whole state of CT From rnd 2?? I just don’t buy it with so much uncertainty on the second round.
I don't think it can be totally discounted if such an intense materialized...there would be some serious subsidence and with dry air involved and no lift...going to be tough to generate precip.
Anyways...let's not forget this front end...we could do extremely well with that. Look at the NAMNEST (18z) for BDL...that's some serious lift into the DZG prior to the flip.

-
Just now, RUNNAWAYICEBERG said:
Euro was prolonged too. We’ll see if we can was it away next few cycles.
Thankfully we are still like ~40 hours away from when this second part materializes so there is still plenty of wiggle room. If everything continues to align in this direction though with overnight guidance it will be extremely concerning.
-
1 minute ago, RUNNAWAYICEBERG said:
Yup and it’s not just the nam showing dry air either.
Certainly buy the dry slot...just not sure to this extent.
-
1
-
-
Just now, dendrite said:
Where do you calculate the greatest omega to be?
just N or NW of the lows...which on cod it didn't really appear that way.
Look at the 700VV on Cod...has the strongest within the 282m contour.
Anyways I think its more of a contour thing...looks like cod does every 3m and TT does every 4m...so adding in an extra contour on Cod I suppose it's fine.
But regarding the posts about the snow hole in CT...CT sucks on serious subsidence/dry air on the NAM
-
1 minute ago, OceanStWx said:
I definitely agree that was a real warm outlier, but I did want to highlight one nice thing about the 3km NAM. It explicitly forecasts snow ratios based on hydrometeor type. Snow ratios change according to the rime factor. The higher the rime factor the close to pure sleet you are getting.
This example from the latest 3 km shows reflectivity and rime factor. Over NNE there is reflectivity but no rime factor (=pure snow). As you move SW you get more and more riming.
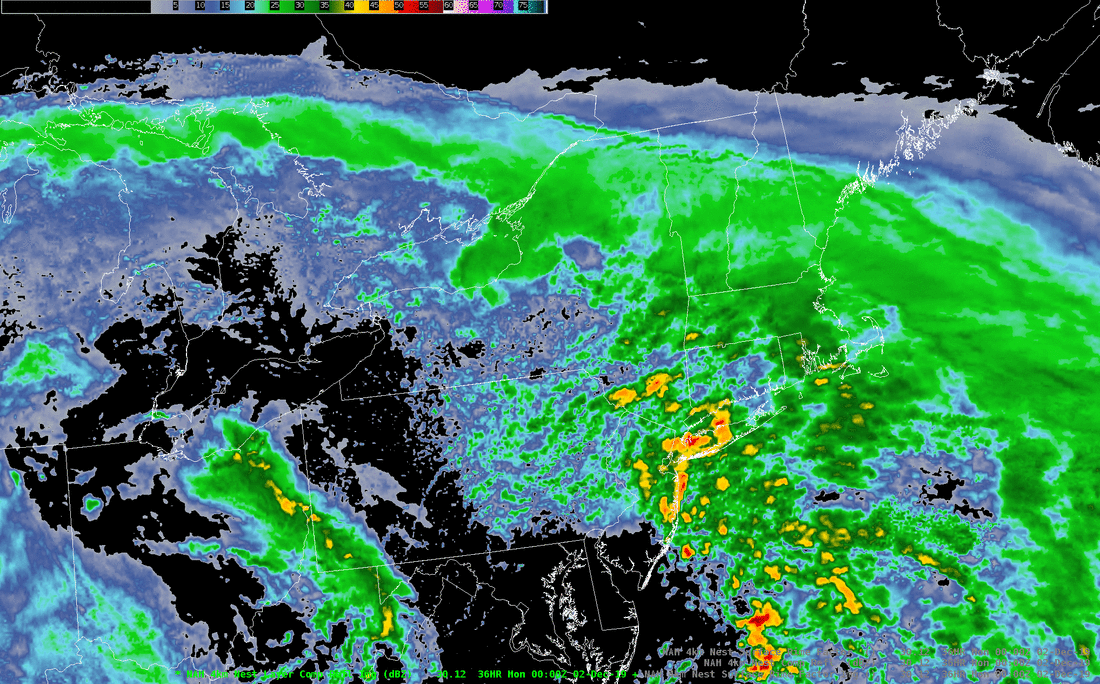
> 5 rime factor (cyan into the warm colors) is typically graupel and sleet. The NAM will use snow ratios anywhere from 5:1 for graupel down to 2:1 for sleet. Between the no riming and factor of 5 you get ratios from 3:1 to 8:1. It definitely produces a more realistic looking snowfall map in situations where mixing is forecast to occur.
Is rime factor only available in AWIPS?
-
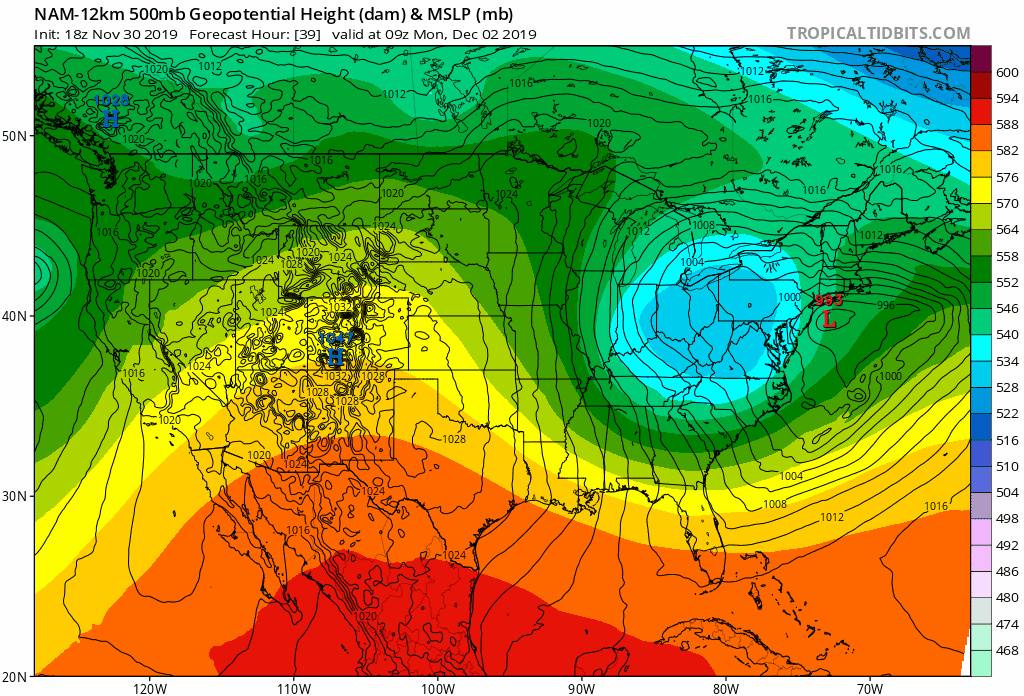
The NAM seems extremely bizarre on just all levels...especially with the VV's
-
1
-
-
1 minute ago, Ginx snewx said:
There have been 9 years out of 123 with 6 inches or more in Hfd area between 10 1 and 12 3
CT also only had 4 October tornadoes and none since 1979...then last October happened
")
what would be curious to know is how many potential events we have had over those years in that time frame.
I chalk this one up to "Don't count your chickens before they sh*t" category...surprises ranging from both sides of the spectrum with this one
-
3 minutes ago, Hoth said:
I blame Gov. Lamont.
probably has a snow tax in place so snow will just go around the state

-
2
-
-
Made some slight adjustments...shifted the 2-4'' zone farther north into southern CT and trimmed the 8-12'' range back a bit. Almost kinda wishing i kept my initial map which was I think 1-3'' immediate shoreline and 3-6'' inland...then added a zone of like 6-10'' where I have the 8-12''...oh well.

-
 2
2
-
1
-
 1
1
-
-
51 minutes ago, ORH_wxman said:
Clown maps didn't even exist yet when I started forecasting. They aren't needed...using QPF and then massaging it based on the other features like midlevels and thermal profiles will get you where you need to be. 10 to 1 isn't a bad place to start but often you need to cut back on the qpf itself...once in a while you adjust upward of it's a really nice midlevel magic look.
IMO these maps are the primary reason for busted forecasts and I think they're hurting the meteorological community. They got tossed around left and right, the general public gets whiff of them and all hell breaks loose from there. I don't think they're 100% invaluable...they can certainly provide some insight as to where accumulating snow is more likely and perhaps they can pick up on mesoscale features like downslope.
12 minutes ago, Ginx snewx said:This has been my go to. You can adjust ratios too
http://www.meteor.iastate.edu/~ckarsten/bufkit/data/retro_map.html
I love that about bufkit! It's an incredible tool and very useful b/c if you have a storm where ratios vary you can gauge where to apply higher/lower ratios.
-
10 minutes ago, ORH_wxman said:
Just the tropical tidbits maps. Most of the others are smart enough to exclude sleet. But they should still be taken with a grain of salt.
Well that's good to know.
10 minutes ago, moneypitmike said:Just use the precipitation maps. Somewhat more reliable, just not as fun or pretty.
true
When I first starting taking stabs at snowfall forecasting I use to just estimate a ratio and see what the precip maps were showing for QPF and bang out some math...worked once in a while lol
-
Just now, dendrite said:
Where have you been the last 3 years?
I only use them to just gather an illustration of the area where snow accumulations are possible...its just a glancing look too. Other than this I don't pay attention to them and just look past them whenever I see them on social media or anywhere
-
1
-
-
Wait a second...do all snow maps account for sleet in the algorithms? No wonder why they're always spitting out insane totals

You can't incorporate sleet into an algorithm using a fixed ratio...especially a ratio that high.
-
 2
2
-
-
Just now, ORH_wxman said:
Best stuff on RGEM for CCB looks like NH and NE MA. Though it does have some stuff in CT but It's mostly western CT and then up into far W MA and NY st. Central and eastern CT kind of end up in a hole.
Gotcha...sort of seems similar to what the GFS would indicate? Just looking at mlvls on the GFS that's something I can envision happening.
-
^^^Now that makes more sense
-
Is the RGEM doing anything with the CCB? Based on the structure of that snow map my guess it isn't...Unless it does have it but it is not bringing it into CT and has it traversing west to east across MA.
-
Just now, moneypitmike said:
Agreed. It's a hellacious dryslot in this. Beware the dryslot.
The dry slot will screw someone...but I would think it's only temporary.
-
1
-
-
It may rip in the NW Hills Monday evening per the GFS...pretty damn good soundings with some great lift.
-
This is one of the more bizarre thermal profile modelings I can remember. Do models take into account latent heat release at all? I know sneaky warm layers aren't uncommon but some of what's being modeled is a little head scratching

Monday 12/2 Threat Disco
in New England
Posted
Better idea...
I'm going to go to Danbury and party tonight. The NAM and GFS have me visually upset...I am angered. I'm so sick of this crap.
If things trend back to the other direction I can always come to Branford in the AM.