

OSUmetstud
-
Posts
16,433 -
Joined
-
Last visited
Content Type
Profiles
Blogs
Forums
American Weather
Media Demo
Store
Gallery
Posts posted by OSUmetstud
-
-
21 hours ago, MJOatleast7 said:
yup

-
6 hours ago, CNY-LES FREAK said:
So another words Nick Novembers a torch and Decembers the transition period into real Winter. I'll buy that, since that start of Met Winter ain't until Dec 1 anyways.
This is real real early, it's almost like expecting a good system in April, lol, and who.wants that, certainly not me, lol.
Sent from my SM-G930V using Tapatalk
I didn't say that anywhere.
-
16 minutes ago, BuffaloWeather said:
So calling for average November, above average December, and below average Jan-March?
Basically.
-
12 minutes ago, rochesterdave said:
Buffalo's 7 ft in mid November 2014 says hello.
But el Nino as a whole is not great for western ny, unless it's weak, then there's been some good ones.
-
16 hours ago, CNY-LES FREAK said:
I seriously dont quite understand that new probability map cause of AK does in fact, get that warm over the top, then we get cold, simple as that. That map is also showing me that there will be many chances for precip as their will be a stormy zone between the 2 airmasses so this really isnt that bad!
Sent from my SM-G930V using Tapatalk
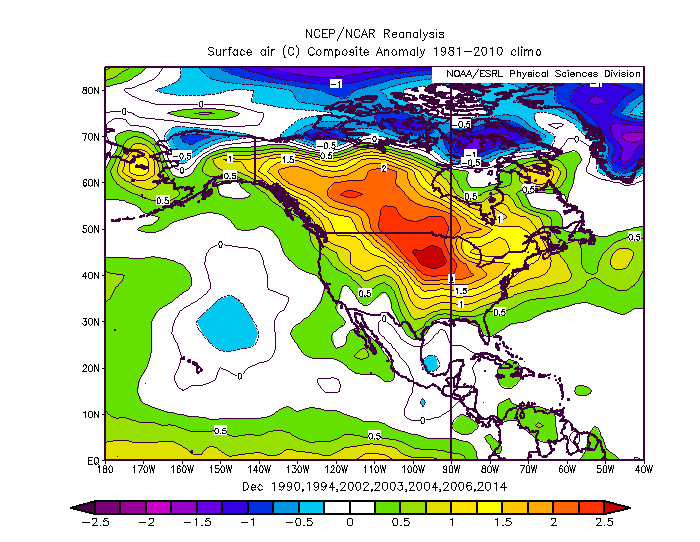
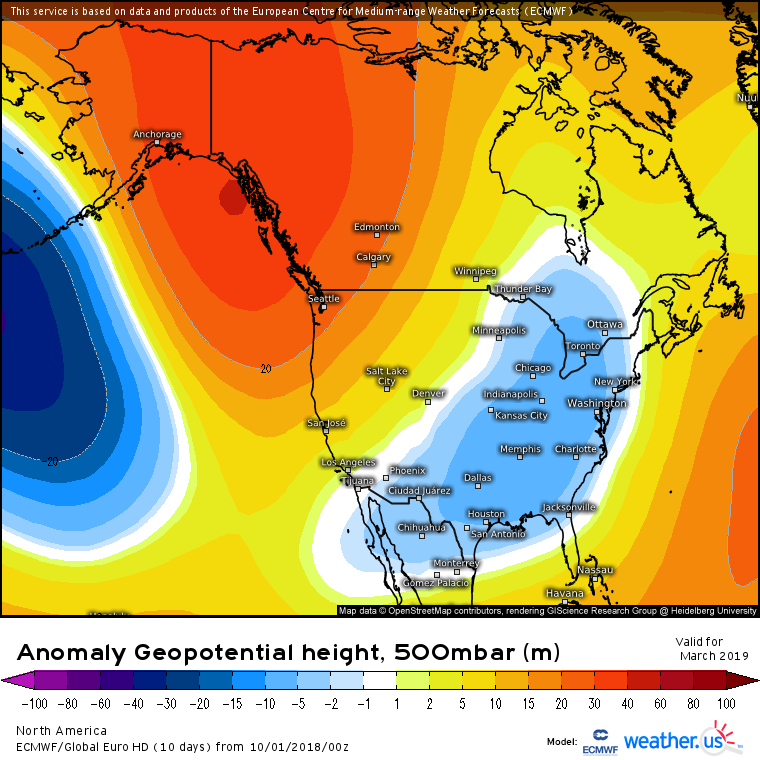
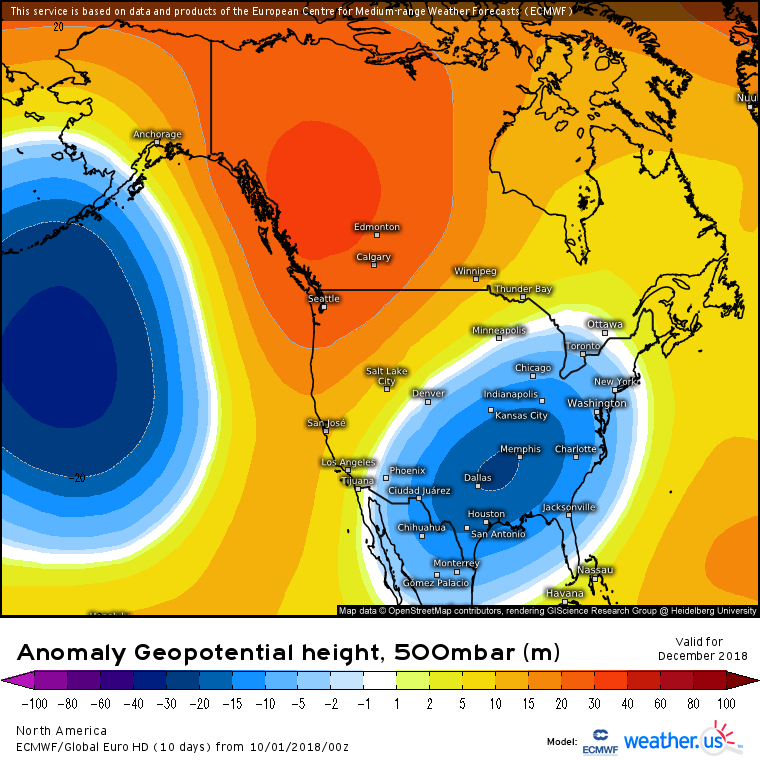
This isn't exactly true. Sometimes in El Nino years the PAC flow can invade AK and Canada so that theres warmth across much of the northern tier. November and December wave lengths are shorter than Jan Feb and March. This is my analog set for December, for example:
Considerable improvement in Jan through March as the north PAC low sinks south towards Hawaii.
.png.f6286855c5b00a568aeeaf53e1aa4f42.png)
-
 3
3
-
-
15 minutes ago, BuffaloWeather said:
That's really interesting, I figured it would be the opposite.
Yeah its a bit counterintuitive in some respects. Its just that the "stakes" are higher in the winter and the sensible impacts to a poor forecast tend to be larger.
-
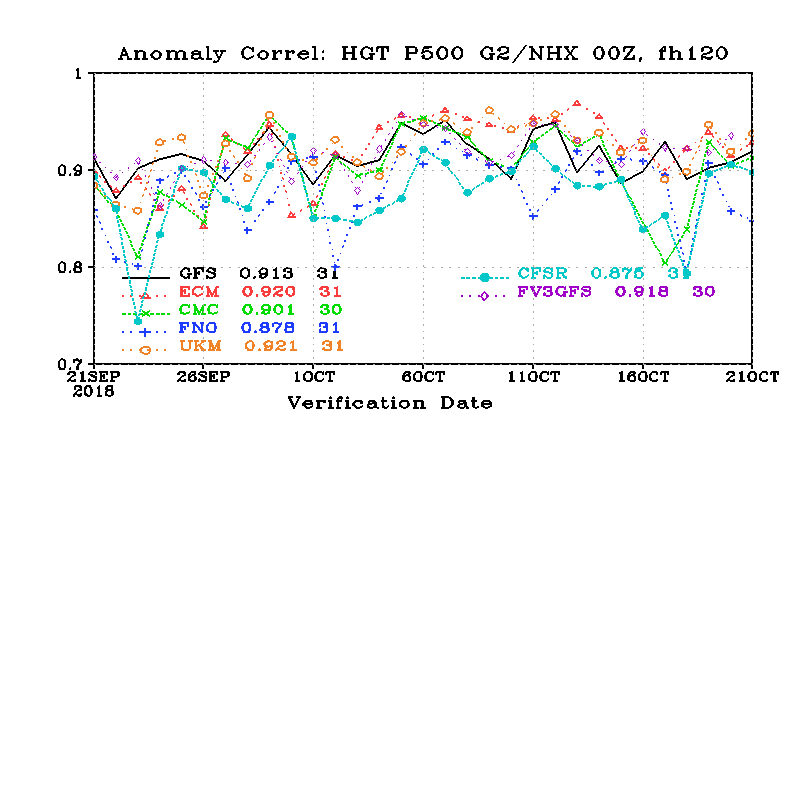
18 minutes ago, CNY-LES FREAK said:
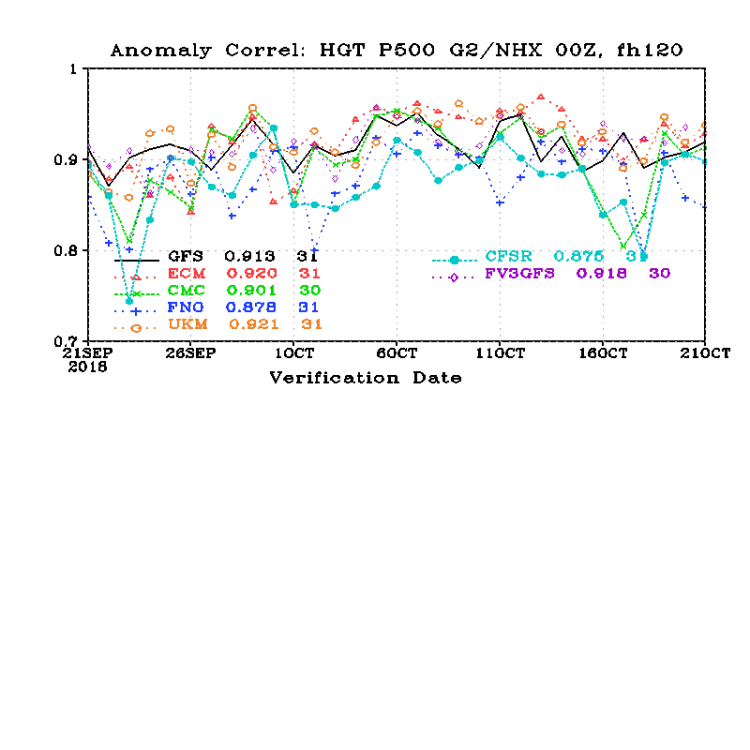
I gotta say, also judging from that graph that the UkMet is actually out performing the Euro, no, interesting.
Sent from my SM-G930V using Tapatalk
Yes. For a single month. Overall ecmwf does just a bit better.
-
1 minute ago, BuffaloWeather said:
Is that percentage abnormally high? 90%+ or around the norm?
Yep. Its anomaly correlation so no percentage. It goes down in the summer and up in the winter. Predictability is worse in the summer because of weaker systems and shorter wave lengths. I can't seem to find the year to year improvement plot.
-
1
-
-
13 minutes ago, CNY-LES FREAK said:
Nick you have a link for this page?
Sent from my SM-G930V using Tapatalk
Yep. Enjoy.
-
1
-
-
Decent performance the past month...not too far under ecmwf/ukmet.
-
1
-
-
On 10/20/2018 at 12:59 AM, BuffaloWeather said:
What is the FV3 version of the GFS?
https://www.weather.gov/news/fv3
Anyone know the accuracy of it compared to the normal GFS?
Its skill scores are slightly higher than the existing gfs. It also doesn't over-intensify hurricanes, which of course the current one does.
-
 1
1
-
-
That paper isn't going to assess snow probabilities the best I think because it's focus is very intense lows. We know that we don't need overly intense lows to get a heavy snowstorm.
-
On 10/20/2018 at 5:59 PM, Ginx snewx said:
Well lets just say coming to a model page near you. The research is done
https://journals.ametsoc.org/doi/full/10.1175/JCLI-D-16-0711.1
This is a cool paper. But I didn't see it make any sort of inference or correlation between fall nor'easters leading to winter ones. They just seem to be establishing a nor'easter climatology and then assessing risk via track and density based on different NAO and ENSO states.
-
Just now, 40/70 Benchmark said:
Pretty good bet this winter will be better for your area....can't get any worse. :LOL:
That is true. Last year was the worst
-
41 minutes ago, 40/70 Benchmark said:
There were circles that predicted that, actually....unless you mean completely unpredicted by the Euro.
There were some signs in the analog set before the season even started.
Yeah I was talking about the euro seasonal.
-
2 hours ago, raindancewx said:
OSU: You can get the old ECMWF forecasts here https://weather.us/monthly-charts
Go to Model Run on the left and select an older forecast Then the parameters you want.
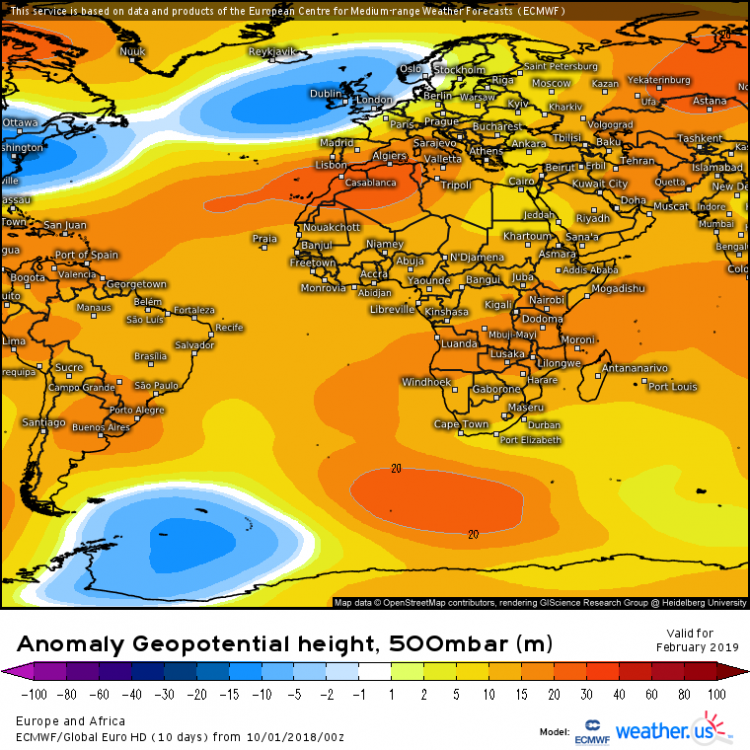
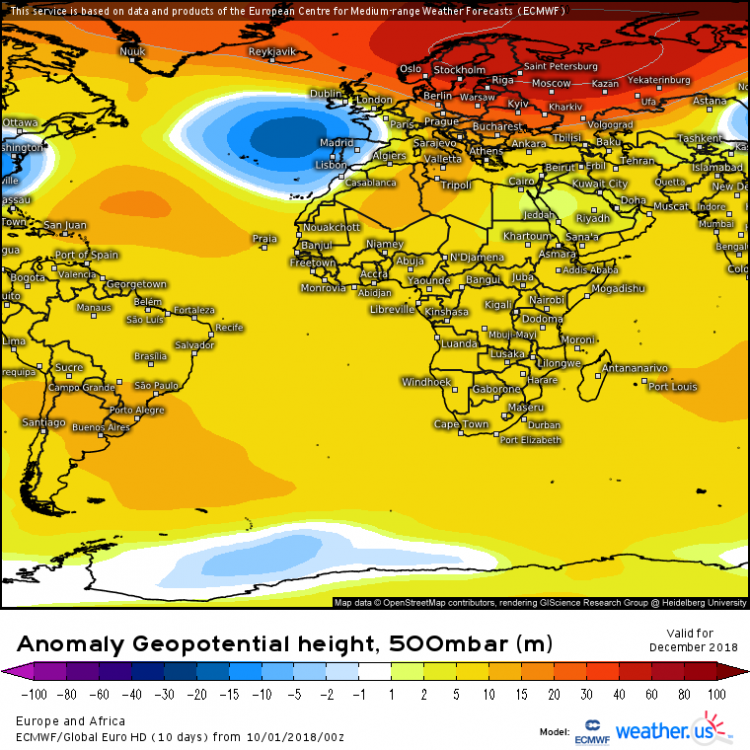
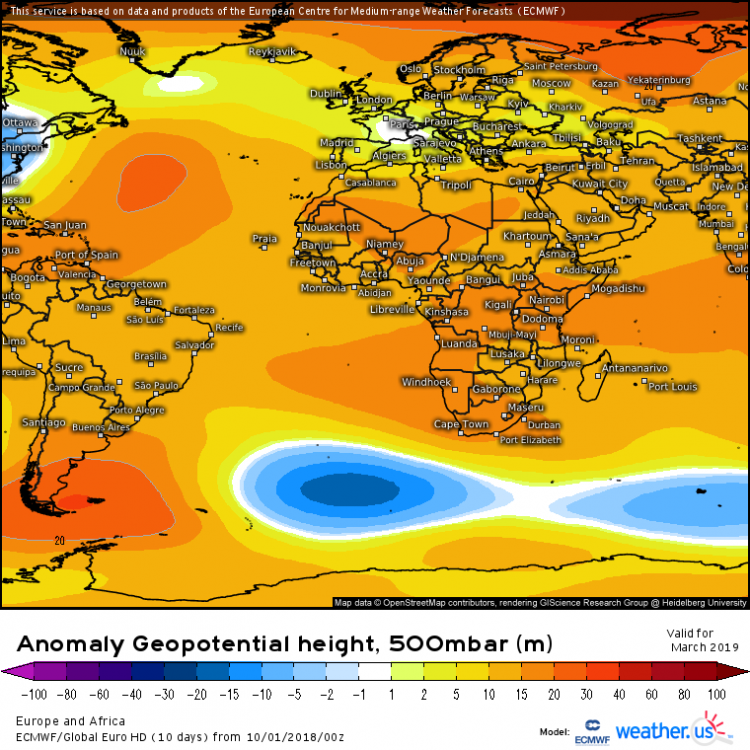
I am curious about what the Euro will say on 11/1 for November.

The idea of a warm east / cold west from the 10/1 run for October looks right. By this time in 2002, most of the heat over the East was gone.
1986, like this year had a big jump in the SOI in October after pretty similar July-Sept readings. The 10/1-10/17 SOI is +3.1. Seems to be coinciding with slightly lower Nino 3.4 readings.
Thanks.
The October run last year actually did great for Dec, Jan, and Feb here. March failed because of the Feb strat warm event that caused a completely unpredicted pattern reversal.
-
On 10/15/2018 at 11:20 PM, 40/70 Benchmark said:
Anyone know of any free graphic tools for making maps?
TIA...
Qgis is free. We use it at the office. I'm not a GIS guy so there's a bit of a learning curve but you can make some really professional looking maps with it.
-
1
-
-
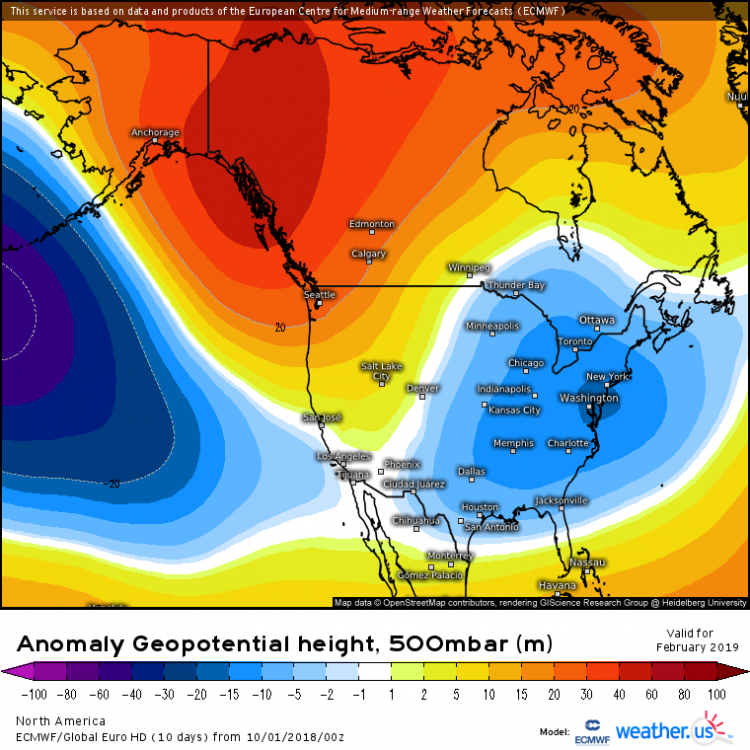
13 hours ago, raindancewx said:
Here is a look at how well the 10/1/2017 European Model runs did for actual temperature anomalies for Winter 2017-18. For December, the East was much colder v. what was shown in October. The SW was much hotter. The Northern Plains much warmer. For January, East was much colder than forecast, and the West was much warmer than forecast. The forecast for February was broadly speaking, useless. The Plains were 10F colder than shown in places, with the east over 5F warmer. I'd give December a C+ (not bad), January a C- and February an F. The forecast on 10/1 for October 2017 was of course quite good (B+), but I'd say even Nov 2017 from Oct 1 2017 was only in the C+ range.


How did u get those plots from last fall? They aren't in the dropdown menu.
-
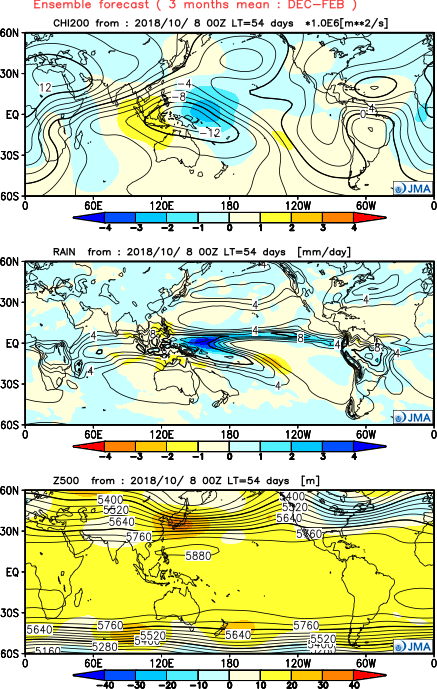
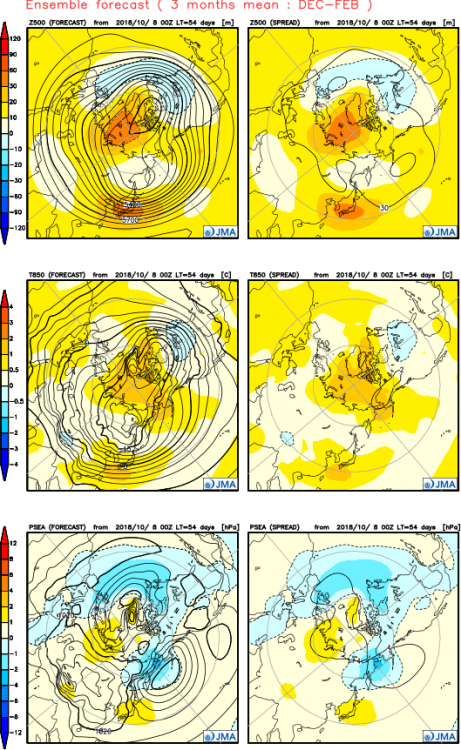
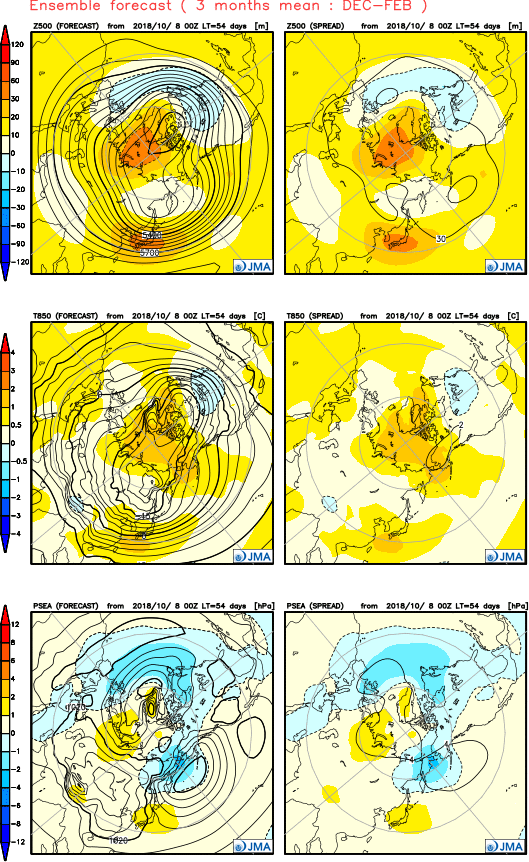
New jma is out. Looks really nice overall. Probably not quite as cool as the ukmet and ecmwf given the lack of ridging in ak and the pna region seen on the European guidance. December has the Aleutian low into the Bering which isn't as ideal as some other guidance. Looks better in Jan though.
.thumb.png.e3bdfb8b123c5e38606ff1d522568bd1.png)
-
1
-
1
-
-
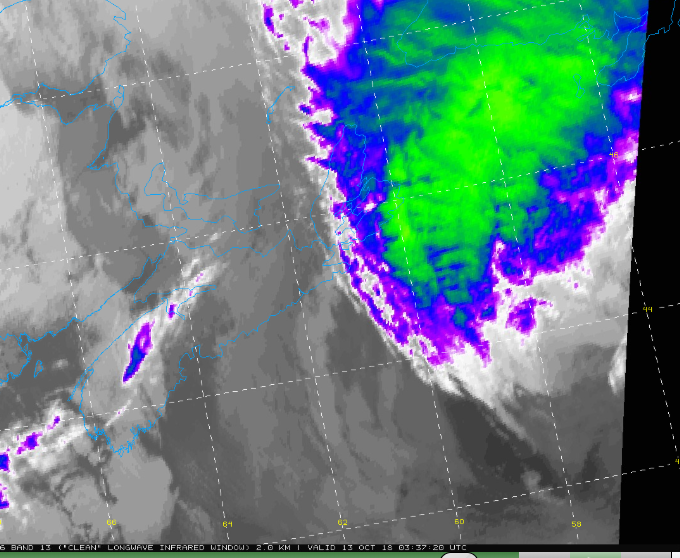
One of our guys out on the waq south of ns had a nice stinger last night from post-michael. 73g86kt at 60m.
They were in that warm IR area south of the edge of the comma head.
-
1
-
-
3 minutes ago, C.A.P.E. said:
Ha I was just looking at that view. Looks like some decent +heights over GL for Dec.
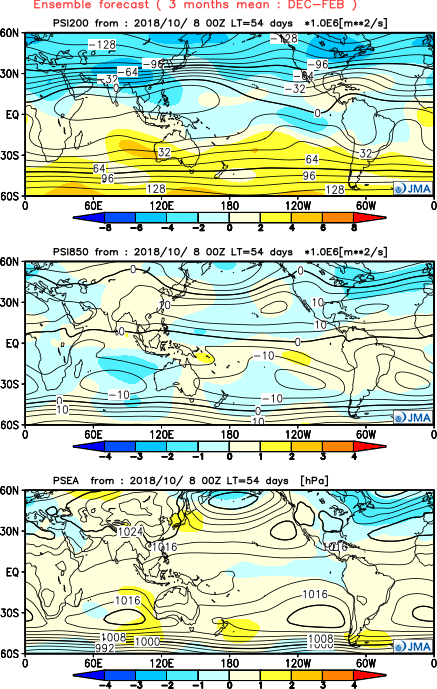
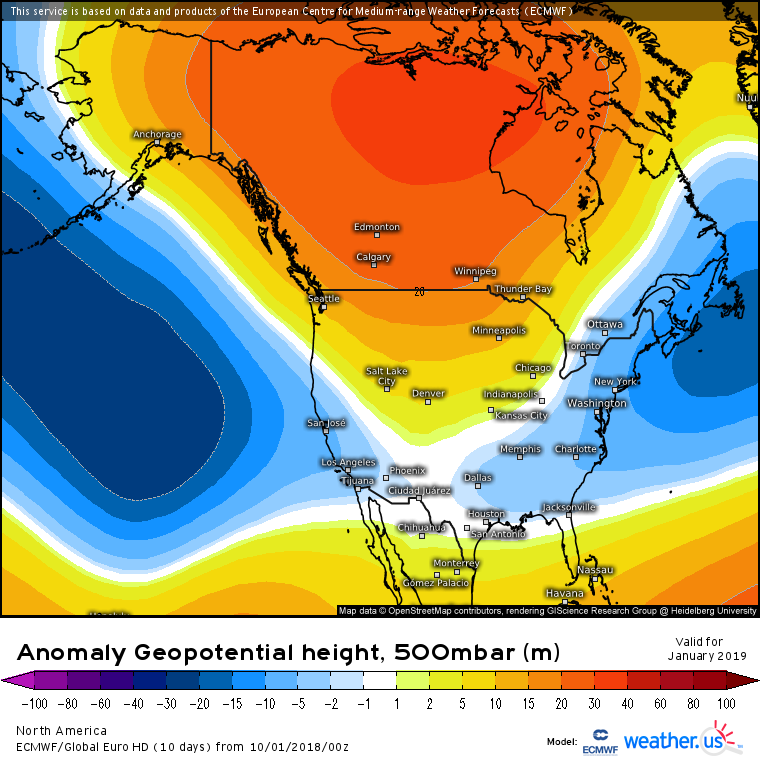
I'd call that probably a weak -nao overall in the means. Looks stronger but east based in December. You don't get low pressures and low heights over NL in a strong -NAO.
") The Aleutian low appears to stay west enough to not flood north america with PAC air.
The Aleutian low appears to stay west enough to not flood north america with PAC air.
-
2
-
-
3 hours ago, showmethesnow said:
Shame we aren't seeing the full N Hemisphere on those. Would really like to see what type of blocking we getting over Greenland. As is, all the months would probably imply opportunities but January and February really stand out with great blocking over top in Canada. December and March both are showing some Atlantic ridging which would threaten systems possibly running to our west but with a little -NAO love that problem would be easily solved. I would take this in a heartbeat because we are probably looking at coastal threats throughout the winter. If this were to actually verify I would be putting my money on above normal snowfall, potentially big time, if we get a Kocin event or two mixed into the equation.
Its a free site. You can click around to get the area you want. This is Europe and Africa which does give you a good section of NAO domain.

-
3
-
2
-
-
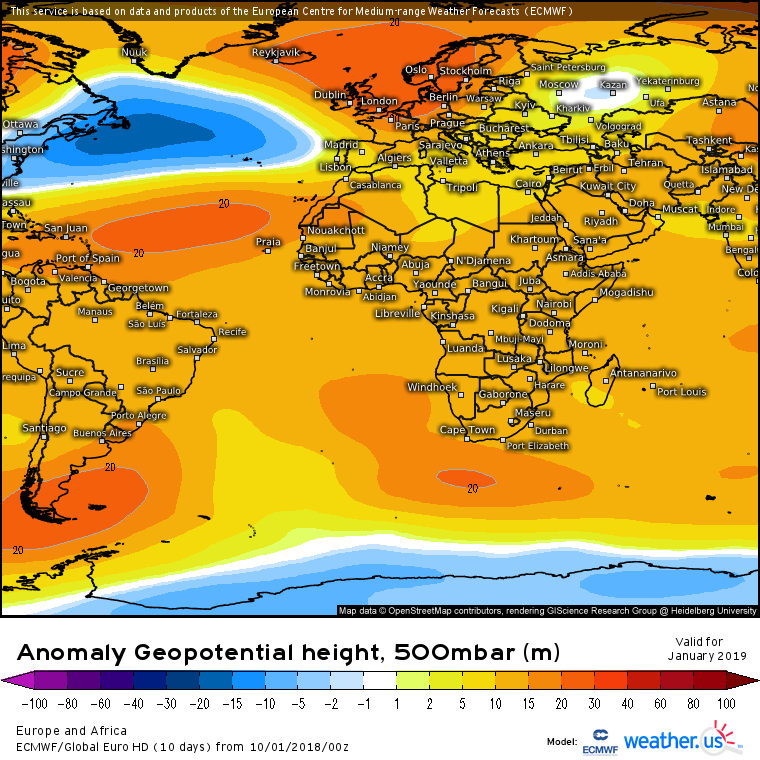
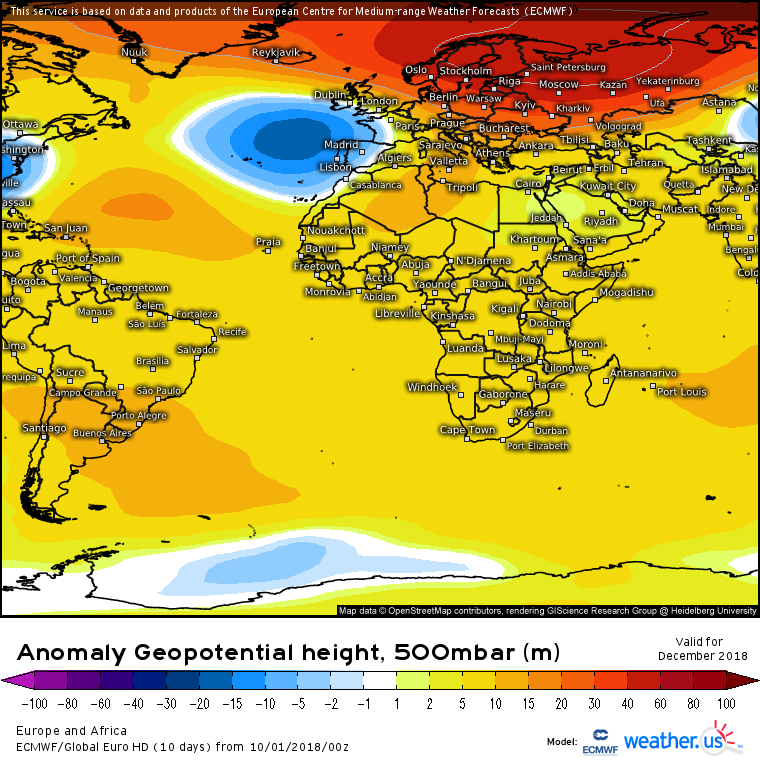
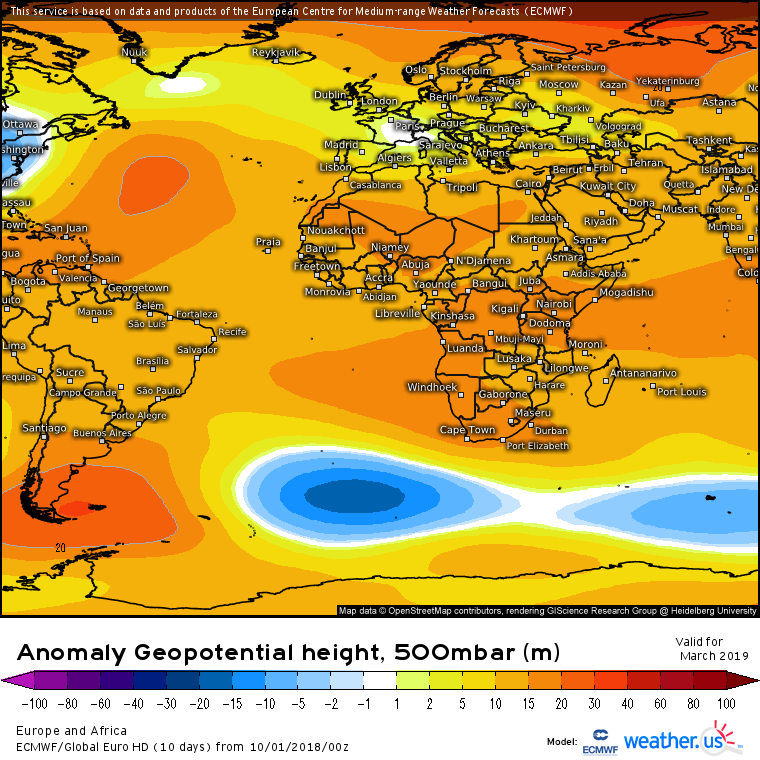
New ecmwf seasonal is out on weather.us looks pretty sexy for all id say.
Above normal precipitation for the I 95 corridor aside Jan.


-
7
-
2
-
-
Yeah ukmet was definitely pretty nice
.png.e604a56644894b0ac97e99332e37aea1.png)


Countdown to Winter 2018 -2019
in New England
Posted
https://journals.ametsoc.org/doi/10.1175/JCLI-D-16-0132.1
Interesting findings I thought. This was also posted in the mid Atlantic winter thread.