

OSUmetstud
-
Posts
16,521 -
Joined
-
Last visited
Content Type
Profiles
Blogs
Forums
American Weather
Media Demo
Store
Gallery
Posts posted by OSUmetstud
-
-
Just now, beanskip said:
So given that Helene is now east of 84N, is this less-than-a-day-old run considered good verification?
Is asking why the NHC deferred so strongly away from the globals and toward the spaghetti models still a dumb question?
I don't really understand the question. The spaghetti models are not wholly separate from the global models. The global models are here on these plots...they're just adjusted for the current position of the hurricane in time.
These are the models the nhc has used for years. The same ones.
-
 3
3
-
 1
1
-
 1
1
-
 1
1
-
-
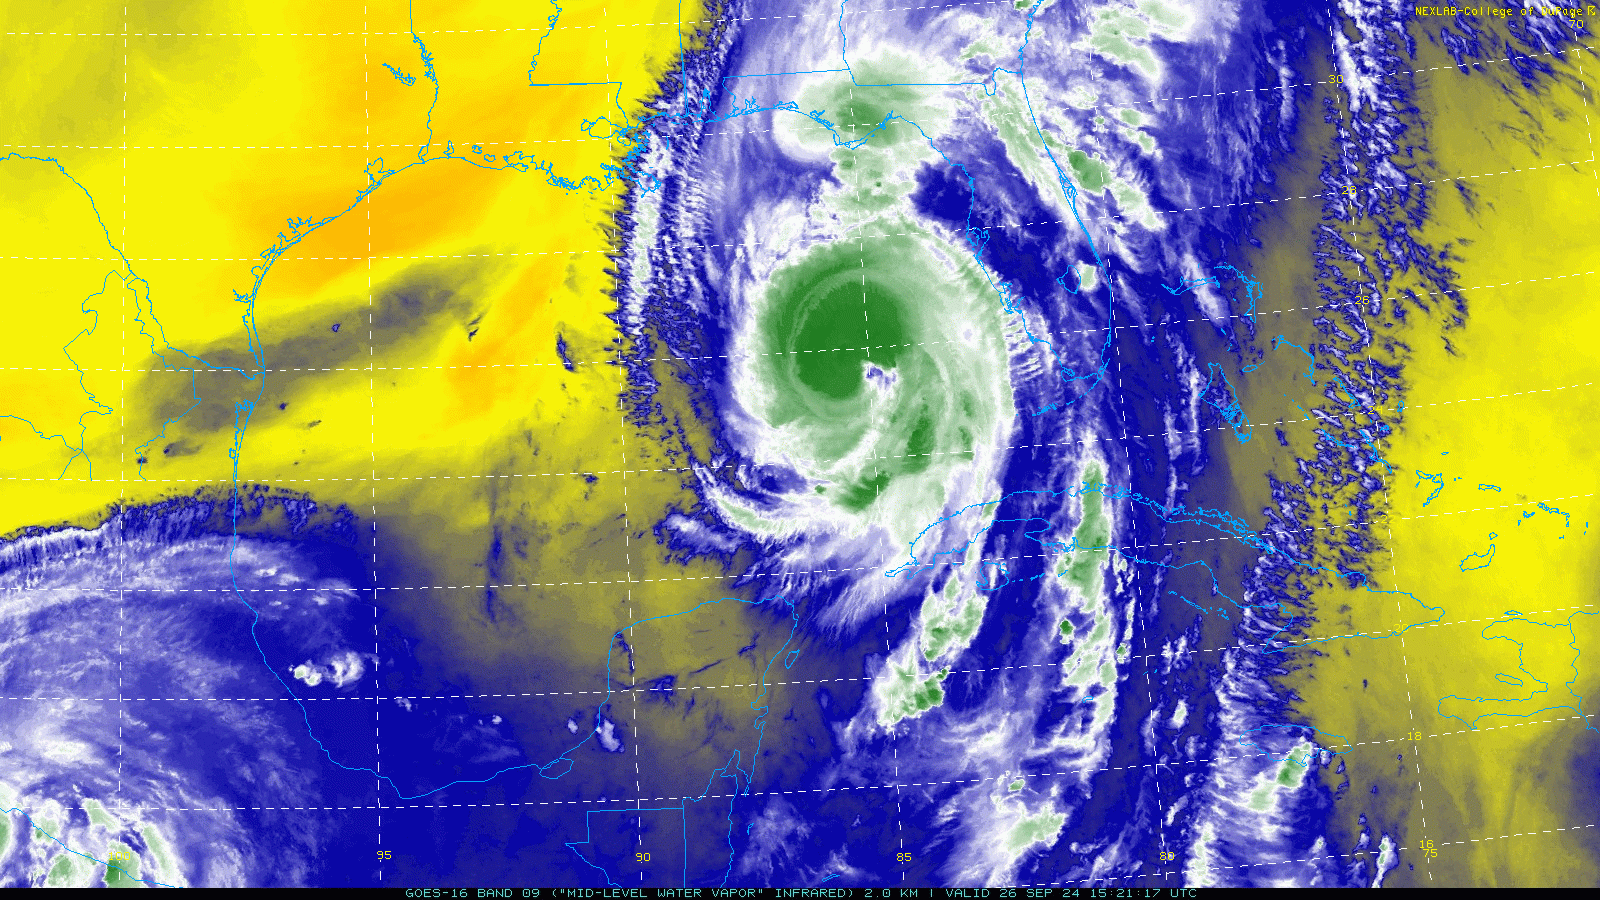
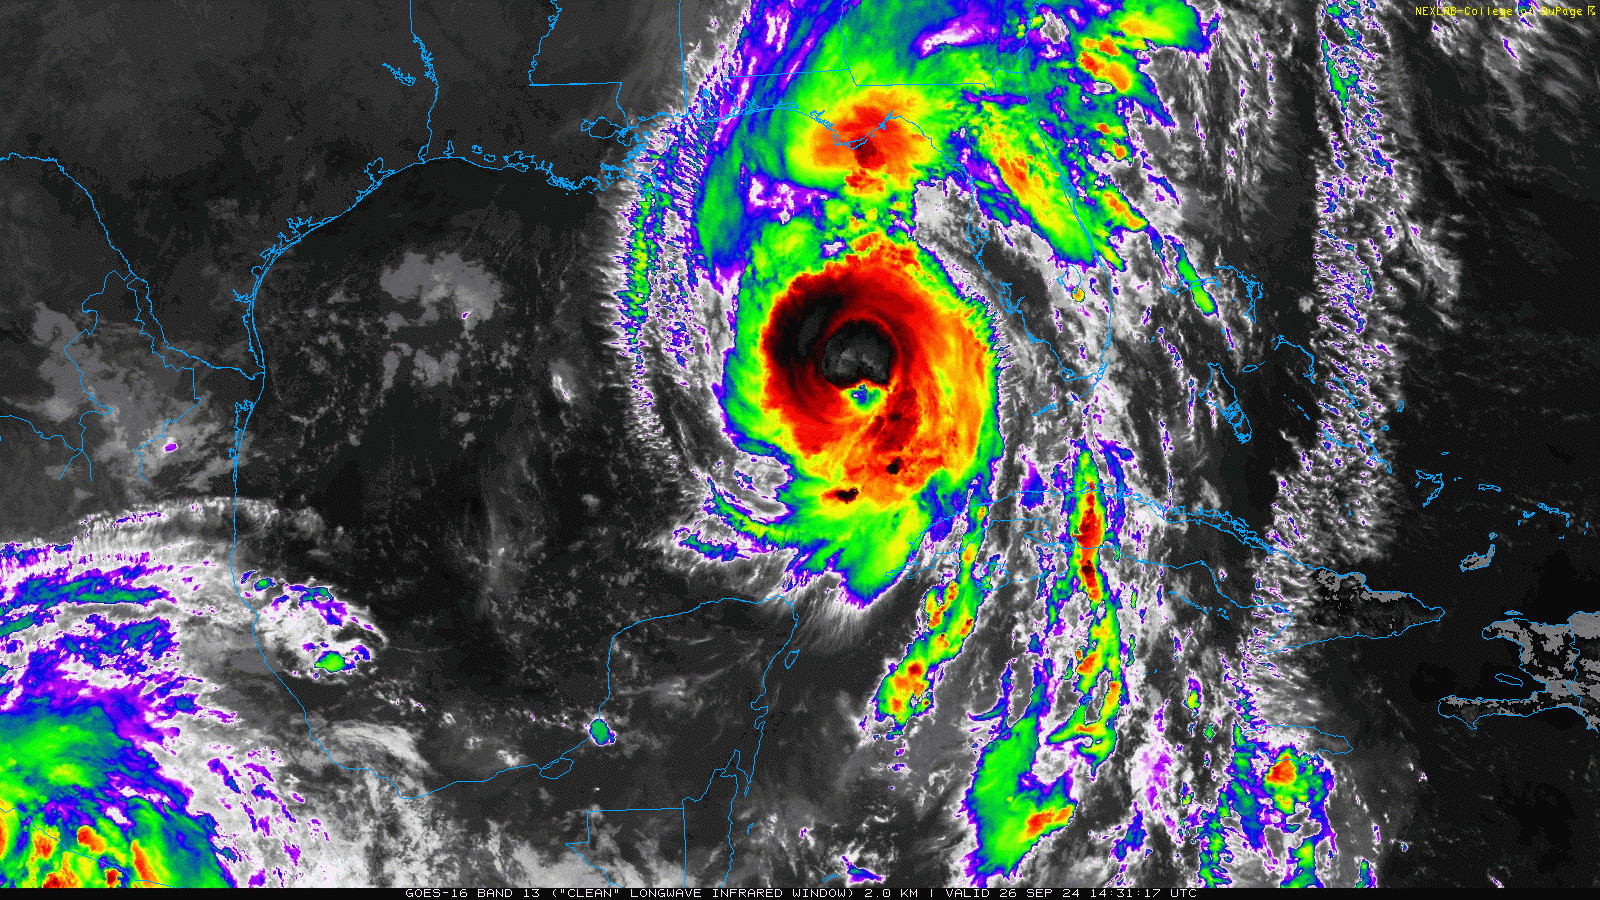
The northern eyewall is the only part producing lightning. The southern eyewall is likely not open but it's also weaker.
-
7
-
-
im a big fan of the hafs modeling project in general, but man these runs of going back and forth between intense hurricane and weak to moderate hurricane are a bit much.
-
1
-
-
2 minutes ago, WEATHER53 said:
How far inland would a 15’ surge go before it dissipated to less than 1 foot?
These are inundation maps based on different hurricane categories. It depends on a lot of factors like the topography of land that the water is trying to flow over.
https://experience.arcgis.com/experience/203f772571cb48b1b8b50fdcc3272e2c/page/Category-4/
-
This is something that Eric Webb brought up the past few days before Helene took off. I see some elements from the WSW drifting toward Helene on the mid-level WV that are originating from John's outflow to the southwest that could be affecting things. Mostly internal factors, but i think there could be something there. This is shear that's underneath the outflow layer.

-
6
-
-
Getting pooped emojied for having weather opinions lol
-
4
-
 6
6
-
1
-
 13
13
-
1
-
-
Just now, USCG RS said:
That is worrisome. As most know, an extra 6 or 12 hours over that bath water is going to have singificant implications for organization and intensity.
Yeah i thought that too, but after all of these issue today, im more on the side that the internal structure of the storm just isn't going to allow a lot of intensification before landfall. It's not like the models are really forecasting a ton of that anymore. Global and hurricane models really only seem to show slow intensification this afternoon up until landfall. Well see.
-
5
-
1
-
1
-
-
Just now, WxWatcher007 said:
Yeah, this is actually my second time here (Idalia). The road network provides me with quick options and yeah, definitely most developed in the area. I don’t have any interest in being in a surge zone so I’m typically more inland.
Also, WPC has significantly expanded the high risk to include much of GA, including metro Atlanta.
But drowning shots make big money.
-
1
-
4
-
-
6 minutes ago, beanskip said:
So the latest IR frame appears to put the eye at 84.9W 24.8 N.
Is that actually the eye?
I ask because if you plot that on the 11 a.m. NHC track, it's already almost out of the cone to the right.
This was the VDM for one hour ago. That's the best estimate for position.
046
URNT12 KNHC 261447
VORTEX DATA MESSAGE   AL092024
A. 26/14:15:30Z
B. 25.28 deg N 085.55 deg W
C. 700 mb 2792 m
D. 962 mb
E. 220 deg 8 kt
F. CLOSED
G. C30
H. 66 kt
I. 340 deg 13 nm 14:11:30Z
J. 064 deg 59 kt
K. 338 deg 15 nm 14:11:00Z
L. 76 kt
M. 091 deg 35 nm 14:25:00Z
N. 186 deg 101 kt
O. 090 deg 58 nm 14:31:30Z
P. 14 C / 3043 m
Q. 16 C / 3049 m
R. 12 C / NA
S. 12345 / 07
T. 0.02 / 4 nm
U. AF308 1609A HELENE    OB 04
MAX FL WIND 101 KT 090 / 58 NM 14:11:00Z
;
-
1
-
-
Just now, WxWatcher007 said:
Yeah that’s what I’m thinking right now.
im guessing that's the most developed area in that region? You get a nice combo of right front quad wind there and some potential for the eastern eye. Maybe a better chance of eye in Newport or St Mark's but im also not sure of the viability of that area.
-
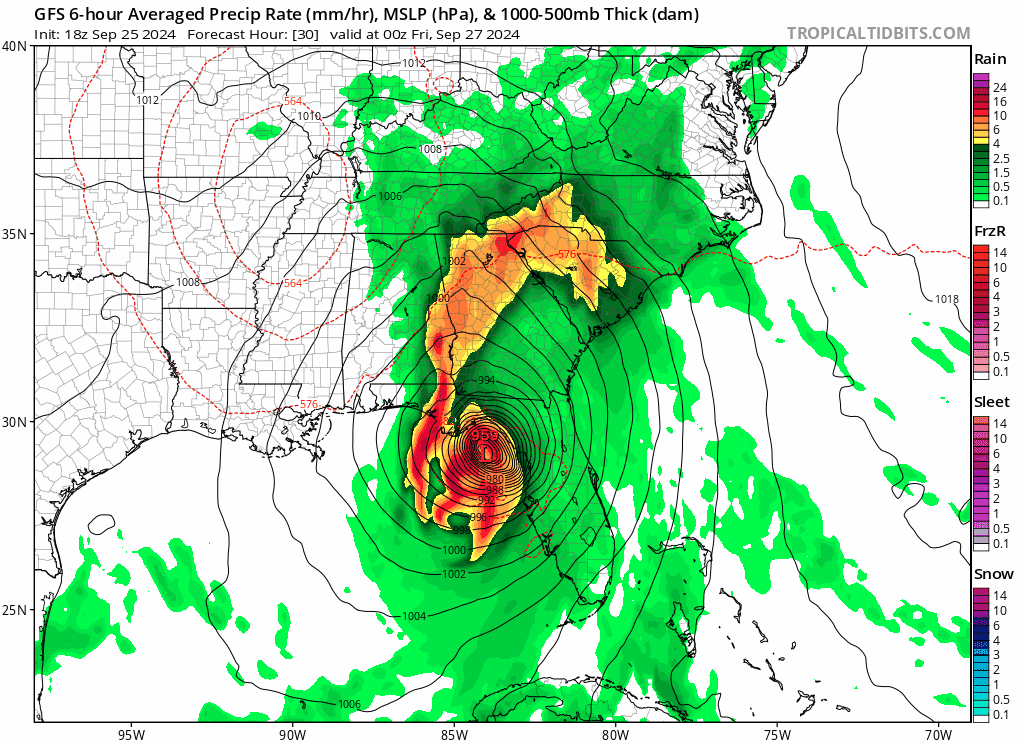
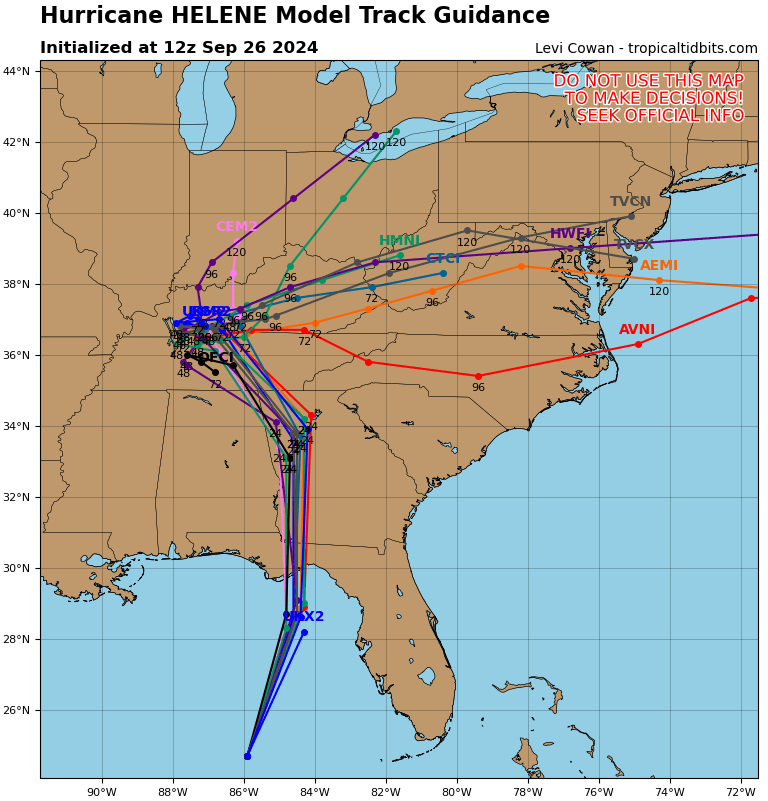
GFS continues the slowing trend.

-
1
-
-
Much of Helene's issues seem internal to me. I guess there could be some poorly analyzed from Hurricane John undercutting it, but i think that's less likely.
-
1
-
-
-
5 minutes ago, Seminole said:
Completely agree. The eastern eyewall is at 85N and 25N. The past 4 hours the track has had more of a easterly component than northerly.
It's gained .6 degrees of latitude and has lost .2 degrees of longitude between the 12z nhc position and 14z recon center fix. It's moving nne.
-
2
-
-
-
2 minutes ago, Master of Disaster said:
Now that you point it out you can see the open area at the SW. Didn't even notice till you said that.
You can see it better on the ir. There's a lack of cold cloud tops in the southern semi circle
-
1
-
-
Just now, Master of Disaster said:
Is that eye 32 miles across? Did I read that correctly?
It's elliptical and open sw now, but pretty large eye overall.
F. OPEN SW
G. E13/38/22
-
1
-
-
raw advanced dvorak is in the high 5s but i would really like to see the southern eyewall get going to see more intensification in earnest.
-
2
-
-
The NHC cone only represents 5-year average track error at each forecast point in time. TCs will verify outside of the cone from forecast about 1/3rd of the time.
-
1
-
3
-
-
Just now, beanskip said:
Nope, this isn't right either for GFS -- it's slightly southEAST. Landfall at exact same time, just to the right.
Looking at the T+6 h forecast from both the GFS and ECMWF models. It corrected northwest from the previous 00z run. Also, the 06z ECMWF landfall location is definitely west of the 00z ecmwf landfall location.
-
1
-
1
-
-
2 minutes ago, SnowGoose69 said:
The core of those is mostly dead on the current NHC track, wonder if they will keep shifting east though. As you said, the ultimate LF point looks like its maybe on east end of that
The 06z gfs and 06z ecmwf shifted a bit northwest for what it's worth.
Correction: southwest is more correct because they're a bit slower.
-
2
-
-
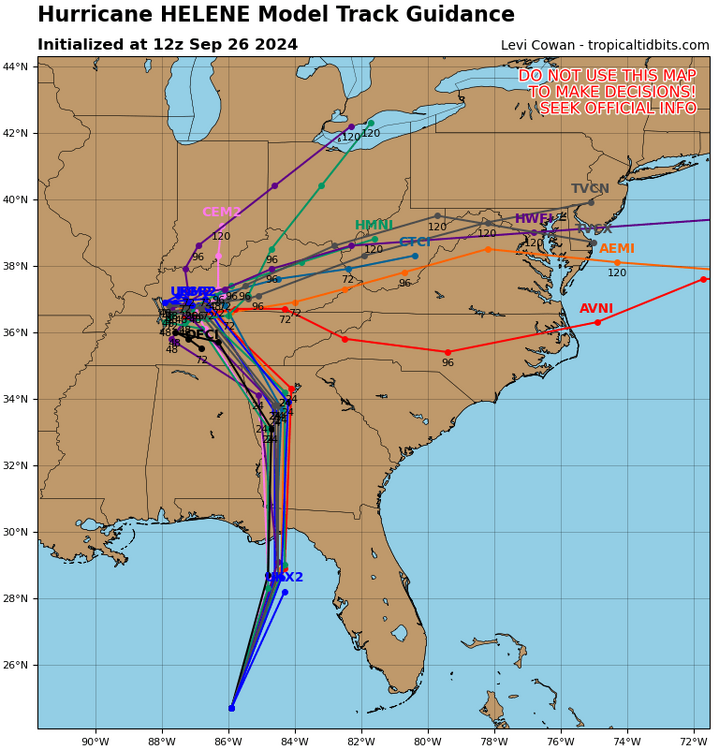
12z early cycle models
-
1 minute ago, Prospero said:
That will make for a longer more stressful night here in Tampa Bay.
Hope for the best for you.
-
2
-
1
-
2
-
-
06z models were a bit fast relative to the 12z nhc center fix. So id expect a landfall a bit closer to 03z than 00z. For example, the gfs was a bit north of 25, while the center fix is 24.5.


Major Hurricane Helene
in Tropical Headquarters
Posted
Helene is not east of 84 w anyway. It's latest position is 84.2.