

OSUmetstud
-
Posts
16,433 -
Joined
-
Last visited
Content Type
Profiles
Blogs
Forums
American Weather
Media Demo
Store
Gallery
Posts posted by OSUmetstud
-
-
10 minutes ago, CoastalWx said:
I wish one of these s/w’s would produce something with this cold.
Yes. Lots of shuffling around in the 5 to 8 day. Low predictability.
-
1 hour ago, AfewUniversesBelowNormal said:
Yup, another wave incoming. The El Nino is not waning.
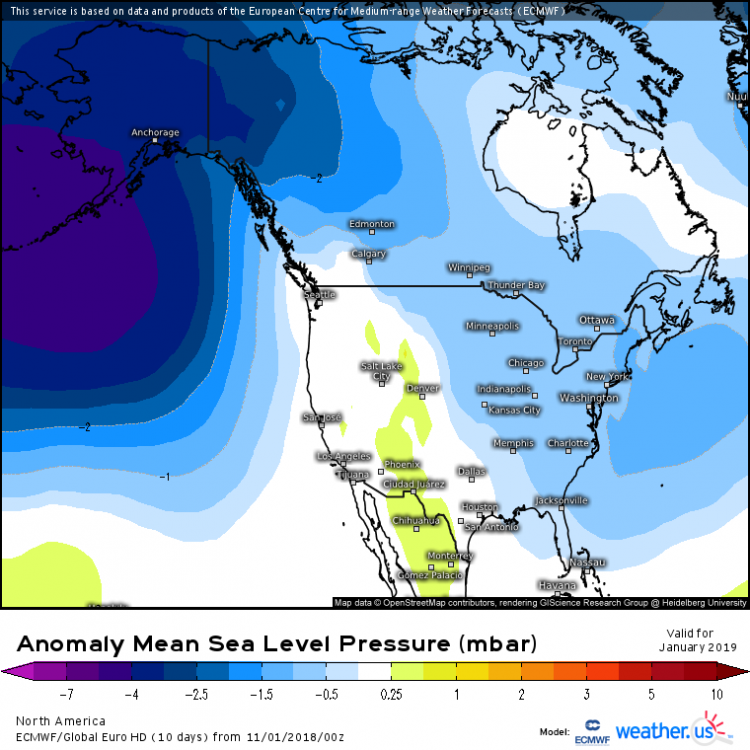
I doubt the -PNA in the 2-8 day will verify despite +300dm at 500mb shown on ensemble mean!
Can you point out this severe negative PNA that you're talking about?
-
3 minutes ago, 40/70 Benchmark said:
Negligible, really...maybe like 1-3". Main difference will be better retention further from the marine influence.
Ahh, nice.
-
I thought weeklies looked okay, but the signal overall was pretty weak outside of the normal two week ensemble period. Lots of whites on the maps, not much oranges or blues. Nothing really to be discouraged about or super excited about.
-
 1
1
-
-
39 minutes ago, 40/70 Benchmark said:
Agreed..that high placement is nearly optimal for my new spot.
https://easternmassweather.blogspot.com/2018/11/right-on-cueregions-first-snows.html
How much of an increase in yearly snowfall at the new location? A few inches I'm thinking?
-
Scandinavian Block and death storm near my head are doing good work.
-
1
-
-
2 minutes ago, EasternLI said:
Yeah it updated early this month just noticed. Usually it updates on the 11th.
-
1
-
-
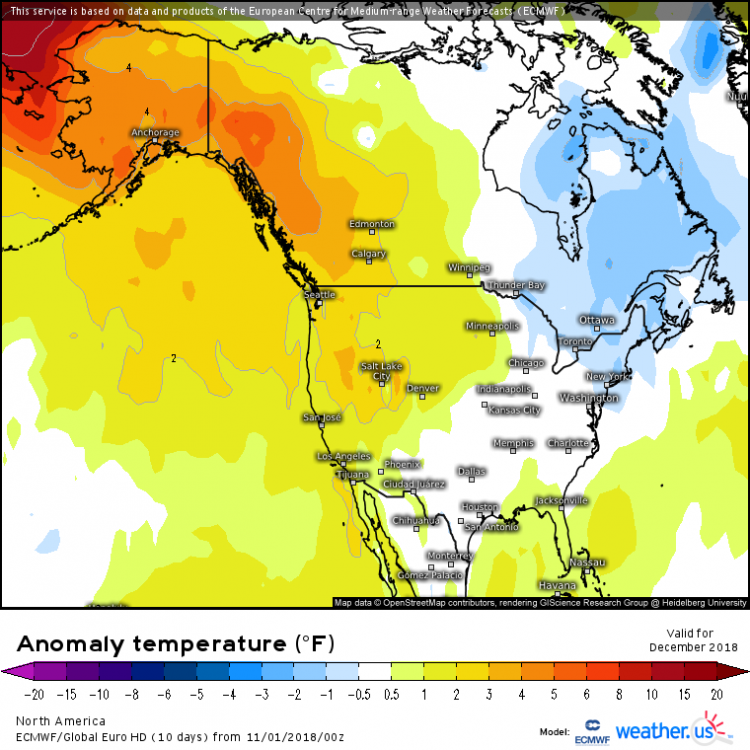
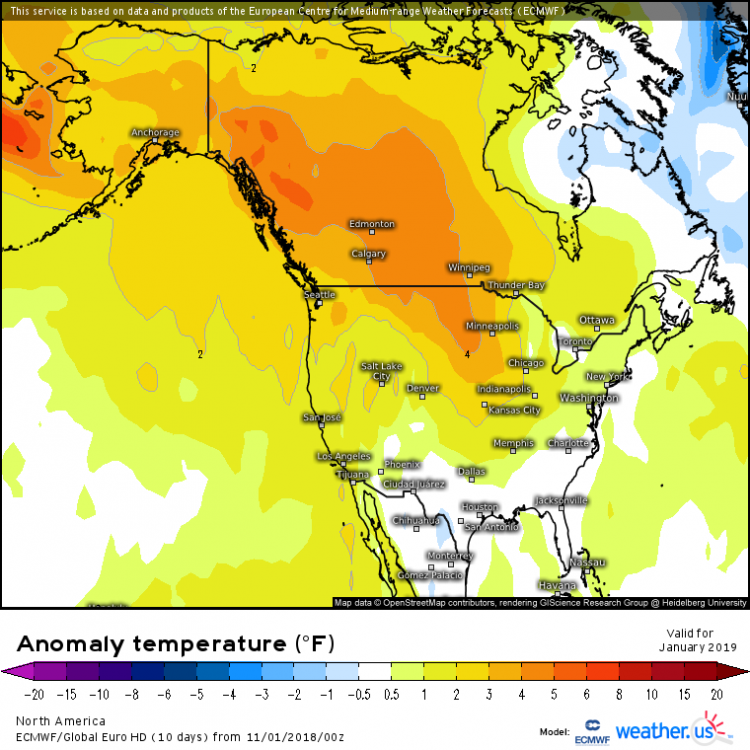
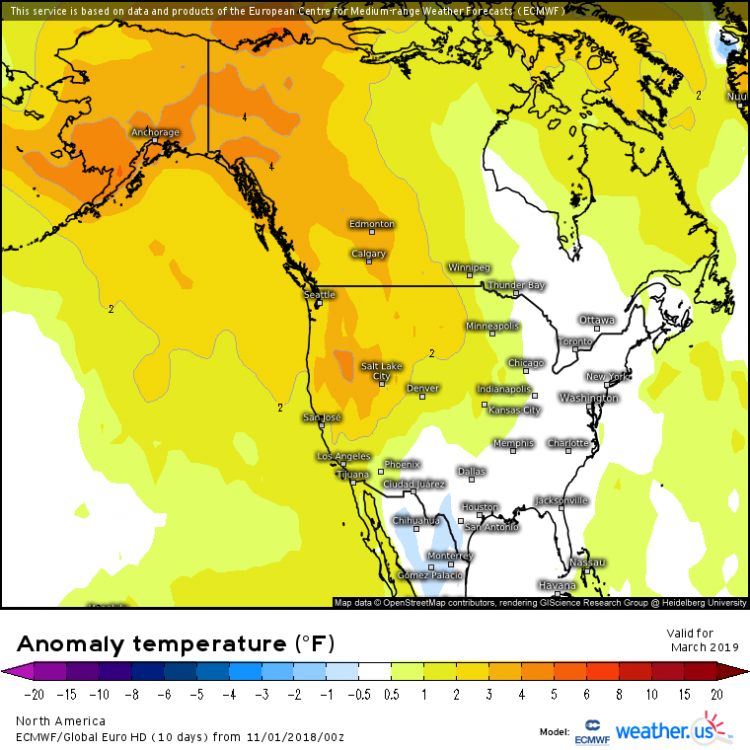
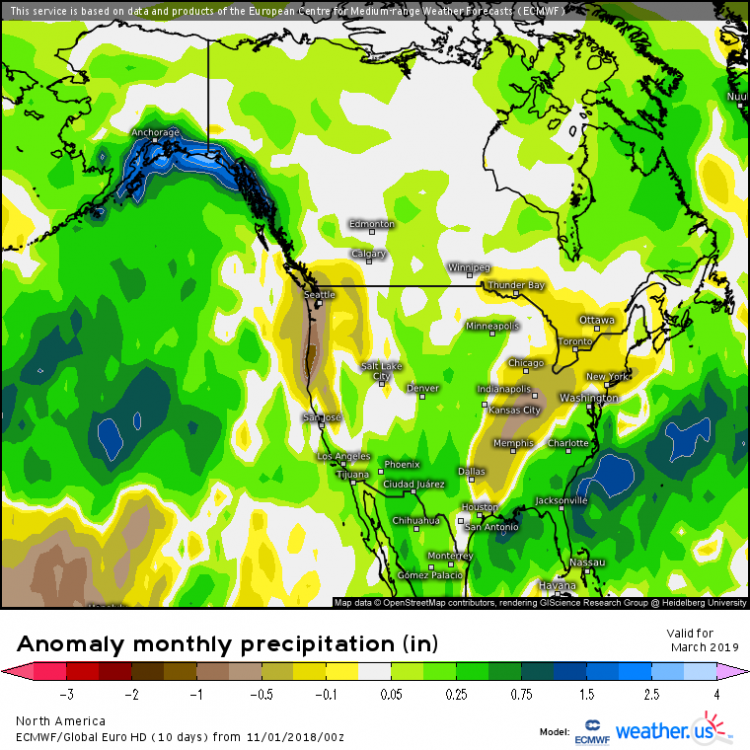
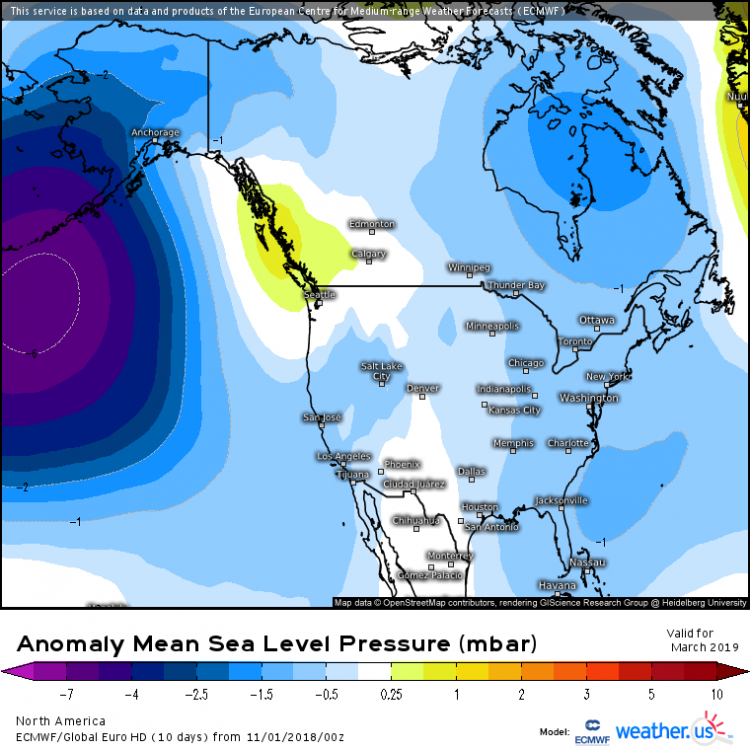
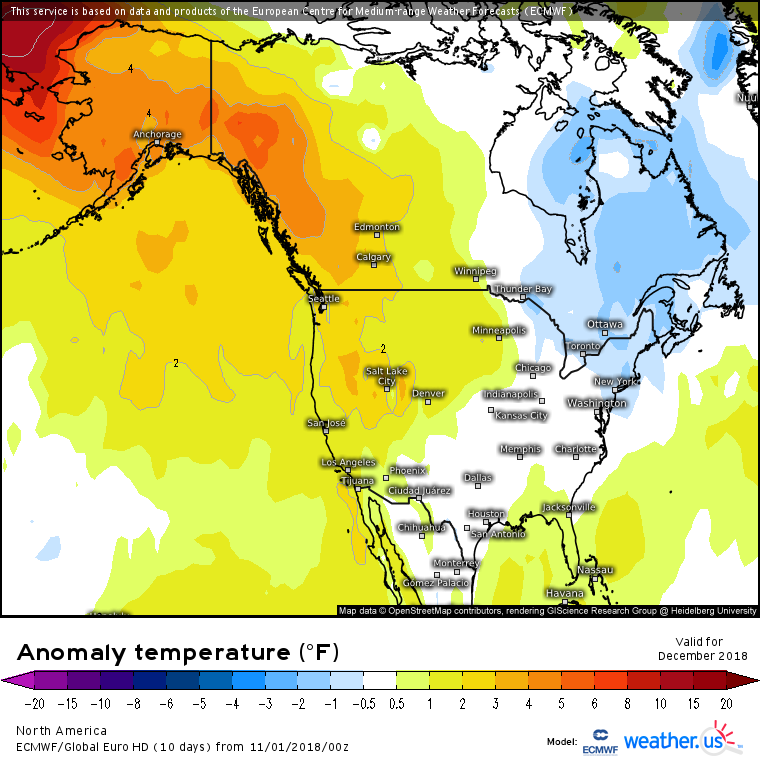
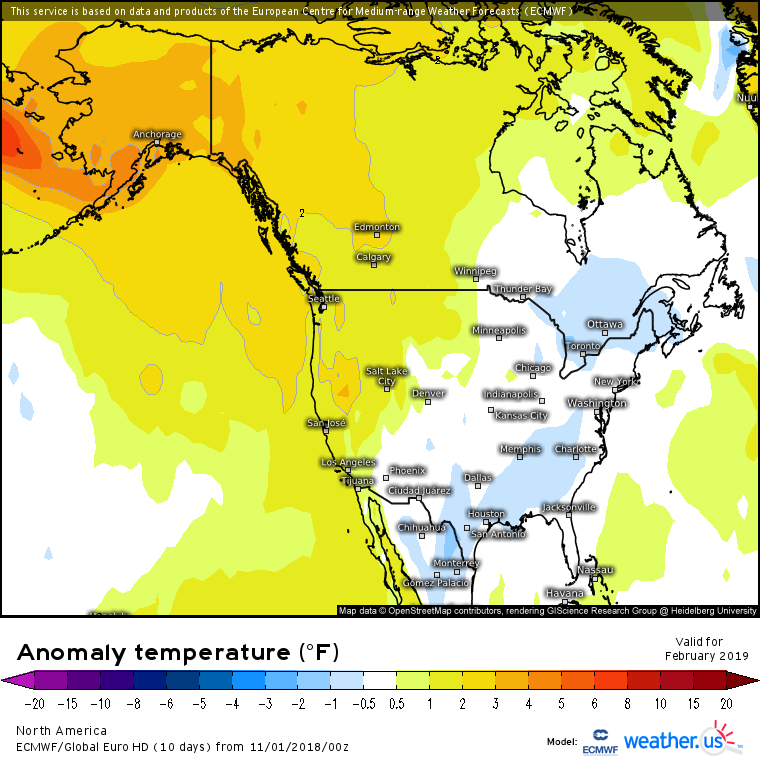
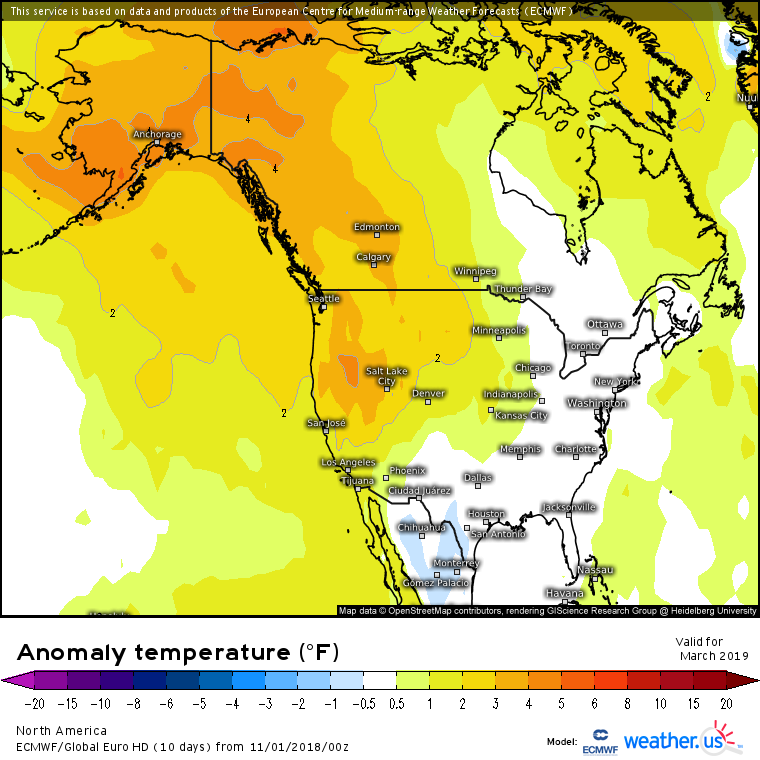
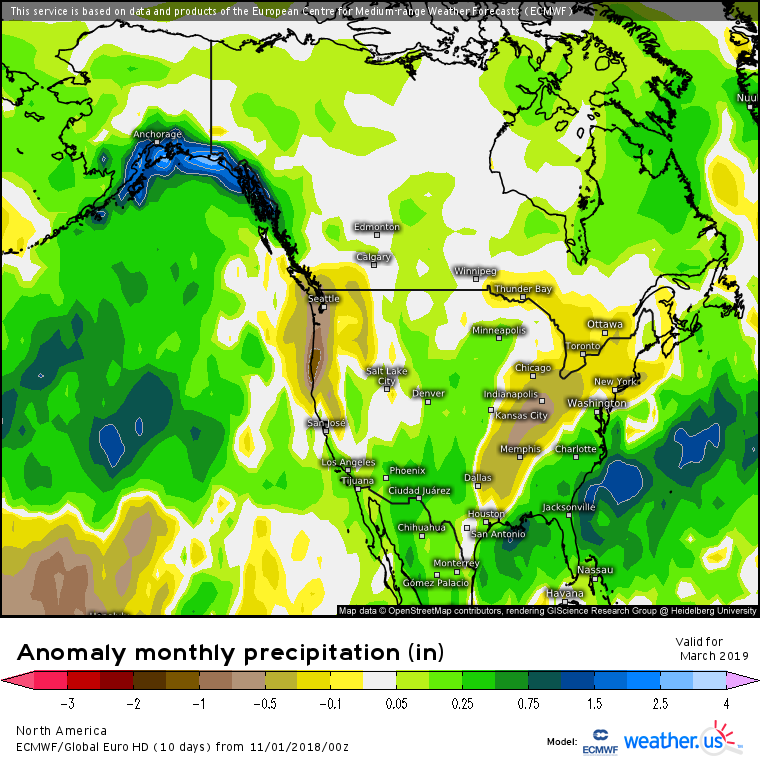
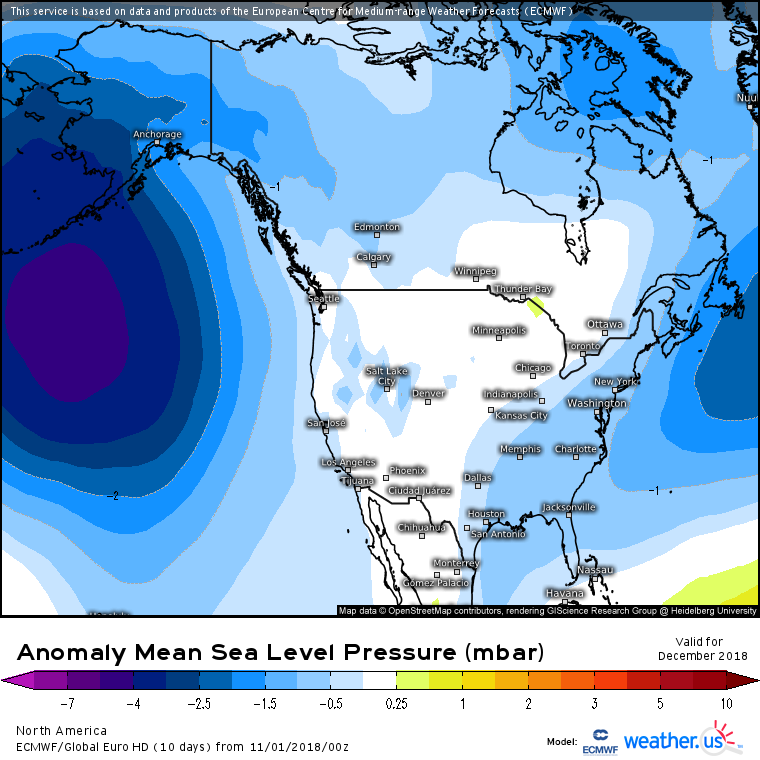
It's already updated on weather.us
https://weather.us/monthly-charts/euro/2018110100/north-america/anomaly-msl/20190301-0000z.html


-
1
-
 1
1
-
-
56 minutes ago, psuhoffman said:
I would guess because I know several people in my PSU circle of friends have subscriptions to wxbell. I currently do not. I can verify they are authentic though because I found some maps posted on twitter and they match up perfectly.
I have a wxbell subscription. I never have seen the euro seasonal on there, only the weeklies.
-
Just now, psuhoffman said:
someone I know and trust from my PSU meteorology days sent it to me but if I had to guess the source I would say probably JB.
Cool thanks.
-
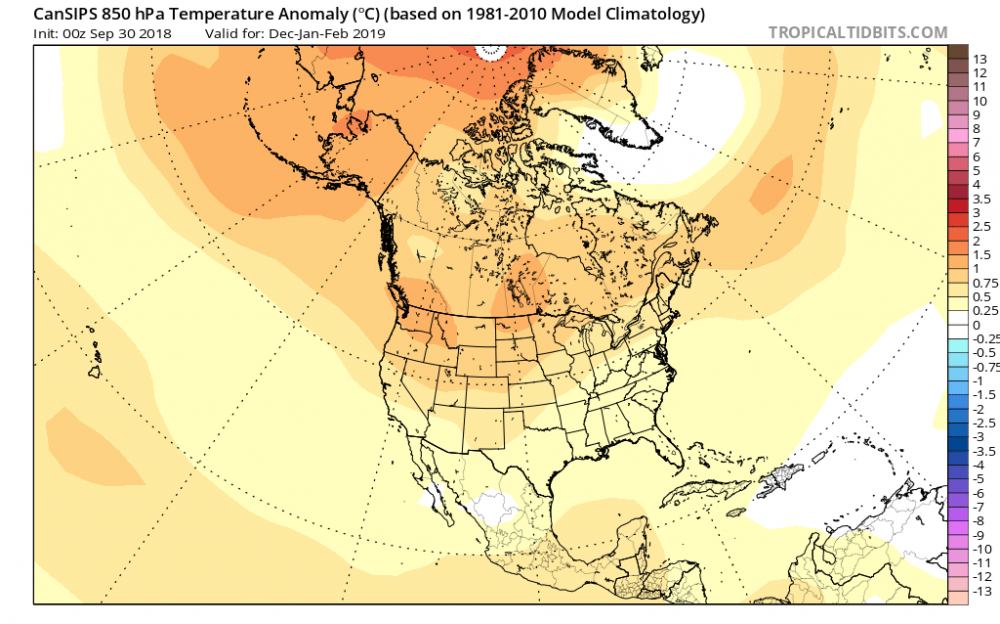
55 minutes ago, psuhoffman said:
Mean h5 for the winter.

Feb

Where did you find that?
-
1 hour ago, LoveSN+ said:
When does the November update for the Euro come in? Should be in the next few days, yes?
Ben Noll made some euro posts on October 5th last month. Weather.us has the monthly data on the 11th. Ukmet is also on the 11th. Nmme comes out on the 8th.
-
1
-
-
1 hour ago, griteater said:
Thanks!
-
This is another paper about NAO prediction.
https://www.nature.com/articles/s41598-017-00353-y
Most important factors they found were fall Barents/Kara Sea Ice, fall wave 1 stratospheric disturbances and fall north Atlantic SST configuration.
-
3
-
-
26 minutes ago, LoveSN+ said:
Not sure exactly how his calculation is done; I'm sure it's probably in his paper. But here is a link to Eurasia snow cover for Oct from 1967-2017. 2018 is not updated yet.
https://www.ncdc.noaa.gov/snow-and-ice/extent/snow-cover/eurasia/10Thanks
-
Where do we find more than the past 10 years? Its Canadian snow cover that been impressive this year, not Eurasia.
-
3
-
-
On 10/20/2018 at 11:35 PM, griteater said:
Latest graph...

Where do I find this graph?
Thanks.
-
I'm not sure a negative PDO here means as much as it normally would. It's a bit of a "fake" -pdo in the sense that there's really warm water in the Gulf of AK all the way south into the PAC NW. That SST arrangement along with a CP El Nino should be associated with a +PNA pattern predominantly through winter. Usually it would be cold there in a more typical -PDO. The value of the index is lowered significantly because of the warm water off japan.
-
Just now, Hoosier said:
There have been cases of 3.4 warming by another 1.0C or 1.1C from the JAS value, though. So if that happens this time, the peak would be flirting with or getting into moderate territory.
Sure, I'm just saying there's nothing in the data set that's been this low in JAS that jumped into moderate from here. Anything can happen and I'm certainly not a Nino expert.
-
3 minutes ago, raindancewx said:
Part of the issue here is NOAA now bases ONI on 30-year periods that change every five years. Against a constant 1951-2010 mean for JAS (26.74C), the ONI was actually +0.39C in July-Sept. NOAA uses 26.99C for that period now. http://origin.cpc.ncep.noaa.gov/products/analysis_monitoring/ensostuff/detrend.nino34.ascii.txt
Similar years by using a constant base for anomalies for July, Aug, Sept
1976 27.13 26.98 27.02 0.30 1969 27.08 27.02 27.15 0.34 1968 27.58 27.01 26.72 0.36 1977 27.38 26.85 27.12 0.38 2018 27.42 26.94 27.02 0.39 1953 27.43 26.94 27.01 0.39 1990 27.38 27.07 26.94 0.39 1993 27.52 26.99 27.07 0.45 1986 27.18 27.17 27.24 0.46 2003 27.50 27.11 26.99 0.46 2006 27.30 27.16 27.32 0.52 A jump well over +1.2 probably would be unprecedented v. 1951-2010 means, but the data says what it says - +0.9C is historically the low end for what the surface was in October.
DJF 1.20 3.00 3.4 4 1.2 3 3.4 4 1951 24.40 26.00 26.77 28.30 0.19 0.41 0.26 0.20 1953 23.25 25.73 27.00 28.37 -0.96 0.14 0.49 0.27 1957 24.84 26.96 28.16 29.02 0.63 1.37 1.65 0.92 1958 23.88 25.58 26.96 28.34 -0.33 -0.01 0.45 0.24 1963 23.75 26.10 27.36 28.33 -0.46 0.51 0.85 0.23 1965 24.53 26.68 27.73 28.74 0.32 1.09 1.22 0.64 1968 24.23 26.15 27.54 29.23 0.02 0.56 1.03 1.13 1969 24.69 26.12 26.92 28.65 0.48 0.53 0.41 0.55 1972 25.64 27.37 28.33 28.93 1.43 1.78 1.82 0.83 1976 24.57 26.46 27.18 28.19 0.36 0.87 0.67 0.09 1977 24.04 25.89 27.15 28.69 -0.17 0.30 0.64 0.59 1982 27.10 28.48 28.79 28.76 2.89 2.89 2.28 0.66 1986 25.35 26.79 27.76 28.73 1.14 1.20 1.25 0.63 1987 24.62 26.32 27.34 28.97 0.41 0.73 0.83 0.87 1991 25.13 27.06 28.40 29.12 0.92 1.47 1.89 1.02 1994 25.06 26.44 27.64 29.14 0.85 0.85 1.13 1.04 1997 27.97 28.72 28.87 28.95 3.76 3.13 2.36 0.85 2002 24.86 26.50 27.50 29.05 0.65 0.91 0.99 0.95 2004 24.29 26.07 27.22 29.16 0.08 0.48 0.71 1.06 2006 24.99 26.46 27.29 29.03 0.78 0.87 0.78 0.93 2009 24.83 26.85 28.14 29.41 0.62 1.26 1.63 1.31 2014 24.40 26.13 27.18 29.15 0.19 0.54 0.67 1.05 2015 26.26 28.23 29.13 29.62 2.05 2.64 2.62 1.52 60 yr 24.21 25.59 26.51 28.10 Here is 2009 in JAS v. DJF in Nino 3.4 and Nino 1.2 (v. 1951-2010 means)
3.4 1.2
JAS: +0.8 +1.0 net: warmer east by 0.2
DJF: +1.6 +0.6 net: colder east by 1.0
The nature of the event clearly went from east-based to start to Modoki. There is no "slosh back" on the net. This event appears to be doing the exact opposite, since JAS was +0.0 in Nino 1.2, but is warming/about to warm. Nino 3.4 may warm too, its just, on net, the core switched from East to West, and now it is switching from West to East, even if we don't reach basin wide or obviously 1997 status, it is opposite, at least for now.
El Nino exists as a relative difference to the Global and PAC SST, why shouldn't we adjust for warming oceans?
-
1
-
-
The JAS ONI was 0.1. I can't seem to find a single event that started so late which peaked in moderate. Every single one had a JAS of 0.5 or higher.
-
1
-
-
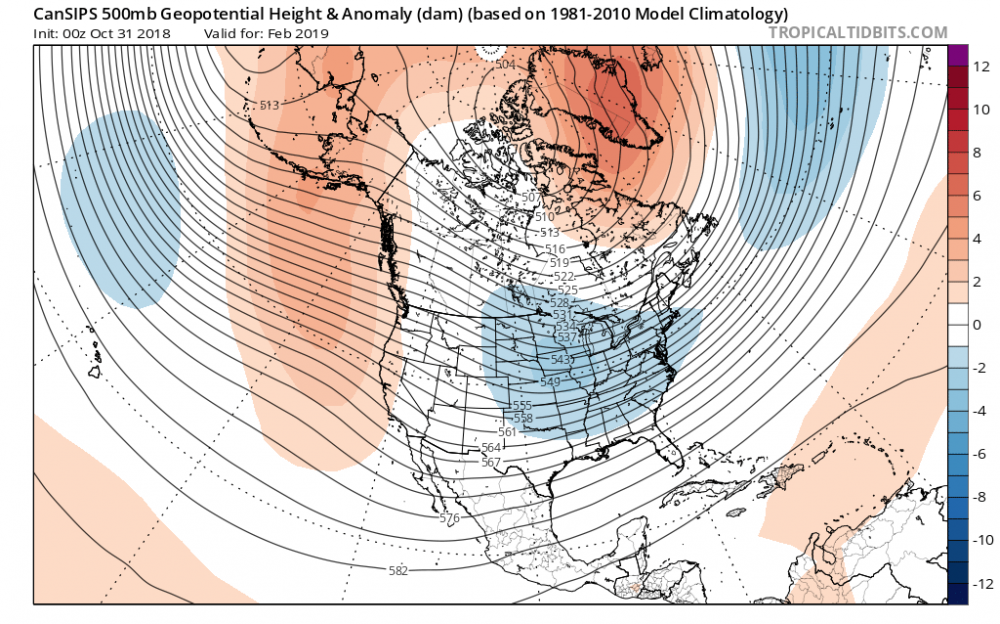
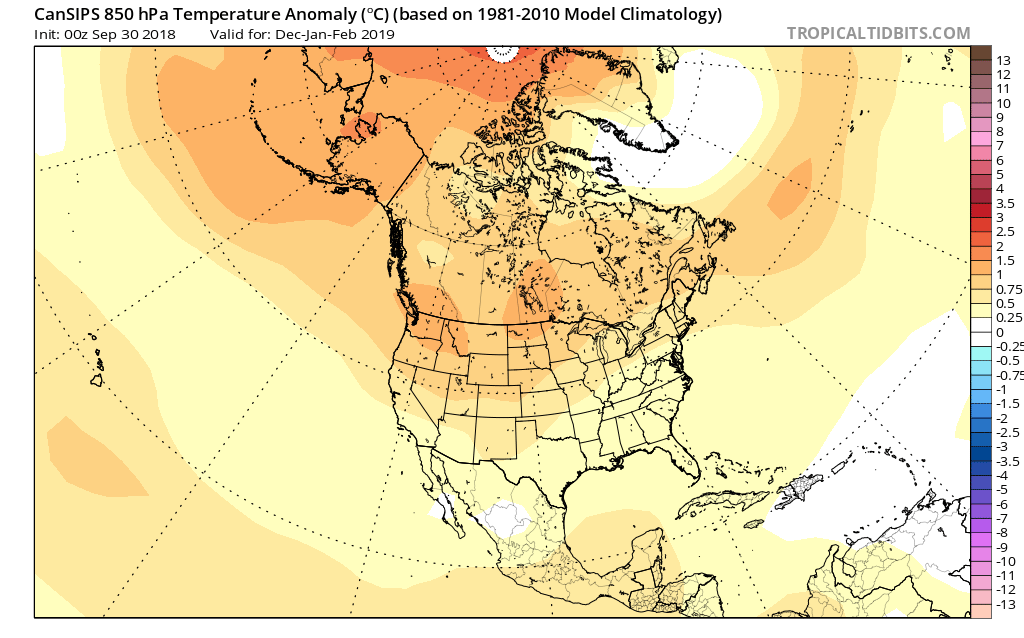
28 minutes ago, 40/70 Benchmark said:
Canadian looks colder for the northeast to me.
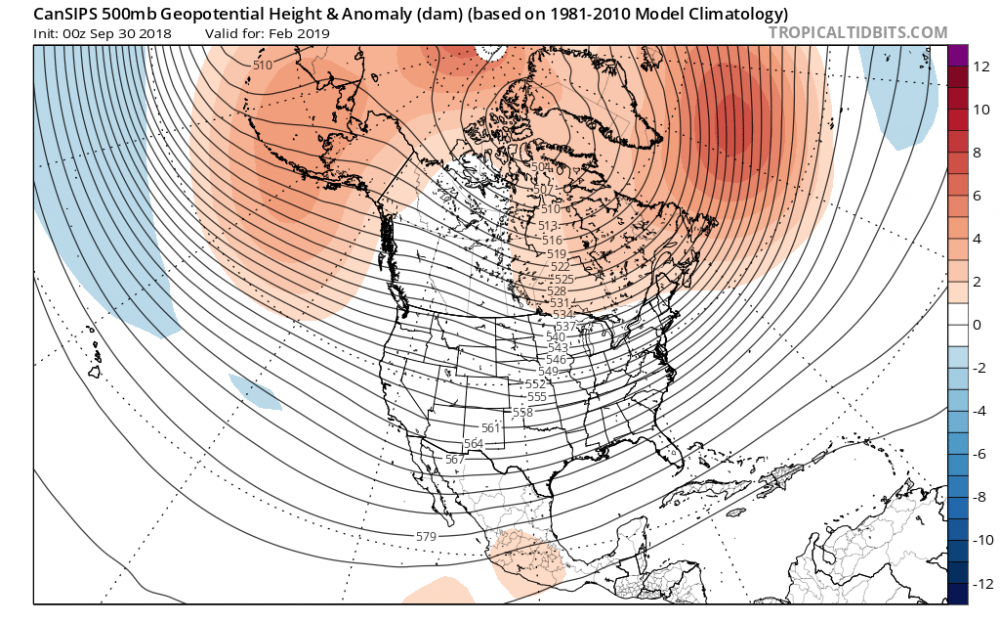
Feb looks a ton better than the previous run but as a whole it the anomalies are similar.
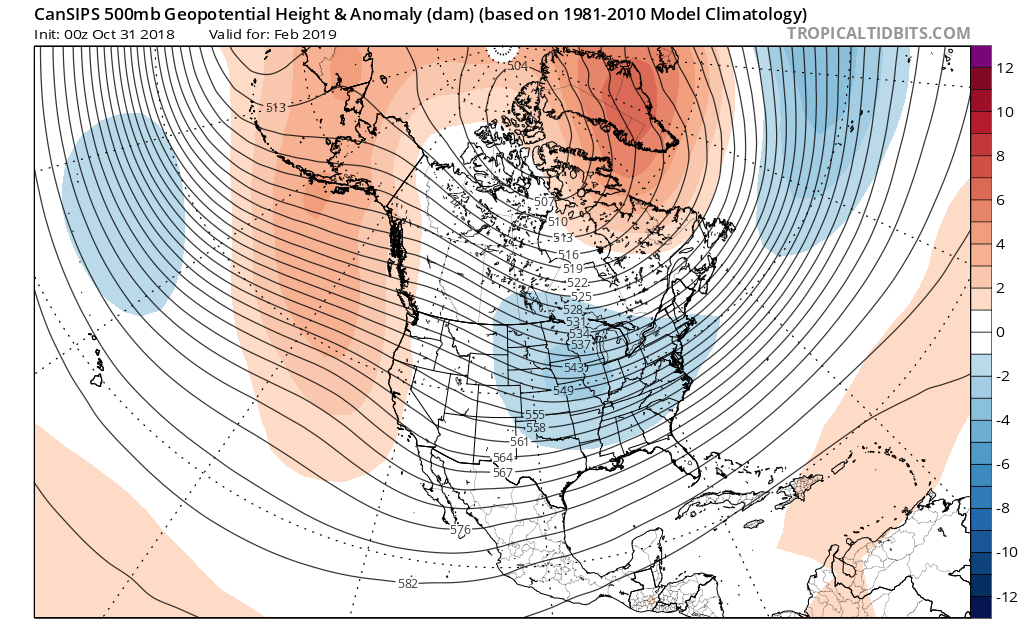
I think the general look is a bit weird after December. The PAC slp and 500mb anomalies dont look particularly nino like even though the SST and convection is there.
-
4 minutes ago, ORH_wxman said:
This should be a pretty good Nino for us. It is west based (some might argue central...but this is a purely semantical argument since it is NOT east based whatsoever) and it is pretty weak to boot.
This historically has been our bread and butter. If there is an ENSO state to get more aggressive and go gangbusters on the snow for SNE, this is it.
Right it's not as central/west as 09/10 but it's definitely more centered in 3.4/4 as opposed to 3/1.2. It's technically not a modoki because Nino 1.2 isn't below normal I think?
-
I noted that the CP Nino events had more AK/Western Canada ridging as the north PAC low is further west. This would help out the northeast for storm threats, I believe. The "fake" -NAO in EP Nino with Canada baking from PAC flow doesn't really help things.
-
3
-


Weak-Moderate El Nino 2018-2019
in Weather Forecasting and Discussion
Posted
It's a weak trough off the west coast in a split flow. It's barely registering as a -pna since the main PNA region in nwt/Yukon. Theres nothing in the 300dm range either.