(002).png.f2cbd7c955dc3007a02ab79925b174ec.png)
ChescoWx
-
Posts
11,477 -
Joined
-
Last visited
About ChescoWx

- Birthday 12/17/1963
Recent Profile Visitors
31,127 profile views









-
Happy Friday! In the past I used to have some folks even here on Americanwx suggest my East Nantmeal Davis VP2 runs too cool (some here used to say the East Nantmeal Icebox etc.) thinking I might have a siting or equipment issue, I ran the numbers. I would welcome any pushback on the method or the results. I used only stations that report on a midnight to midnight day, so morning and evening COOP observation times do not skew the comparison. That gives 20 Chester County Area stations: the DEOS network, KPTW, KMQS, KOQN and the Avondale 2N Climate Reference Network site. Against Avondale USCRN, the best reference we have, over 7,198 days with data from both stations (2007 to now), my highs run 1.4 degrees cooler and my lows run 1.4 degrees warmer. The average difference is +0.01 degrees. That is the classic upland elevation based signature at 678 FT: cooler afternoons, and milder nights as cold air drains off the hill. A poorly sited station usually shows the opposite, with cold nights in a frost hollow or cool afternoons only on sunny days from shade. Across the full network since 2012 my average is 0.68 degrees below the network mean. The USCRN site is 0.63 below, and Warwick DEOS, my nearest neighbor, is 0.56 below. Daily highs line up with elevation at about 5 degrees per 1,000 ft. Mine sit 0.7 degrees below that line, about where the other aspirated sensors (USCRN and the KPTW ASOS) also sit. A cheap passive-shield station on a pole right next to my Davis reads highs 3 degrees warmer, and 3.3 degrees warmer on sunny days. Most backyard stations people compare against use passive shields, so an aspirated sensor will usually look cool next to them in the afternoon. Let me know if any questions or if you see anything that does not hold up (see detail below) as I have always strived to show the most accurate possible data for the climate here in good old Chesco!

-
(002).thumb.png.6e3d9d46bca5fe41aab7a74871dd8af8.png)
E PA/NJ/DE Autumn 2026 Obs/Discussion
ChescoWx replied to PhiEaglesfan712's topic in Philadelphia Region
Happy Friday! In the past I used to have some folks even here on Americanwx suggest my East Nantmeal Davis VP2 runs too cool (some here used to say the East Nantmeal Icebox etc.) thinking I might have a siting or equipment issue, I ran the numbers. I would welcome any pushback on the method or the results. I used only stations that report on a midnight to midnight day, so morning and evening COOP observation times do not skew the comparison. That gives 20 Chester County Area stations: the DEOS network, KPTW, KMQS, KOQN and the Avondale 2N Climate Reference Network site. Against Avondale USCRN, the best reference we have, over 7,198 days with data from both stations (2007 to now), my highs run 1.4 degrees cooler and my lows run 1.4 degrees warmer. The average difference is +0.01 degrees. That is the classic upland elevation based signature at 678 FT: cooler afternoons, and milder nights as cold air drains off the hill. A poorly sited station usually shows the opposite, with cold nights in a frost hollow or cool afternoons only on sunny days from shade. Across the full network since 2012 my average is 0.68 degrees below the network mean. The USCRN site is 0.63 below, and Warwick DEOS, my nearest neighbor, is 0.56 below. Daily highs line up with elevation at about 5 degrees per 1,000 ft. Mine sit 0.7 degrees below that line, about where the other aspirated sensors (USCRN and the KPTW ASOS) also sit. A cheap passive-shield station on a pole right next to my Davis reads highs 3 degrees warmer, and 3.3 degrees warmer on sunny days. Most backyard stations people compare against use passive shields, so an aspirated sensor will usually look cool next to them in the afternoon. Let me know if any questions or if you see anything that does not hold up (see detail below) as I have always strived to show the most accurate possible data for the climate here in good old Chesco!
-
Thank you Canderson!!! You and me both let's keep these kind of posts out of this forum!! Most folks could care less about climate change or alarmism etc.! Thanks again!!
-
Yellow Medicine County, MN - Climate Fact or Climate Fiction?
ChescoWx replied to Cobalt's topic in Climate Change
Again you are using altered post hoc data that is not the actual raw historical data.... -
Go check it out under the appropriate thread - thanks again PSU!
-
The data is now in the appropriate thread - now let the good folks here go back to their autumn obs!! thanks!
-
Yellow Medicine County, MN - Climate Fact or Climate Fiction?
ChescoWx replied to Cobalt's topic in Climate Change
Nope! The raw September trend for 1895–2025 is +0.13°F per decade, and it is not statistically significant (p ≈ 0.10; 95% range −0.03 to +0.29°F per decade). Series °F/decade 95% range p Raw September, 1895–2025 +0.13 ±0.16 0.10, not significant -
Yellow Medicine County, MN - Climate Fact or Climate Fiction?
ChescoWx replied to Cobalt's topic in Climate Change
the altered data adds 60% more warming than the actual data..... -
Yellow Medicine County, MN - Climate Fact or Climate Fiction?
ChescoWx replied to Cobalt's topic in Climate Change
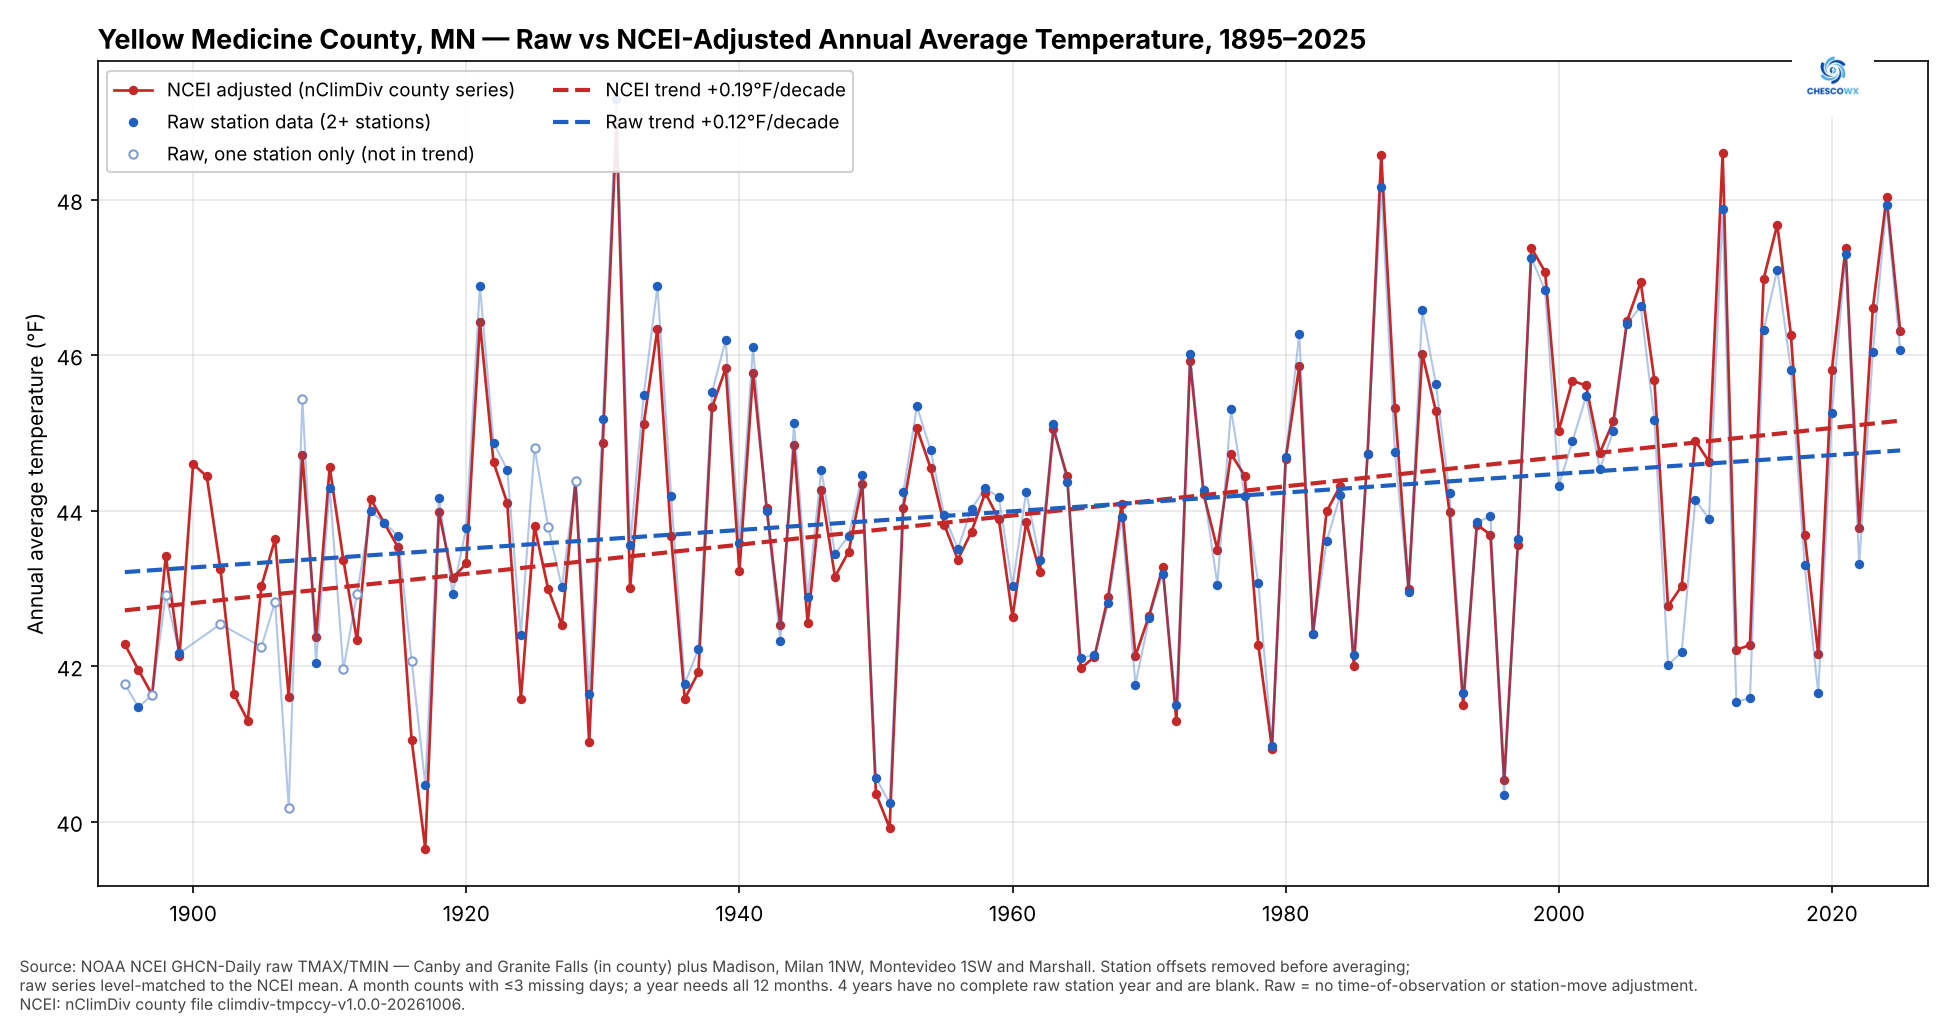
The above data is like most other places sufferring from NCEI altered temperatures which as is usually the case warms the past and chills the current. Below is actual vs altered data for beautiful Yellow Medicine County!! The graph shows 1895–2025: the NCEI adjusted line is in red and the raw station data in blue, each with its trend line. The trend is +0.19°F/decade for NCEI and +0.12°F/decade for raw, so NCEI shows about 60% more warming than the raw data - call me stunned!!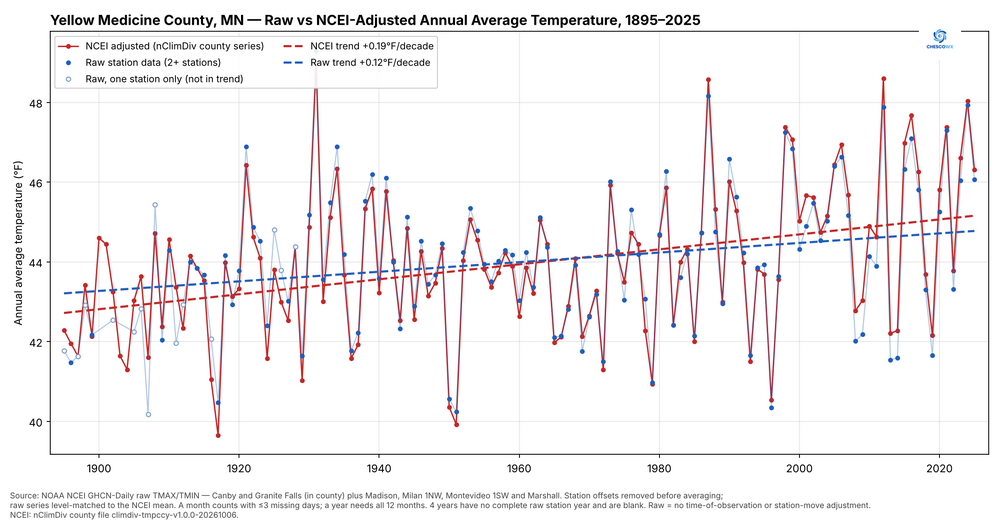
-
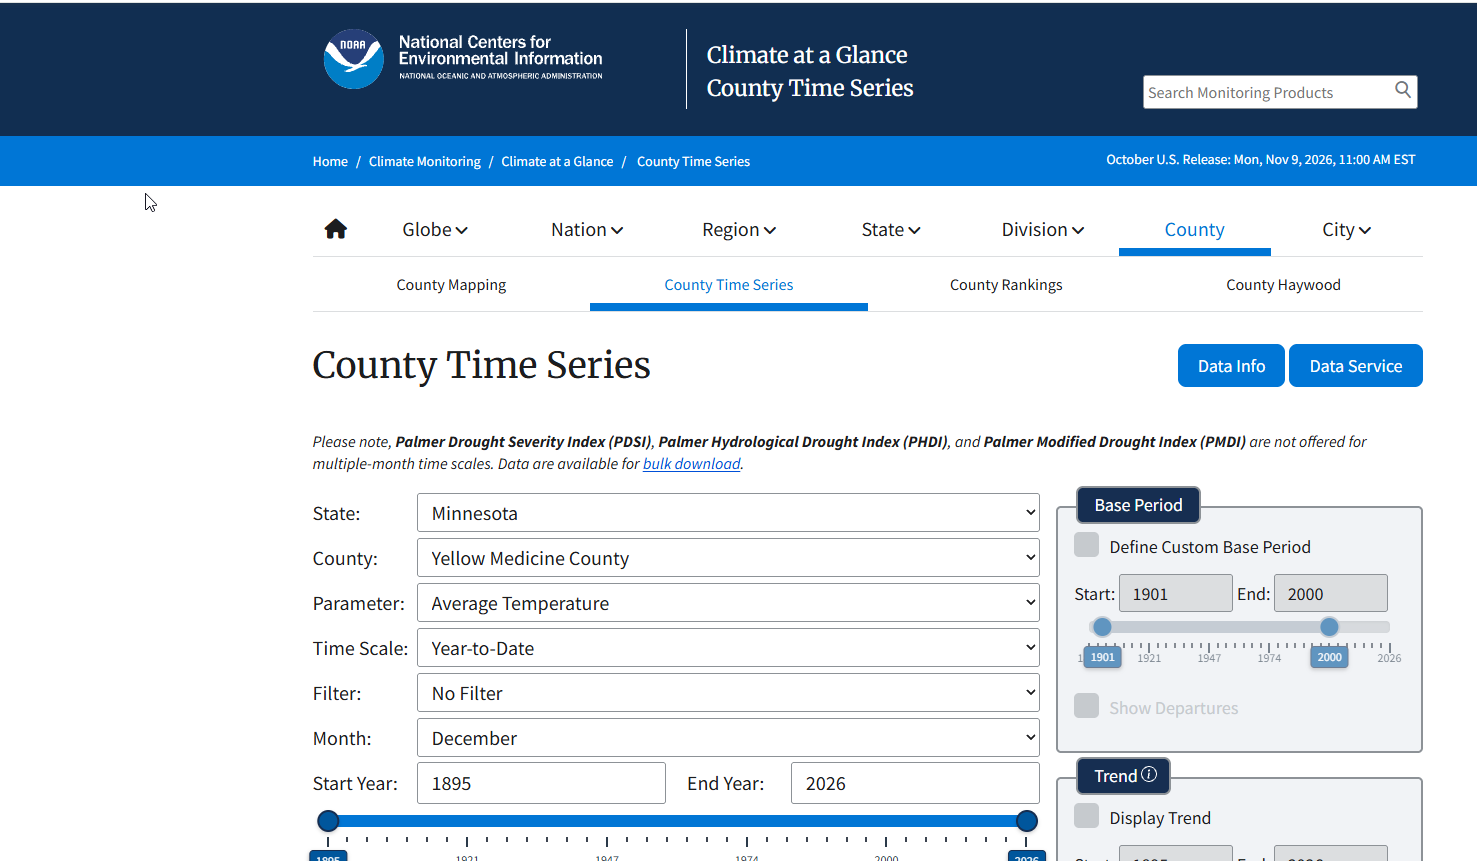
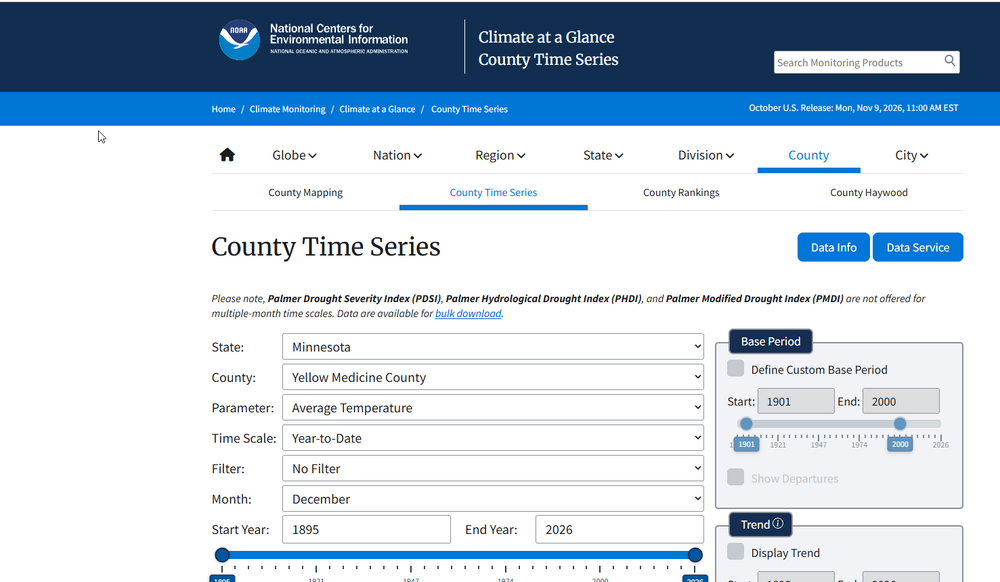
If you got the data from NCEI like below it most certainly is altered adjusted data!
-
Through October 22 - 2026 is warmer than usual but not close to a record. County mean for Oct 1–22: 58.9°F, from 19 stations. That makes it the 34th-warmest of 139 Oct 1–22 periods that had at least 2 stations reporting. The anomaly composite ranks it lower, 53rd of 139 (+1.0°F against each station’s own long-term mean). The gap is mostly because the network has changed over time, which the composite corrects for, so the naive rank flatters 2026 a little. Compared with recent years, it’s warmer than 2019–2020 and 2022–2025, but behind 2016 (59.3°F), 2017 (62.0°F) and 2021 (62.4°F). The record is out of reach. The warmest Oct 1–22 on record is 1941 at 64.7°F, then 2007 (63.8°F) and 1914 (63.0°F). Getting into the top 10 would take about 61°F, more than 2°F above where we are now.
-
Psst! you may not realize but those are altered adjusted temperatures not the actual temps!
-
That great deep data is indeed publically available for all to use with the detailed data sources for support and verification. I hope it helps! Thanks for the support Cobalt!
-
By the way love the page! good luck I am stunned how many folks follow my FB site!
-
Sorry to offend you psu! Take care!!