

Sey-Mour Snow
-
Posts
6,919 -
Joined
-
Last visited
Content Type
Profiles
Blogs
Forums
American Weather
Media Demo
Store
Gallery
Posts posted by Sey-Mour Snow
-
-
-
6 minutes ago, Ginx snewx said:
Always tell your pre storm angst. You get ornery.
Feel the same about your optimism sometimes. Can’t just sit back and smile when the inevitable is right in your face .. I haven’t been wrong yet with every storm falling apart here since 2021.. when things look good I’ll be positive when they don’t I’ll note the possible negatives.
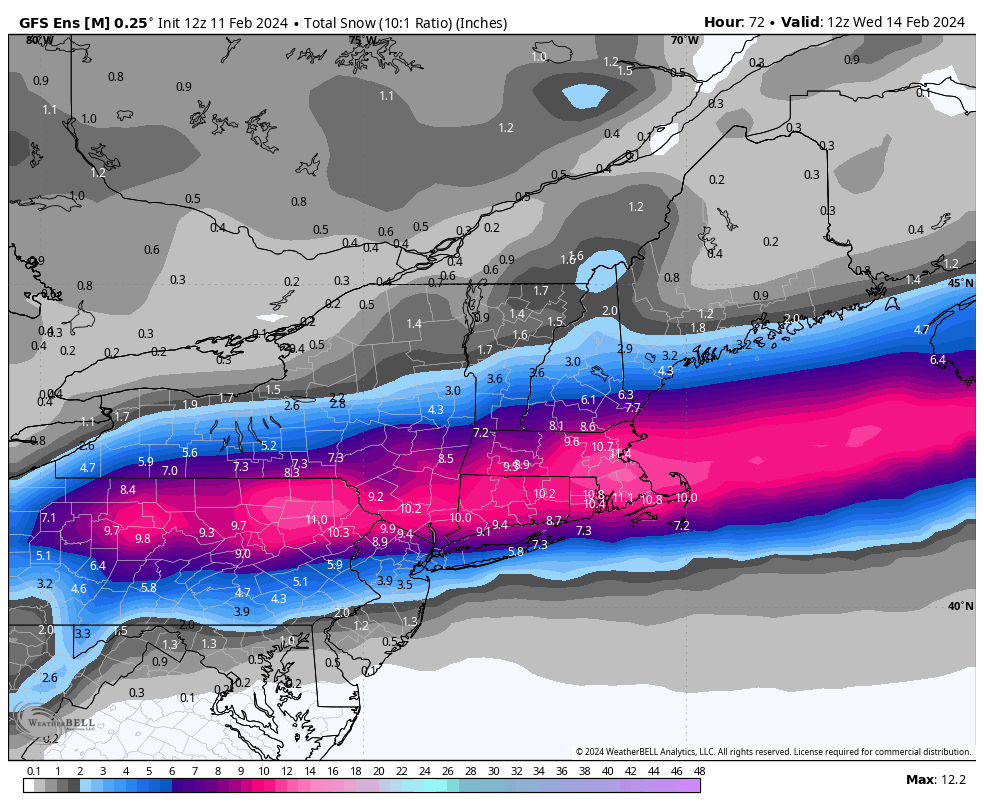
I said pretty clearly I feel pretty damn good and optimistic for a widespread 3”+ south and 6”+ 84 north.
-
 1
1
-
-
Just now, Ginx snewx said:
Save a horse.
ok dude I bet you are sitting back smiling on your horse right now ..
-
Canadian still not biting fully, heavy snow up to pike only.. Weird how slow it's been to buy in
-
1 minute ago, CoastalWx said:
Almost a LBSW look.
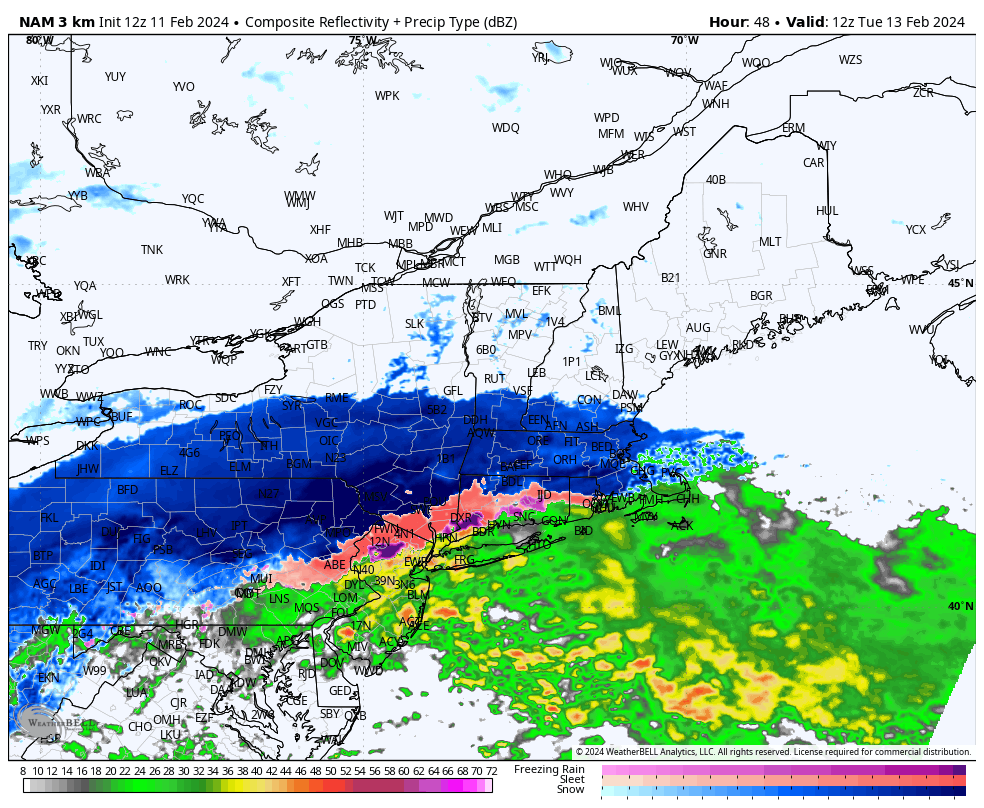
 Ya instead its a LBW look ... Looks like we built a border wall on the CT/NY line
-
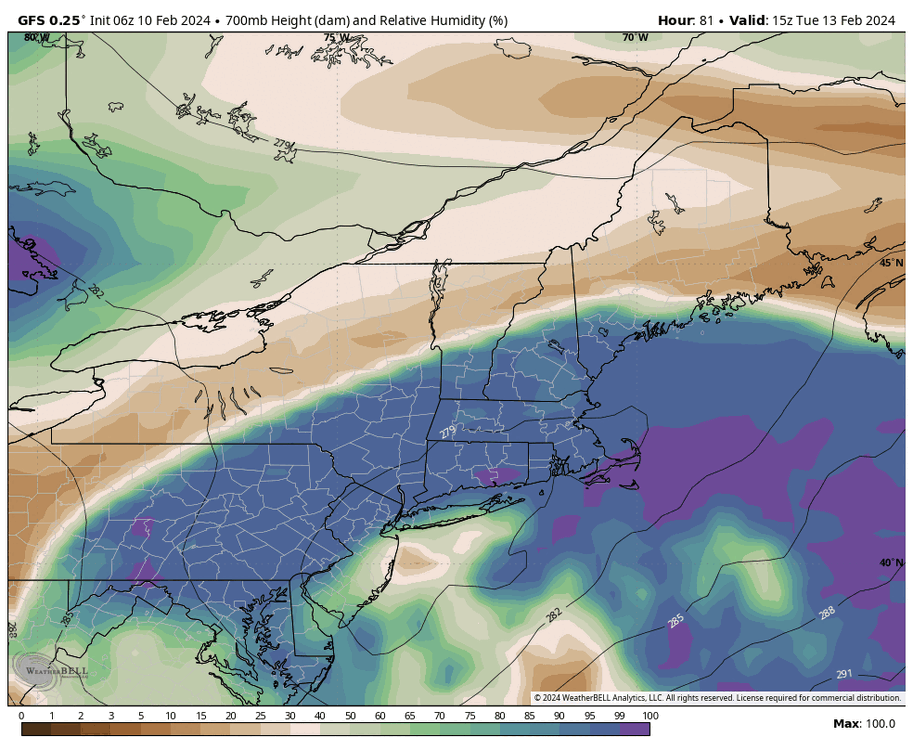
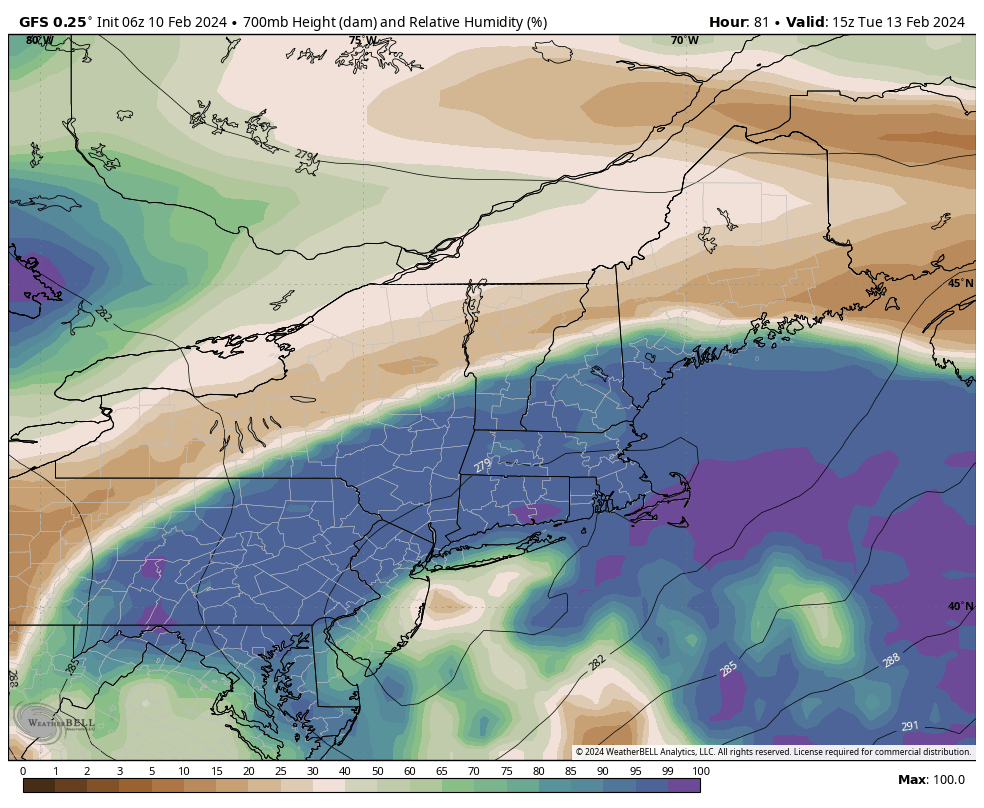
GFS ticked surface / 850 / 700 SE and is cold enough for 95% snow in CT.. just not as much precip .. almost 12km NAM Like
-
 1
1
-
-
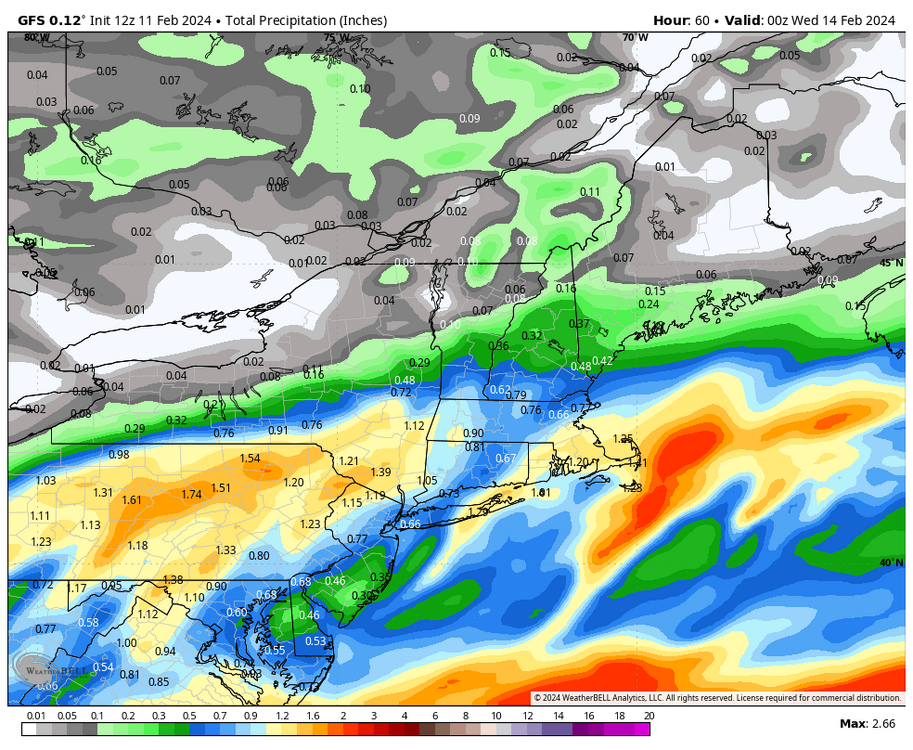
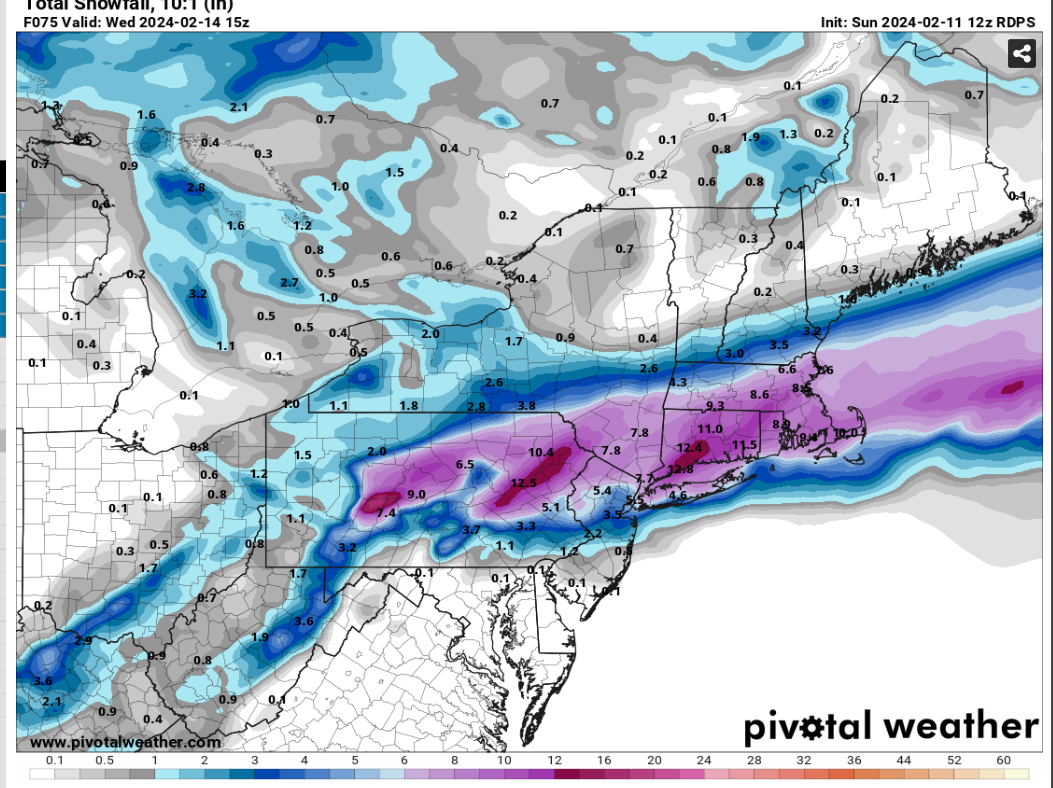
GFS with a messy precip shield , a lot less juicy
-
1
-
-
Just now, RUNNAWAYICEBERG said:
Lol not that bad. You are snake bit. thinking 4-6” with a shot at 8”.
Ya this has a lot higher floor than all the other junk we've seen.. think 3"+ for all then 6" + 84 north .. not your normal coating to 2" until you get to extreme northern CT
-
Just now, ORH_wxman said:
Icon ticked south again so I think we’re starting to converge. N it that we really care about that model but I try to look for trends in the outliers.
It's ticked 200 miles south with the heavy snow axis since 12z yesterday ... Just a Global NAM
-
1
-
-
GFS is a tic South again this run through 30
-
5 minutes ago, Spanks45 said:
Writing has been on the wall since the start of the 22/23 winter...we know how this ends. A mixed bag of a 2-4 inches
A widespread 3" + in southern CT would be the biggest storm since the Jan 22 blizzard miss. I'm pretty optimistic that we do see a widespread 3"+ down here ..
-
1
-
-
15 minutes ago, RUNNAWAYICEBERG said:
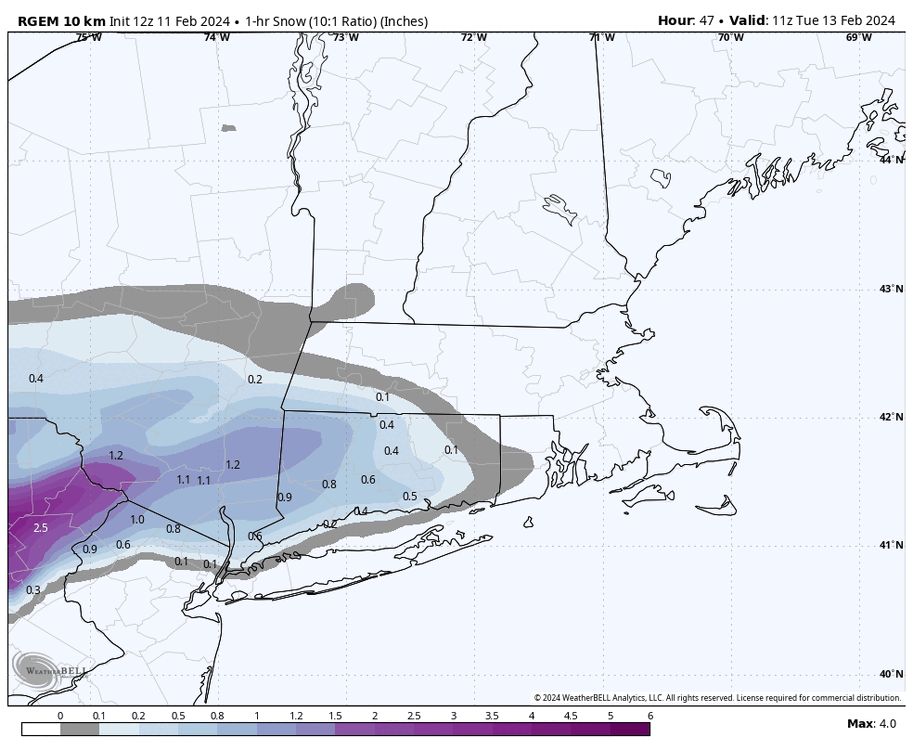
I wish dude but It’s about the trends and not the individual output. Look at the last 4 runs of rgem and guess where it is going next?
Reggie is actually pretty consistent .. 850, 700, and surface lows all in general same spot, that run was just more amped with the goods.
-
5 minutes ago, JKEisMan said:
Rgem seems to be highlighting that same area of enhancement. Looks good overall.

-
1
-
-
Just now, CoastalWx said:
Usually where warmth comes in easiest aloft
I don't see any reason to be conservative with the warm air aloft.. It's going to come flying in and north.. 3km has the right idea
-
Just now, Sey-Mour Snow said:
ya looks just like ICON and the warmest EURO solutions ..
Wild 84 corridor is a degree or two between 700-800 from 12-18" of snow or less than 6"
-
2 minutes ago, Sn0waddict said:
Ugh that 3k trend was not what I wanted to see. Thought we were beginning to trend in the right direction too.
ya looks just like ICON and the warmest EURO solutions ..
-
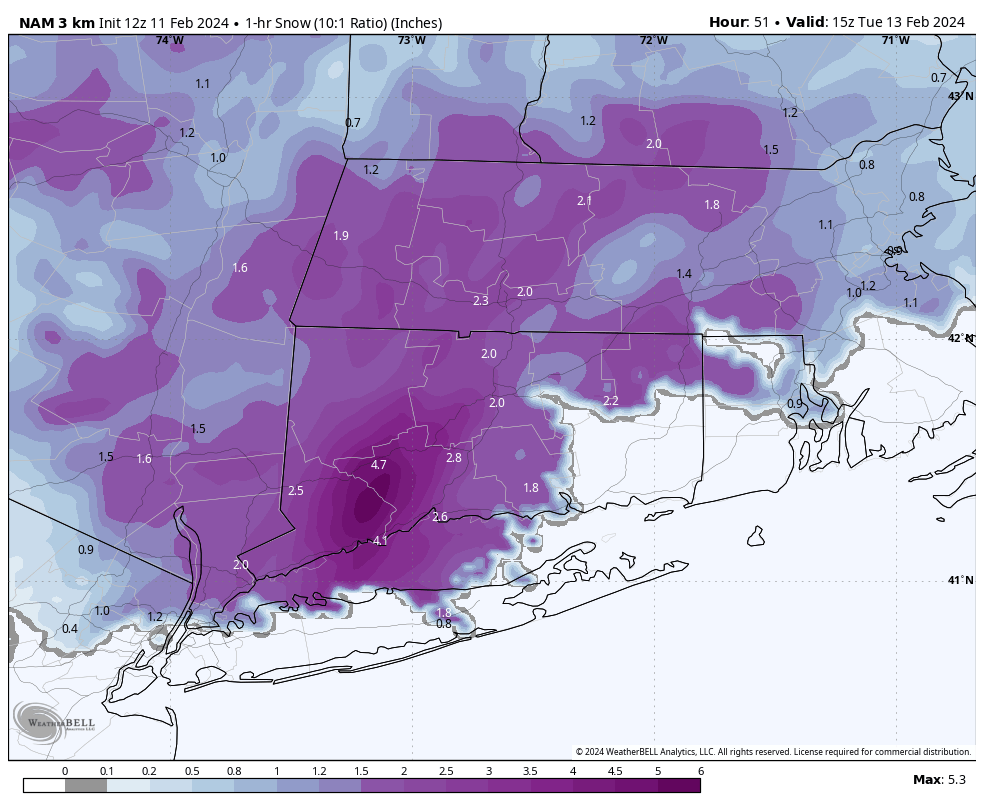
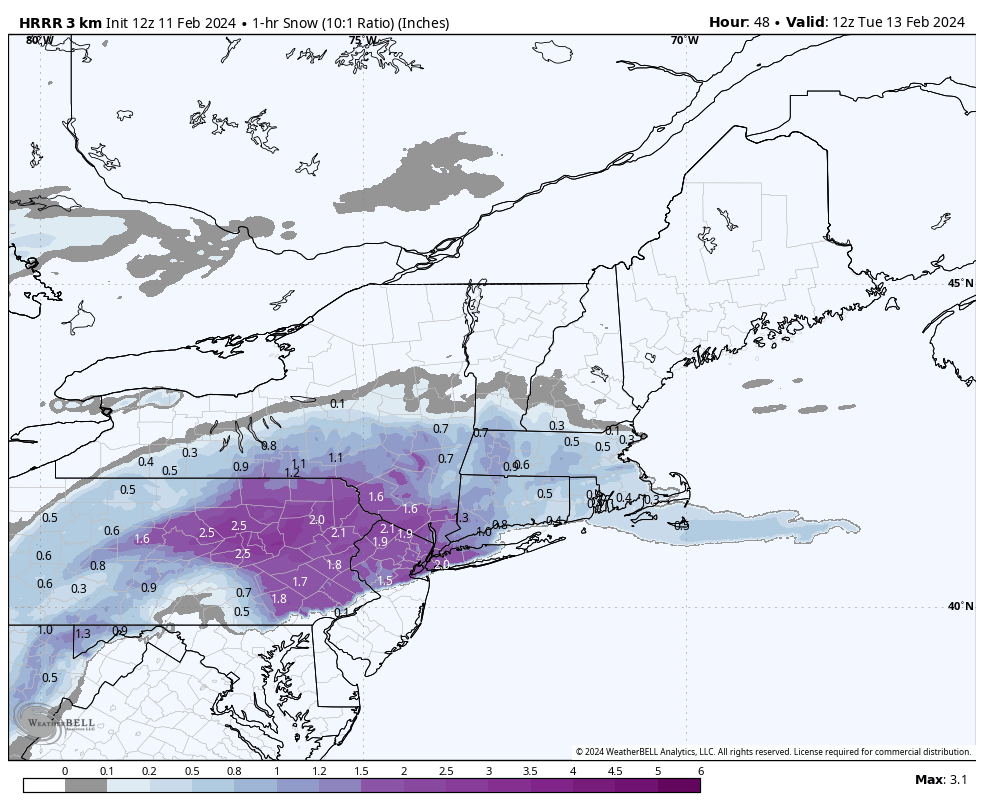
Just ran the 3km NAM 1 hr snow from my basement.. 5.3" of snow in one hour lol.. The 3km snow output total is from only 2-3 hours of snow, not good relying on 6" of snow to accumulate in 2-3 hours with borderline temps..

-
1
-
-
2 minutes ago, CoastalWx said:
3K nam finally what I envisioned it would look like.
Ya I agree, that run makes a lot of sense with the mid level tracks
-
Just now, Sey-Mour Snow said:
 Ya warm nose gets just north of 84 at the peak before crashing down with heavier rates.. would still get 6"+ for most of CT as it pounds right after that.. 12km much cooler..
All guidance is adamant on a rather large band of extremely heavy snow moving through all of SNE..
-
Just now, CoastalWx said:
It’s warm in a lot of CT/RI/SE MA.
Ya warm nose gets just north of 84 at the peak before crashing down with heavier rates.. would still get 6"+ for most of CT as it pounds right after that.. 12km much cooler..
-
1
-
-
12 minutes ago, ORH_wxman said:
Hrrr is pound town for CT Tuesday morning.
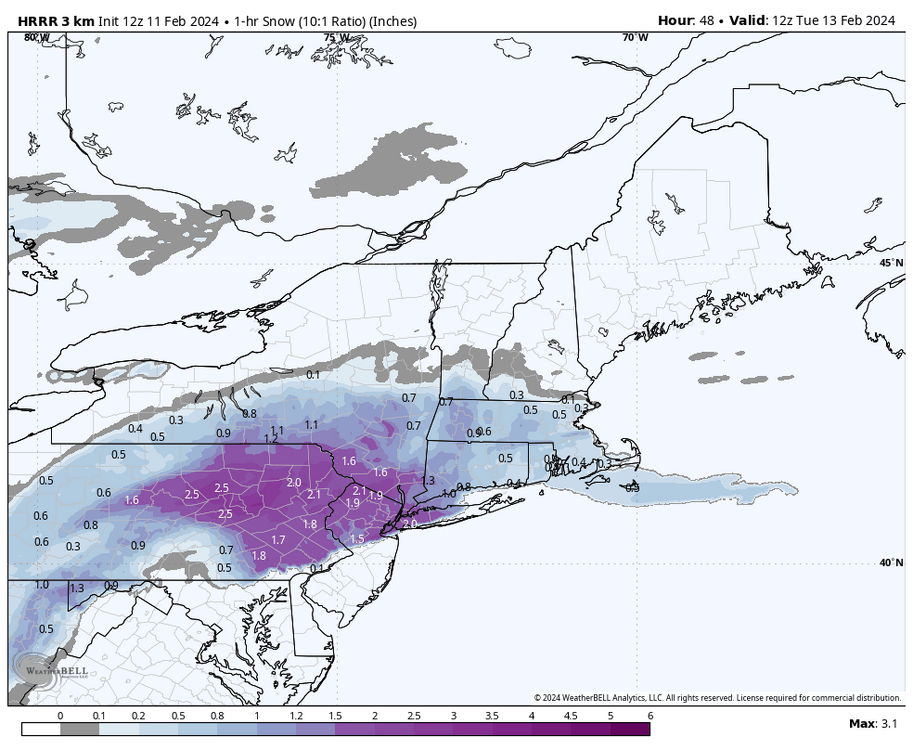
If we can lock this in verbatim I'll forgive this winter forever. Would be 2-3"+ for several hours in daylight.. Too bad its long range hrrr..
-
4 minutes ago, RUNNAWAYICEBERG said:
H7 keeps trending north though. Looks like it tracked along the southern half of the state so we’ll need a bump or two south tomorrow.
Def would love a tic south at go time from this
-
5 minutes ago, WinterWolf said:
I’ll take my 12+ thanks. Steady as she goes. So dam consistent.
Ya gfs has been so consistent . Would be awesome for it to score a coup
-
2 minutes ago, RUNNAWAYICEBERG said:
It’s amped but not a rainer lol.
Ok not bad just loaded for me


Following a Miller A/B hybrid type coastal potential, Feb 13th ... As yet untapped potential and a higher ceiling with this one
in New England
Posted
I agree