

SACRUS
-
Posts
16,202 -
Joined
-
Last visited
Content Type
Profiles
Blogs
Forums
American Weather
Media Demo
Store
Gallery
Posts posted by SACRUS
-
-
69 / 56 clear out. Into the cool we descend. Period of onshore and cooler with potential localized (much discussed) rain from influences of Erin Wed-Thu (AM). Beyond there drier and another (5th or 6th in a row) nice weekend coming up. Riding near to slightly below normal Thu - Sun. Front arrives and late Sunday and overnight into Monday then trough into the northeast Mon - most of next week. Some moderation towards the close of the month but likely the reversal waits till the last day of August to shift warmer and beyond.
8/19 - 8/21 : Cooler / Rain localized Erin influenced/enhances Wed/Thu. (north)
8/22 - 8/24 : Near normal - great dry weekend
8/25 : Front - storms next chance after the Wed/Thu AM Erin rain.
8/26 - 8/30 : Trough - cooler - perhaps wetter overall
8/31 - Beyond : Ridge building east - Warmer overall
-
2 hours ago, winterwarlock said:
74 for high
Coldest day since 69 on 6/27
8 day heatwave comes to a crashing end
No midnight/1AM max, what was your temp split on AUg 1st?
-
Highs for some midnight/1AM maxes and overall coolest day since Aug 1st
EWR: 78
ISP: 78
JFK: 78
LGA: 77
PHL: 77
NYC: 76
TEB: 76
BLM: 75
New Brnswck: 74
ACY: 74
TTN: 73
-
-
2 hours ago, Sundog said:
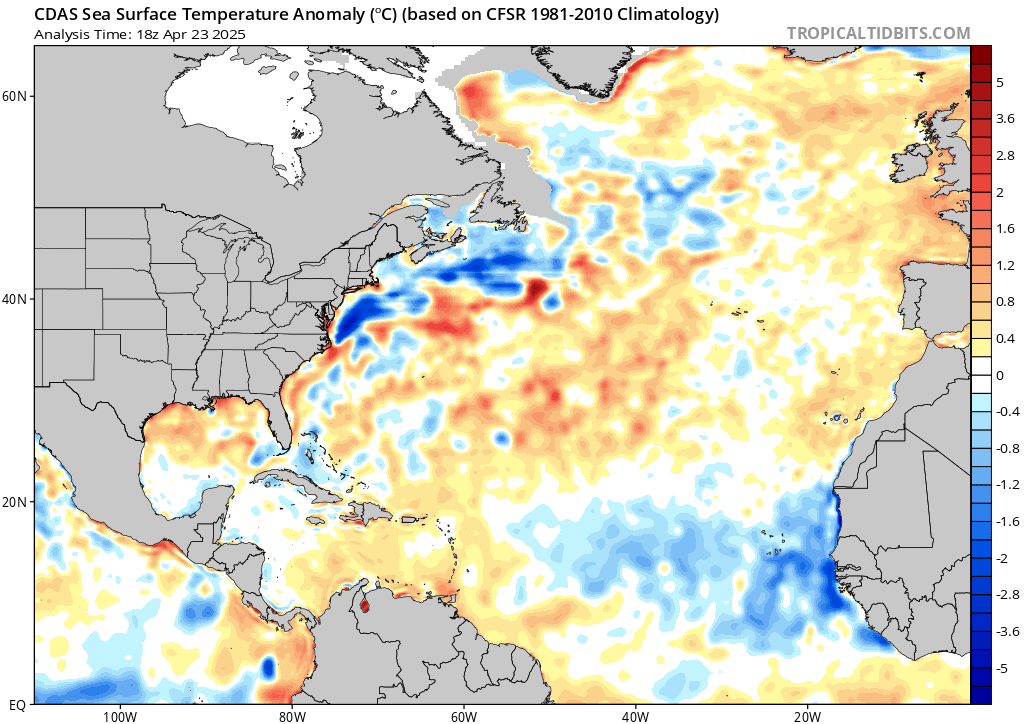
It's weird to see Hudson Bay below normal, what caused that this year?
Im not sure but suspect they might have seen plenty of cloud cover this month.
-
Some clearing slowly working its way down
73 / 58 socked in clouds but some brightening
-
Erin;s wake cooling things a bit - we'll see how this looks next week
-
22 minutes ago, donsutherland1 said:
A cooler regime is now in place and it will remain in place for an extended period of time. Here's where things currently stand with respect to select high temperature thresholds for 2025:
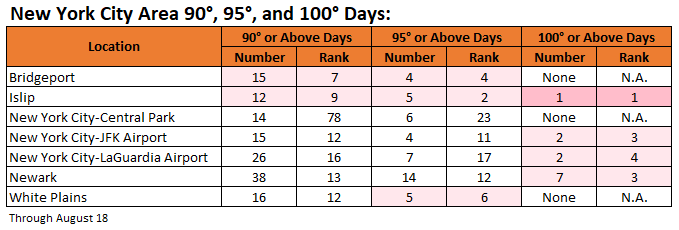
Thanks, Don
technically (due to ties)
EWR:
90 degree days: 38 (7th place)
95 degree days: 14 (7th place)
100 degree days: 7 (3rd place)
Year Rank Days >= 100 °F 1993 1 9 1949 2 8 2025 3 7 2022 4 6 1953 4 6 1988 5 5 1966 5 5 Year Rank Days >= 95 °F 1993 1 25 2010 2 21 2022 3 20 1988 3 20 1944 3 20 2021 4 18 2012 5 17 2011 5 17 2002 5 17 1955 5 17 1949 6 16 2005 7 14 1953 7 14 2025 7 14 Year Rank Days >= 90 °F 2010 1 54 2022 2 49 1993 2 49 1988 3 43 2021 4 41 2002 4 41 1991 4 41 2016 5 40 1983 5 40 1959 5 40 1994 6 39 1944 6 39 2025 7 38 -
 1
1
-
-
We'll see how low these go over the next 14 days
Aug dep through 8/17
EWR: +0
NYC: -0.2
JFK: -0.9
LGA: -1.0
-
2
-
-
Records:
Highs:
EWR: 97 (2002)
NYC: 94 (2002)
LGA: 95 (2002)
JFK: 93 (1995)
Lows:
EWR: 52 (1941)
NYC: 55 (1915)
LGA: 59 (1941)
JFK: 58 (1963)
Historical:1779: William Dunbar observed and wrote about the passage of a hurricane's eye over New Orleans. (Ref. AccWeather Weather History)
1879: This storm is often called "The Cape Cod Hurricane of 1879" An extreme hurricane moved north and went on the rampage from the Bahamas to Eastport, Maine (track to the right). In the immediate Mid-Atlantic region, the track of this storm ran very close to a Wilmington - Elizabeth City, NC axis to just southeast of Norfolk. It was considered one of the most severe to strike coastal Virginia in the last half century and was probably as severe as the June 1825 storm. The passage of this storm was accompanied by a rapid pressure fall from 29.58 inches at 9:00 am to 29.12 inches at 11:15 am on the 18th, which was the lowest pressure observed in the storm. Five-minute sustained winds rose to 76 mph with gusts toward 100 mph at Cape Henry, before the anemometer was destroyed. (Ref. for 1879 Hurricane)
1906: Unusual tropical storm came up into the Gulf of California, giving Needles, California 5.66 inches of rain, twice what would normally be seen in a year. (Ref. AccWeather Weather History)
1909: Bagdad, in San Bernardino County of California, reported no precipitation for 993 consecutive days from this date to 5/6/1912. (Ref. Wilson Wx. History)
1917: The high temperature in Death Valley, CA was 119°. This ended a record streak of 43 consecutive days with the high temperature 120° or hotter. (Ref. Wilson Wx. History)1925 - During the late morning hours a severe hailstorm struck southeastern Iowa completely destroying crops along a path six to ten miles wide and 75 miles long. The hail also injured and killed poultry and livestock, and caused a total of 2.5 million dollars damage. The hailstorm flattened fields of corn to such an extent that many had to leave their farms in search of other work. It was one of the worst hailstorms of record for the nation. (The Weather Channel)
1936: An average of the temperatures at 113 reporting stations in Iowa measured 106.5°, making this the hottest day in the state's history as of this date. (Ref. AccWeather Weather History)
1943: Autumn was in the air with record low temperatures of 41° at Grand Rapids, MI and 43° at Muskegon, MI. (Ref. Wilson Wx. History)
1953: Four heifers near St. Martin, MN were lucky. A tornado picked them up and set them back down again, unharmed. (Ref. AccWeather Weather History)
1955: Diane crossed MD gave 1.09 inches of rain on 18th & brought flooding because of the heavy rain by the earlier storm Connie. Hurricane Diane became the second hurricane to strike the United States East Coast in less than a week. Diane weakened as it crossed colder water left in the wake of Hurricane Connie, but the rainfall did not diminish. The storm moved across the North Carolina coast then recurved to the northeast, passing very near Philadelphia, PA then to the southern coast of New England. Diane's heavy rains, up to 13 inches in the Poconos, added to those of Connie 5 days earlier, brought massive flooding to the Mid Atlantic and the northeast. Westfield, MA recorded 18.15 inches of rain in just 24 hours to establish the 24 hour mark for the state. Boston, MA had 8.40 inches, their greatest 24 hour total ever. At one point, 40% of Worcester, MA was under water. Up to 200 people were killed with $800 million dollars in damage.(Ref. AccWeather Weather History) (The Weather Channel) (More Information About Diane) Diane's Storm Track - NOAA. Gov. - National Hurricane Center
1980: Three inches of snow fell at McCall, ID, a sign of the changing seasons. (Ref. AccWeather Weather History)1983 - Hurricane Alicia ravaged southeastern Texas. The hurricane caused more than three billion dollars property damage, making it one of the costliest hurricanes in the history of the U.S. Just thirteen persons were killed, but 1800 others were injured. The hurricane packed winds to 130 mph as it crossed Galveston Island, and spawned twenty-two tornadoes in less than 24 hours as it made landfall. (The Weather Channel) (Storm Data)
1987 - Thirteen cities in the eastern U.S. reported record high temperatures for the date, including Orlando FL with a reading of 98 degrees, and Portland ME with a high of 94 degrees. Newark NJ reached 90 degrees for the thirty-sixth time of the year, their second highest total of record. (The National Weather Summary)
1988 - Twenty-two cities, from the Carolinas to the Upper Ohio Valley, reported record high temperatures for the date, pushing the total number of daily record highs since the first of June above the 1100 mark. Afternoon highs of 102 degrees at Greensboro NC and 105 degrees at Raleigh NC equalled all-time records. Evening thunderstorms in Montana produced wind gusts to 75 mph at Scobey. (The National Weather Summary) (Storm Data)
1989 - Thunderstorms over the Middle Atlantic Coast Region and the Upper Ohio Valley produced torrential rains in eastern Virginia during the late morning and afternoon hours. Totals ranged up to twelve inches at Yorktown. Williamsburg VA was deluged with 10.78 inches of rain between 6 AM and 10 AM, with 6.72 inches reported in just two hours. Flash flooding caused nearly twelve million dollars damage in Accomack County VA. Early evening thunderstorms in the Central High Plains Region produced walnut size hail and wind gusts to 80 mph around Casper WY. Thunderstorms produced locally heavy rains in the Yellowstone Park area, causing fifteen mudslides. (The National Weather Summary) (Storm Data)
1993: A squall line developed across western Iowa sending damaging winds over the west central portion of the state for a brief time. A tornado touched down west of Breda causing extensive damage to a farmstead and minor damage to another. Also, an 80 foot barn was destroyed by the tornado. High winds from the storm also overturned a tractor semi-trailer north of Carroll and caused extensive crop damage in the area. (Ref. Wilson Wx. History)
1994: Residents who were in the path of the 1994 Lahoma storm in Oklahoma, awoke on this morning to find a strange world. The devastating wind and hail storm on the previous day had stripped nearly every tree of leaves in the Lahoma and Drummond areas. That, along with plowed fields from harvested wheat, left the August landscape looking eerily more like mid winter. Hail was still on the ground in some protected areas around Lahoma more than 24 hours after the storm. (Ref. Wilson Wx. History)
2005: 27 tornadoes were documented in WI today, thus establishing its record for the greatest number of tornadoes reported in a calendar day. Most were F0 or F1, but an F3 storm killed 1, hurt 23 between Fitchburg and Rockdale. 4 other injuries reported.
(Weather Guide Calendar with Phenomenal Weather Events 2011 Accord Pub. 2010, USA) (More Information About These Storms)
2008: During seven days in Florida, August 18–24, 2008, eleven people died and thousands of homes plus roads were damaged, from 60 mph winds and flooded rivers or tornadoes, as Fay traveled through the entire state. Fay was the first storm on record to hit the same U.S. state on four separate occasions, beating a record set by Hurricane Gordon of 1994, It was just the third storm on record to hit the U.S. at least 3 times. Fay was also the first storm to prompt storm warnings for the entire coast of Florida. The four separate landfalls were responsible for every stretch of the Florida coast to receive a Tropical Storm Watch or Warning, or a Hurricane Watch or Warning. The two highest rainfall amounts recorded were 27.65 inches at Windover Farms, 8 miles northwest of Melbourne, Florida, and 27.50 inches at Thomasville, Georgia. The amount of total insured damage compiled by the Property Claim Services of the Insurance Services Office, Inc., was $245 million dollars. This includes $195 million in Florida, $25 million in Georgia, and $25 million in Alabama. Flood damage losses reported by the National Flood Insurance Program were about $36 million dollars. Using a doubling of insured losses to obtain the total damage gives an estimate of Fay’s damage in the United States of about $560 million dollars. Fay's Storm Track - Weather Underground
(More Information About Hurricane Fay) (Ref. WxDoctor) -
67 / 56 and the coolest - cloudiest day (as a whole) since Aug 1st with the NE / ENE flow and cloud bank socked and locked in. Low 70s today and maybe some glimmers of sun later on - stiff breeze. Mainly 70s Tue / Wed with some 80 / low 80s inland. Erin goes on by with some heavy surf and scattered showers Wed-Thu. Warmup by Friday and this coming weekend, before trough settles in next Monday. Ridge builds east and heights rising the close of the month with the next chance at some heat wit overall warm-hot beyond.
8/18 - 8/21 : Cooler below normal - scattered rain Wed/Thu
8/22 - 8/24 : Warmer - near normal
8/25 - 8/29: Cooler / Wetter overall
8/30 - BeYond : Warm - hot
-
2
-
-
On 4/26/2011 at 9:17 AM, SACRUS said:
2025:PHL: 36 (Apr: ; May: ; Jun: 9 ; Jul: 21 ; Aug: 6; Sep: )
EWR: 38 (Apr: ; May: ; Jun: 10 ; Jul: 20 ; Aug: 8 ; Sep: )
TTN: 19 (Apr: ; May: ; Jun: 6 ; Jul: 9 ; Aug: 4; Sep: )
LGA: 26 (Apr: ; May: ; Jun: 8; Jul : 12; Aug: 6 ; Sep: )
ACY: 19 (Apr: ; May: ; Jun: 9 ; Jul: 9 ; Aug: ; Sep: )
TEB: 34 (Apr: ; May: ; Jun : 10 ; Jul: 16 ; Aug: 8 ; Sep: )
NYC: 14 (Apr: ; May: ; Jun: 4; Jul: 7; Aug: 3; Sep: )
JFK: 15 (Apr: ; May: ; Jun: 7; Jul: 8; Aug: ; Sep: )
ISP: 12 (Apr: ; May: ; Jun: 5 ; Jul: 7 ; Aug: ; Sep: )New Brunswick: 25 (Apr: ; May: ; Jun: 9 ; Jul: 13 ; Aug: 3; Sep: )
BLM: 14 (Apr: ; May: ; Jun: 6 ; Jul: 9; Aug: ; Sep: )89 Degree Days:
New Brnswck: 9
TTN: 6
TEB: 5
BLM: 3
EWR: 1
NYC: 8
ACY 3
ISP: 5
JFK: 1
LGA: 2
PHL: 2
Highs:
EWR: 96
TEB: 94
New Brnswck: 94
PHL: 93
BLM: 93
TTN: 93
LGA: 91
NYC: 91
ACY: 89
ISP: 86
JFK: 85-
1
-
-
Highs:
EWR: 96
TEB: 94
New Brnswck: 94
PHL: 93
BLM: 93
TTN: 93
LGA: 91
NYC: 91
ACY: 89
ISP: 86
JFK: 85-
2
-
-
So far very north for later, early still and would expect some islaoted - scattered into the area
-
1
-
-
82 / 72 signifying a high in the 91 - 93 range here. What a stretch of weather and 3 or 4 weekends in a row after the other stretch.
-
1
-
-
7 minutes ago, steve392 said:
The low off the carolina coast, is that supposed to develop at all?
Not likely and it heads out ahead of Erin.
-
1
-
-
Next wave behind Erin with a 20% chance to develop. GFS had been tracking this towards FL or the Gulf on much of the last 6 or 7 runs. Can also see the low spinning on the vis sat loop off of SC

-
1
-
-
Records:
Highs:
EWR: 97 (2015)
NYC: 95 (2015)
LGA: 94 (1944)
JFK: 94 (1978)
Lows:
EWR: 55 (1979)
NYC: 56 (1979)
LGA: 58 (1979)
JFK: 56 (1979)
HIstorical:1784: Two tornadoes in Southington, CT. "It seems to have been occasioned by the meeting of two heavy clouds, one from the south and the other from the north. The whole storm therefore collected with amazing blackness and centered at the place above mentioned; producing such a scene of desolation, as perhaps the memory of the oldest man cannot recollect to have been produced by a similar cause in New England. (Ref. Connecticut Courant (Hartford), August 24, 1784.)
1885: 130 °F on this date in Amos, CA. It's never been hotter in the U.S. in August. (Ref. AccWeather Weather History)1899: Hurricane San Ciriaco set many records on its path. Killing nearly 3,500 people in Puerto Rico, it was the deadliest hurricane to hit the island and the strongest at the time, until 30 years later when the island was affected by the Hurricane San Felipe Segundo, a Category 5 hurricane, in 1928. It was also the tenth deadliest Atlantic hurricane ever recorded. San Ciriaco is also the longest lasting Atlantic hurricane in recorded history, continuing for 28 days. On August 17, the hurricane turned back to the northwest and made landfall near Hatteras, North Carolina on the following day. San Ciriaco remains the strongest hurricane to make landfall on the Outer Banks since 1899.
1915 - A hurricane hit Galveston, TX, with wind gusts to 120 mph and a twelve foot storm surge. The storm claimed 275 lives, including forty-two on Galveston Island, with most deaths due to drowning. Of 250 homes built outside the seawall (which was constructed after the catastrophic hurricane of 1900), just ten percent were left standing. (The Weather Channel)
1917: Death Valley, California: The day's high temperature registers the 43rd consecutive day with a temperature exceeding 120 °F and the last in the run. The streak began on July 17. (Ref. WxDoctor)
1944: Boston, Massachusetts had its longest heat wave of 8 days from August 10th to the 17th. (Ref. NOAA Boston Weather Events)1946 - An estimated F-4 tornado killed 11 people and injured 100 others in the Mankato, Minnesota area around 6:52 PM. The deaths and most of the injuries occurred in the complete destruction of the 26 cabins at the Green Gables tourist camp, 3 miles southwest of Mankato. A 27-ton road grader was reportedly hurled about 100 feet. Another tornado an hour later destroys downtown Wells, Minnesota.
1969: The music festival, known as Woodstock, should have ended on this day. Jimi Hendrix, the last act to perform, was delayed due to rain on Sunday evening. Jimi Hendrix took the stage at 8:30 am Monday morning.
1967: The "Sundance Fire" in northern Idaho was started by lightning. Winds of 50 mph carried firebrands as much as 10 miles in advance to ignite new fires, and as a result, the forest fire spread 20 miles across the Selkirk Mountains in just 12 hours, burning 56,000 acres. The heat of the fire produced whirlwinds of flame with winds up to 300 mph which flung giant trees about like matchsticks. (Ref. Wilson Wx. History)1969 - Camille, the second worst hurricane in U.S. history, smashed into the Mississippi coast. Winds gusted to 172 mph at Main Pass Block LA, and to 190 mph near Bay Saint Louis MS. The hurricane claimed 256 lives, and caused 1.3 billion dollars damage. Several ocean going ships were carried over seven miles inland by the hurricane. The hurricane produced winds to 200 mph, and a storm surge of 24.6 feet. Complete destruction occurred in some coastal areas near the eye of the hurricane. (David Ludlum) (The Weather Channel)
1979: Record cold occurred from the Deep South to New England. Frost was observed in the mountains of West Virginia. Albany, NY: 40°, Concord, NH: 40°-Tied, Elkins, WV: 41°, Burlington, VT: 42°-Tied, Avoca, PA: 43°, Sterling (Dulles Airport), VA: 44°, Syracuse, NY: 44°, Williamsport, PA: 45°, Hartford, CT: 45°, Atlantic City, NJ: 46°, Allentown, PA: 46°, Rochester, NY: 46°, Roanoke, VA: 48°, Charleston, WV: 48°, Harrisburg, VA: 48°, Philadelphia, PA: 50°, Baltimore, MD: 53°, Charlotte, NC: 55°, Richmond, VA: 56°, NYC (Central Park), NY: 56 °F. (Ref. Many Additional Temperatures Listed On This Link)
1979:5 to 7 inches of rain fell across the North Concho River north of San Angelo, TX causing the River to rise 15 feet. Rising waters nearly swept away several campers. (Ref. Wilson Wx. History)
1981: 6.89 inches of rain fell at Caribou, Maine for its greatest 24 hour rainfall on record. (Ref. Wilson Wx. History)1987 - Evening thunderstorms produced severe weather in the Northern and Central Plains Region. One thunderstorm spawned a tornado near Fairbury NE, along with baseball size hail and wind gusts to 100 mph, causing severe crop damage west of town. Ten cities in the eastern U.S. reported record high temperatures for the date. Syracuse NY hit 97 degrees for the first time in twenty-two years. (The National Weather Summary) (Storm Data)
1988 - Fifty-five cities, from the Middle Mississippi Valley to the Middle Atlantic Coast Region, reported record high temperatures for the date. Beckley WV reported an all-time record high of 96 degrees, and Baltimore MD hit 104 degrees, marking their thirteenth day of the year with 100 degree heat. Chicago IL equalled a record with 46 days of 90 degree weather for the year. Thunderstorms produced severe weather from Wisconsin to New Jersey. Thunderstorms in New Jersey produced high winds which gusted to 92 mph at Wrightstown, and blew down a circus tent at Lavallette injuring fourteen persons. (The National Weather Summary) (Storm Data)
1989 - Morning thunderstorms produced three to six inch rains in Oklahoma, and the Arkalatex area of Arkansas, Texas and Louisiana. Tom OK was soaked with 5.98 inches of rain, and Foreman AR received 5.55 inches. Evening thunderstorms produced high winds in the Wasatch Front of northern Utah. Thunderstorm winds gusted to 66 mph at Salt Lake City, and flash flooding caused up to two million dollars damage to a marina on Lake Powell. (Storm Data) (The National Weather Summary)
1992: The famous Andrew weakened to becomes only a tropical storm. (Ref. AccWeather Weather History)
1994: One of the most memorable severe thunderstorms in recent history struck north-central and central Oklahoma. Central Oklahoma is pounded by severe thunderstorms. Wind gusts to 113 mph were recorded at Meno. At Mangum, the winds gusted to 104 mph and 97 mph at Hobart. 30 mobile homes were destroyed by hail and wind at Okarche. Hailstones measured 4.5 inches in diameter. (Ref. AccWeather Weather History)
(Ref. More Information on This Storm)
1994: Today marked the 41st consecutive day with temperatures 90 degrees or hotter in Boise, ID, which is a record for that city up to this date. (Ref. AccWeather Weather History)
1995: Hurricane Felix stalled off the Mid-Atlantic Coast after upper atmosphere winds that had been steering it faded away. An area of high pressure to the west blocked movement farther inland. Another area of high pressure to the east blocked movement back over the Atlantic. Both areas of high pressure were weak and didn't generate strong steering currents. The west-to-east winds that could push Felix away from the U.S. were far to the north. As a result, Felix milled around in the same general area on the 17th and 18th before it began drifting slowly eastward, away from the U.S. on the 19th. (Ref. AccWeather Weather History)
1997: Loudoun County, VA lightning struck a concourse at Washington-Dulles International Airport and injured three airline food service personnel. (Ref. Lightning - Virginia Weather History)
2002: Drought conditions helped big temperature swings: Yesterdays daily record high of 101 degrees was followed by this mornings daily record low of 39 degrees in Rapid City, SD. Similar, NE records of 105 degrees in Alliance and Chadron were followed by today's records of 43 and 41 degrees. (Weather Guide Calendar with Phenomenal Weather Events 2011 Accord Pub. 2010, USA)
2003: Chadron, ME recorded the last of 26 consecutive days with a high temperature of at least 90 degrees, their longest such streak on record. (Ref. Wilson Wx. History)-
1
-
-
76 / 70, Partly cloudy, although some paerts of the area have clouds into N/NW NJ. Hottest day out of the next week to 10 days, at least. Low to mid 90s in the hottest areas, ahead of any clouds and scattered showers with the boundary later. Cooler, cloudy Monday and stuck in the 70s unless there is some overnight maxes (midnight/1AM). Onshore barrage this week as Eric passes by out to sea, perhaps some scattered showers/ rain / storms Tue - THu , otherwise mainly dry and near to slightly below normal. Flow comes around to warm up Fridy and next weekend, and with continued drying, the next chance at 90 in the hotter areas. Trough into the east by the 26 with ridge building east by the close of the month and warm overall beyond there.
8/17 : Hottest day for a while
8/18 - 8/21 : Cooler , mainly dry
8/22 - 8/24 : Brief warmup with chance for 90 (Fri/Sat in the hottest areas
8/25 - 8/29: Cooler
8/30 - Beyond : Overall warmer - Wet ridge building back eat -
9 hours ago, LibertyBell said:
JFK ISP batting shut outs for 90 degree days in August.
I've had 1 (last Thursday)
How is ACY getting shut out of 90 degree days in August, that's very unusual! They might end the month with zero 90 degree days if Sunday doesn't pan out, has that ever happened before?
Persistent onshore S/SE wind
-
Highs:
PHL: 90
TTN: 89
TEB: 87
New Brnswck: 87
EWR: 84
LGA: 84
NYC: 84
ACY: 83
ISP: 82
BLM: 82
JFK: 81 -
-
1 hour ago, winterwarlock said:
Peek a boo but most cloudy
Heatwave in jeopardy
Gonna be close - clouds meandering in CNJ but plenty of breaks.
made it to 86 here. tomorrow next shot at 90 and then we'll see if next Sat/Sun can get sneaky 90s in the hot areas, enhanced if the week continues dry.

-
1
-
-

August 2025 Discussion-OBS - cooler than normal first week but a big comeback to warmer than normal for the last 2-3 weeks
in New York City Metro
Posted
EWR: 96 (2002)
NYC: 94 (2002)
LGA: 94 (1966)
JFK: 90 (2009)
Lows:
EWR: 54 (1958)
NYC: 55 (1924)
LGA: 59 (1979)
JFK: 53 (1963)
Historical:
1559: Pensacola, Florida: First recorded hurricane in US history hits Pensacola area driving five Spanish ships ashore in Pensacola Harbor. (Ref. WxDoctor)
1788 - A small but powerful hurricane inflicted great havoc upon forests along a narrow track from New Jersey to Maine. A similar storm track today would cause extreme disaster in the now populated area. (David Ludlum)
1890 - An estimated F3 tornado hit South Wilkes-Barre, Pennsylvania. About 400 buildings were destroyed in the industrial and more impoverished residential section of town. The death toll was 16 and damage was estimated at $400,000.
1896: The famous Cottage City (Oak Bluffs) waterspout occurred off Martha's Vineyard, Massachusetts. The vortex was 3,600 feet high, formed three times, and was well photographed.
1935: Bangor, ME soared to 104° for their all-time record high temperature. (Ref. Wilson Wx. History) (Ref. AccWeather Weather History)
1939: An F2 tornado associated with a hurricane moved over the 10-mi-wide estuary of the Potomac River. It sank a boat offshore Reedville, VA, drowning a man; another person was killed between Scotland and Dameron, MD. (Weather Guide Calendar with Phenomenal Weather Events 2011 Accord Pub. 2010, USA)
1939: Tuckerton registered New Jersey’s maximum 24 hour precipitation record as 14.82 inches of rain fell on the 19th and 20th. (Ref. Hurricane Map and NWS Monthly Weather Review )
1955: Devastating floods affect much of New England on the 18th and 19th as Hurricane Diane give record breaking rains. Boston, Massachusetts had 8.40 inches in 24 hours, greatest ever on Boston's records. Rains from Tropical Storm Diane fell on already saturated ground from Tropical Storm Connie a week before. Westfield, MA recorded 18.15 inches in 24 hours, to set a state record, while the 24-hour precipitation record for CT was set at Burlington with 12.77 inches. At one point, over 40% of Worcester, MA was underwater. Woonsocket, RI was hit hard as the Blackstone River, normally only 70 feet wide, swelled to over 1.5 miles in width. 82 people died and damage topped $800 millions dollars.(Ref. NOAA Boston Weather Events) (Ref. AccWeather Weather History)
1969 - 'Never say die' Camille let loose a cloudburst in Virginia resulting in flash floods and landslides which killed 151 persons and cause 140 million dollars damage. Massies Hill VA received 27 inches of rain. (David Ludlum)
1979: Severe weather and very heavy rains were an unwelcome visitor to parts of northeast Nebraska from this date through the 20th. Hail up to one inch in diameter damaged crops in a strip from 6 miles south of Pilger, NE through Wisner and Pender affecting Stanton, Thurston and Cuming Counties. But probably the most remarkable event occurred in Dixon County where 6 to nearly 10 inches of rain fell in just four hours. This rainfall caused the Iowa Creek to exceed its banks causing extensive flash flooding of homes and businesses in Ponca. The rushing water washed out crops, tore trees from the creek bed and washed out 15 bridges in the county. (Ref. Wilson Wx. History)
1986 - The temperature at San Antonio, TX, soared to an all-time record high of 108 degrees. (Sandra and TI Richard Sanders - 1987)
1987 - Thunderstorms moving out of southeastern Nebraska spread severe weather into eastern Kansas and western Missouri during the day. Thunderstorms in Nebraska produced hail three inches in diameter at Albion, and high winds which downed a large tent at Waterloo injuring a dozen persons. Thunderstorms in Kansas produced baseball size hail northwest of Topeka, and wind gusts to 80 mph at Fulton. Ten persons were injured in a thunderstorm at Princeton KS, and damage to crops in southern Franklin County KS was estimated at 3.5 million dollars. (Storm Data) (The National Weather Summary)
1988 - Raleigh, NC, reported a record hot temperature reading of 103 degrees. Afternoon thunderstorms in Oklahoma produced wind gusts to 75 mph in southern Pittsburgh County. Thunderstorms in Indiana produced 4.50 inches of rain at Morgantown. (Storm Data) (The National Weather Summary)
1989 - Early morning thunderstorms deluged southeastern Delaware with six to ten inches of rain in four to six hours, with local reports of 13 to 20 inches of rain. Twenty-six major roads were closed or damaged, and fourteen bridges were washed out. Flooding caused nearly four million dollars damage to local businesses. (Storm Data) (The National Weather Summary)
1991: Hurricane Bob made landfall at Newport, RI with maximum sustained winds of 90 mph with gusts to 105 mph. Then the cyclone made a final landfall as a tropical storm at Rockland, ME. Winds reached 80 mph gusting 110 mph at the New Bedford Hurricane Barrier and gusts reached 143 mph at Westport Point, MA, 125 mph at Block Island, RI, 100 mph at Cape Cod, MA and 93 mph at Blue Hill, ME. The storm surge at Upper Buzzards Bay reached 15 feet. 7.84 inches of rain fell in 24 hours at Portland, ME, their wettest 24 hour period on record. Power was out to 2.1 million homes and businesses and damage totaled $1.5 billion dollars. 17 people died. Bob was the worst hurricane in the northeast since Hurricane Donna in 1960. Hurricane Bob did $780 million in damage and a long period of lost power in New England.Bob's Storm Track - Weather Underground (Ref. AccWeather Weather History)
1991: Strong thunderstorms affected portions of north central and east central South Dakota. In Dewey County, near Ridgeview, a thunderstorm produced about five inches of rain, very strong winds, and hail. The winds blew over three grain bins, one of which struck a house causing considerable damage. Skirting was blown from several mobile homes and shingles were torn from many houses. The storms also produced tremendous amounts of lightning. The Civil Defense Director for Codington County reported that the lightning was so frequent and vivid that he drove for 10 minutes without needing his headlights. At one point a lightning strike occurred within 10 feet of his car. The strike splattered mud onto his vehicle, drained his battery, and caused problems with the car's electrical system. (Ref. Wilson Wx. History)
1992: Tropical Storm Andrew was becoming disorganized as it was being affected by upper level wind shear. (Ref. Wilson Wx. History)
2003: Las Vegas, Nevada: A sudden deluge surprises Las Vegas, dumping 3 inches of rain in 90 minutes, severely flooding the city's northwest sector, knocking out power to thousands, and leaving motorists stranded atop their cars. (Ref. WxDoctor)
2007: Rainfall and flooding of historic proportions struck parts of the Upper Mississippi River Valley continuing into the next day. Rainfall in excess of 10 to 12 inches fell in some areas, with the main swath of heaviest rain centered along a line from Claremont and Rochester, MN to La Crosse, Viroqua and Muscoda, WI. 24 hour rainfall records were set in the following locations: Hokah, MN: 15.10 inches, Viroqua, WI: 9.23 inches, La Crescent, MN: 7.95 inches, Gays Mills, WI: 7.41 inches, The Hokah total also set the 24-hour rainfall record for the entire state of Minnesota. In addition, due to the training nature of the storms, the heavy rain persisted for hour after hour, with rainfall rates of 1 to 2 inches per hour common. Flood of records were recorded at the Middle Fork Whitewater River at Whitewater State Park, MN. Many other sites had river crest within the top 5 record crest. (Ref. Wilson Wx. History)