PhiEaglesfan712
-
Posts
1,411 -
Joined
-
Last visited
Content Type
Profiles
Blogs
Forums
American Weather
Media Demo
Store
Gallery
Everything posted by PhiEaglesfan712
-
E PA/NJ/DE Spring 2025 Obs/Discussion
PhiEaglesfan712 replied to PhiEaglesfan712's topic in Philadelphia Region
Today is the last day in the PHL climo that the record high temp is below 90. After today, you'll have to wait until September 29 to find a record high under 90. -
2025-2026 ENSO
PhiEaglesfan712 replied to 40/70 Benchmark's topic in Weather Forecasting and Discussion
Second or later year of ENSO neutral (since 1949-50) - PHL 1960-61 (2nd year of ENSO neutral): 28.9F DJF; 49.1 in snow 1961-62 (3rd year of ENSO neutral): 30.5F DJF; 29.2 in snow 1962-63 (4th year of ENSO neutral): 28.3F DJF; 20.5 in snow 1967-68 (2nd year of ENSO neutral): 32.6F DJF; 15.9 in snow 1981-82 (2nd year of ENSO neutral): 31.2F DJF; 25.4 in snow 1993-94 (2nd year of ENSO neutral): 33.0F DJF; 23.1 in snow 2013-14 (2nd year of ENSO neutral): 33.0F DJF; 68 in snow 2014-15 (3rd year of ENSO neutral?): 32.6F DJF; 27 in snow All much colder than normal. Most of the years produced near normal snowfall, with 2 of them (1960-61 and 2013-14) producing blockbuster seasons. -
2025-2026 ENSO
PhiEaglesfan712 replied to 40/70 Benchmark's topic in Weather Forecasting and Discussion
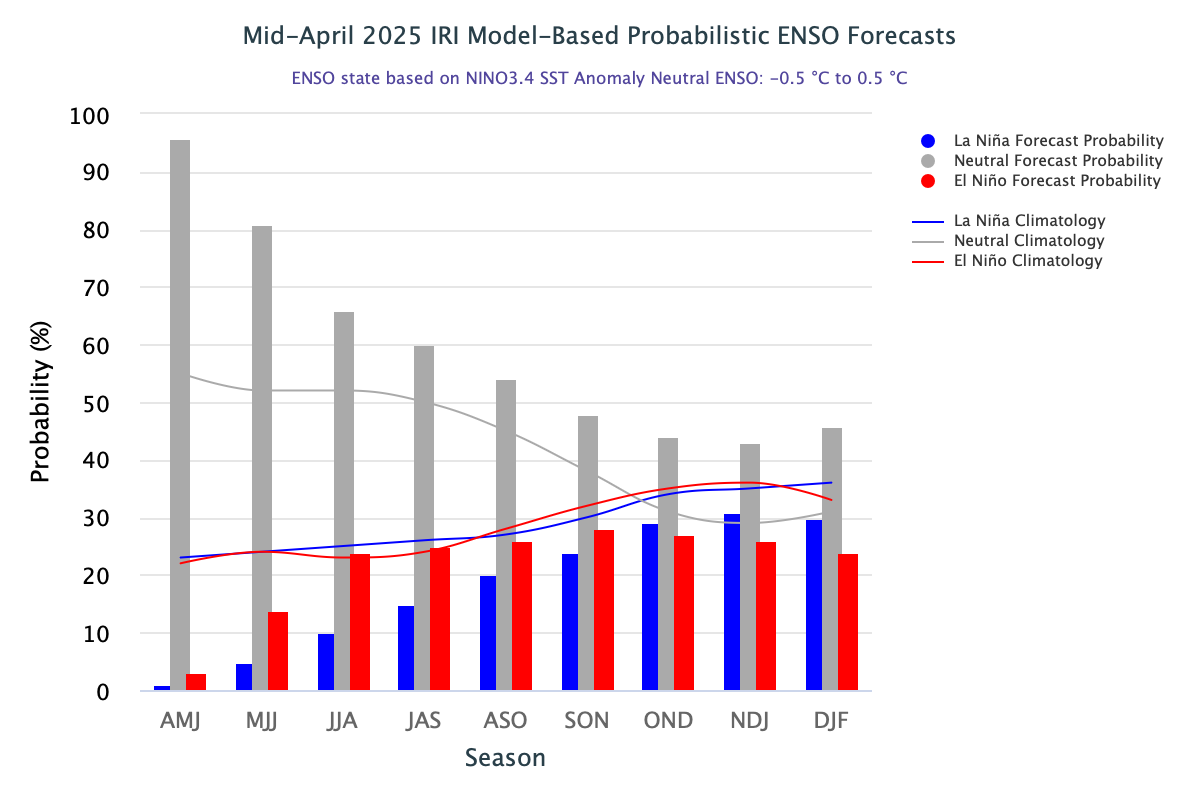
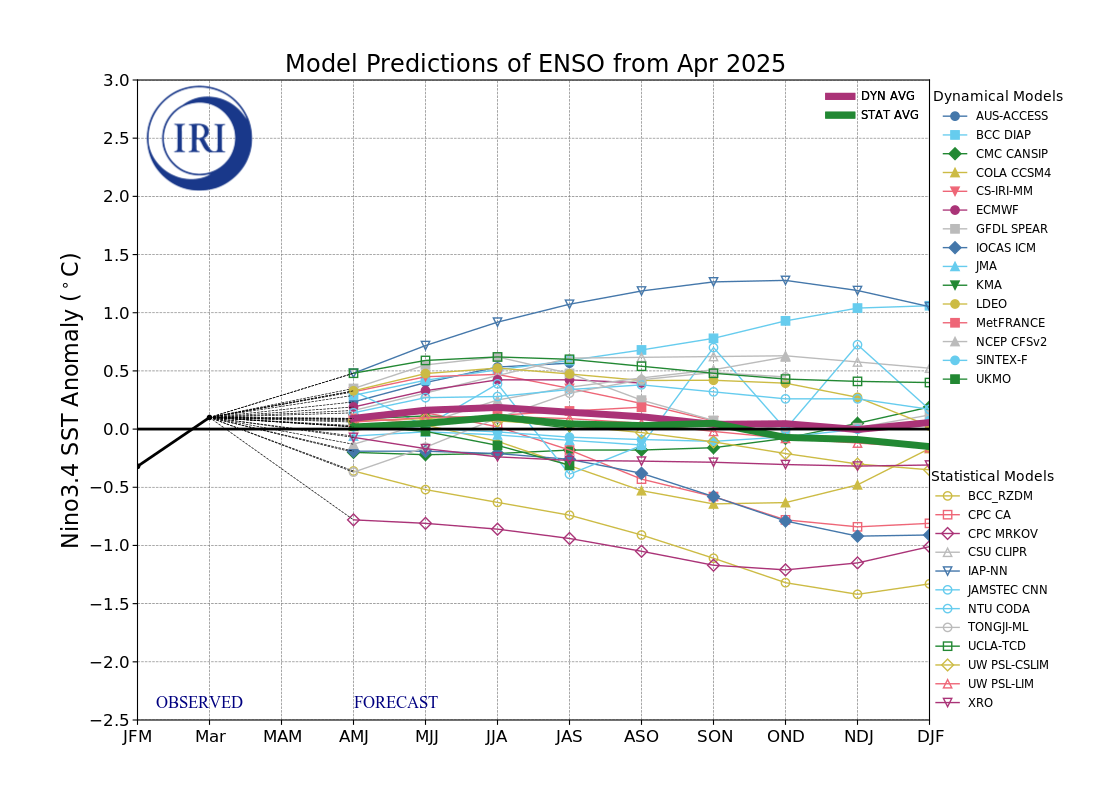
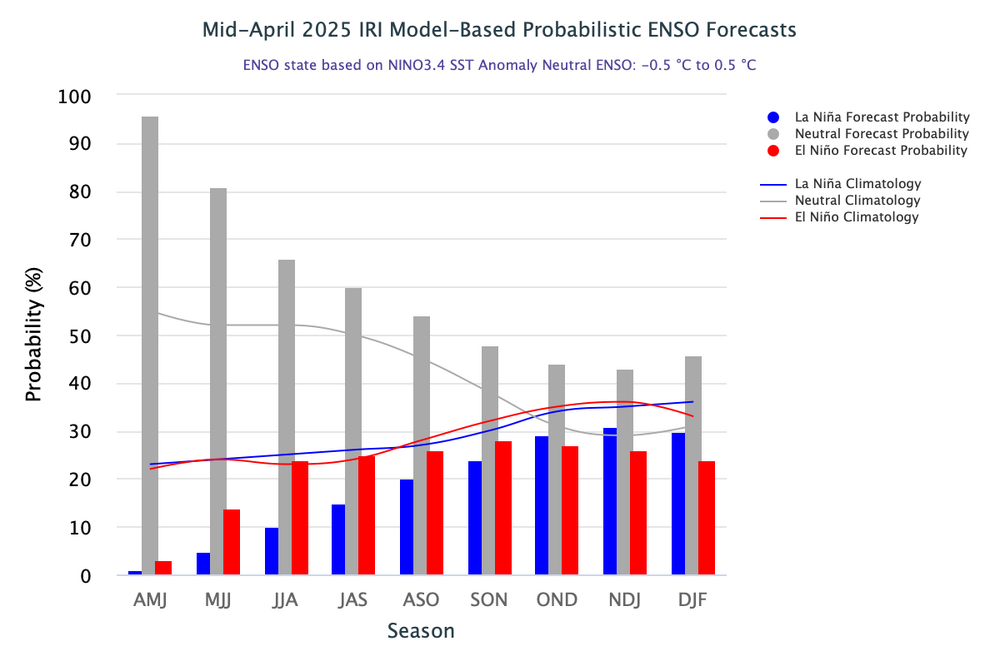
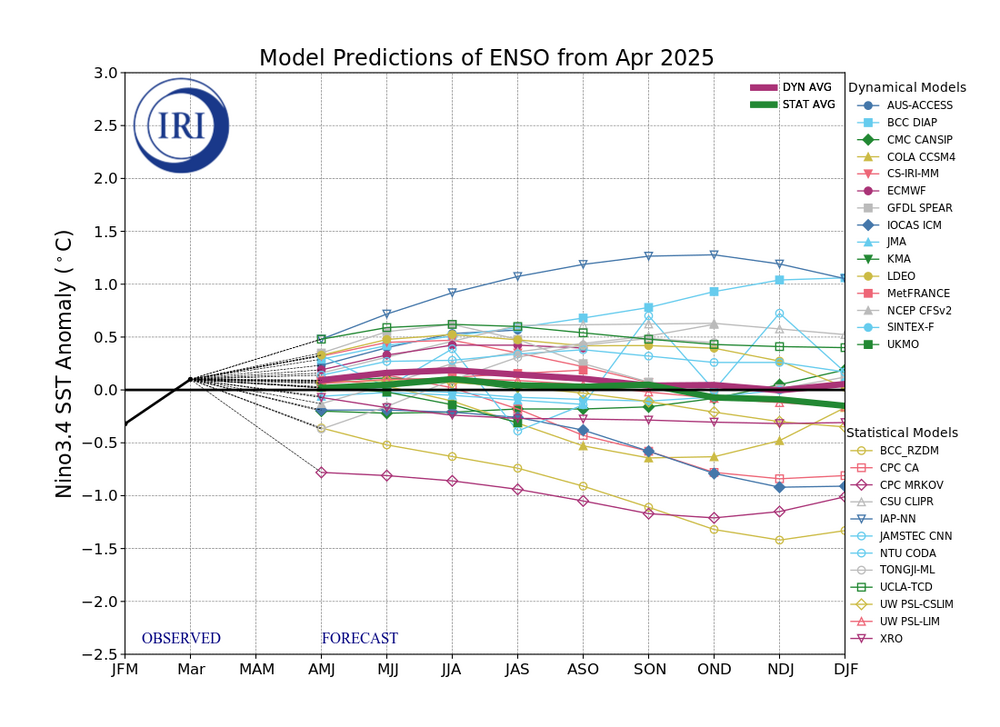
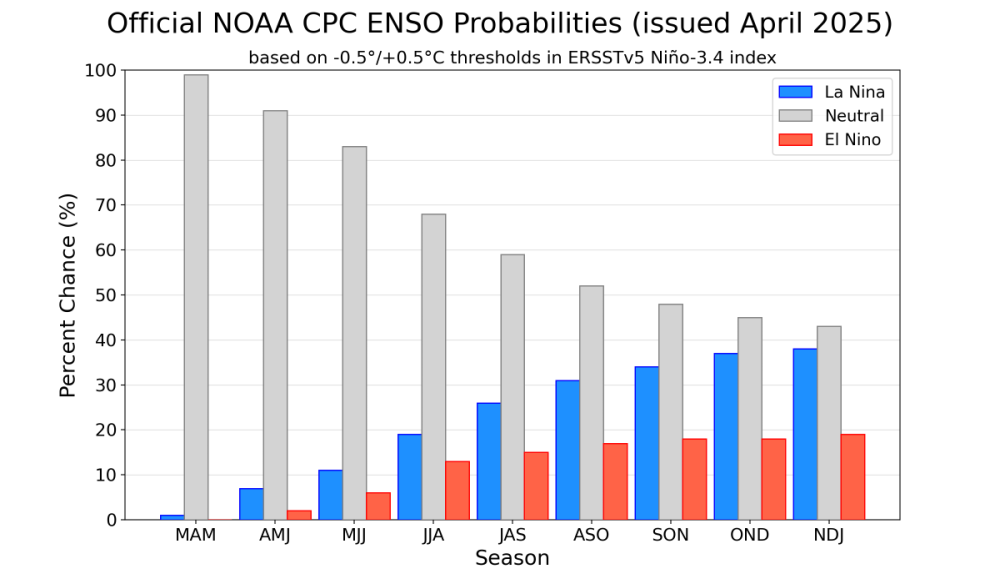
FWIW, here is the one from April 2013: https://iri.columbia.edu/our-expertise/climate/forecasts/enso/archive/201304/QuickLook.html Almost eerily similar to what we have currently. The fact that almost everything is lining up perfectly with 2013 makes me feel really optimistic 2025-26 is going to be a cold and very snowy winter. Even the PAC jet is returning to a favorable setup. -
2025-2026 ENSO
PhiEaglesfan712 replied to 40/70 Benchmark's topic in Weather Forecasting and Discussion
-
2024-2025 La Nina
PhiEaglesfan712 replied to George001's topic in Weather Forecasting and Discussion
Those conditions sound a lot like 2013, which of course produced a widespread cold and snowy winter in the Eastern United States. -
2024-2025 La Nina
PhiEaglesfan712 replied to George001's topic in Weather Forecasting and Discussion
2013 would be the best analog. That was a very wet summer in the east, with a much cooler than average August. It was a frontloaded warmth summer in the northeast, but a much cooler than average summer in the southeast. -
2025-2026 ENSO
PhiEaglesfan712 replied to 40/70 Benchmark's topic in Weather Forecasting and Discussion
Sounds similar to what happened at the end of the winter of 2008-09, except that storm was at the beginning of March, so we cashed in with a big snowstorm. This one was in mid-April, so we ended up with a cold rain event. Hopefully, like the 3/1/2009 snowstorm, this event could be the precursor to the next great run of snowstorms. -
2024-2025 La Nina
PhiEaglesfan712 replied to George001's topic in Weather Forecasting and Discussion
MEI for FM 2025 was -0.7 -
2025-2026 ENSO
PhiEaglesfan712 replied to 40/70 Benchmark's topic in Weather Forecasting and Discussion
That March 2009 snowstorm was definitely a turning point. The first part of that season (October 2008-January 2009) had a lot of cold, but not the snow. In fact, there was no real snow event, except for the early February one that got a fluky 8+ inches at PHL. That was more of an isolated storm. The March 2009 one was a Nor-easter and more widespread (it would be the first of many such events in the next 7 years).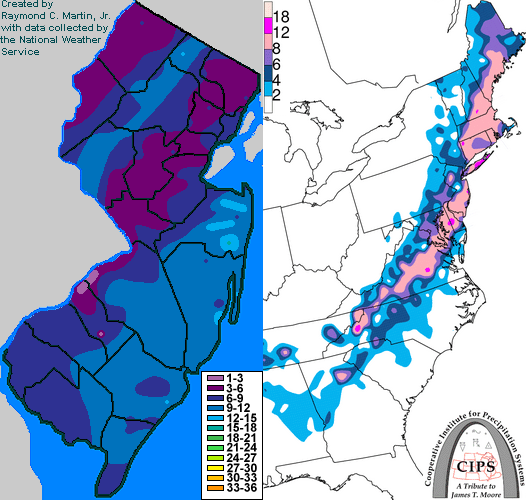
-
E PA/NJ/DE Spring 2025 Obs/Discussion
PhiEaglesfan712 replied to PhiEaglesfan712's topic in Philadelphia Region
January 1982 was a very cold and snowy month. (We haven't had a January colder than that one since then.) It pretty much saved the winter (as February and March were very lackluster). The April snowstorm pretty much iterated the potential that was there from January. And yes, the April 19-20 snowstorm was in 1983, which was at the tail end of the super el nino. Amazing to think you can get a snowstorm 2 months from the summer solstice. It would be like if it snowed on August 21-22 on the other side of the solstice (I can't imagine that happening). -
2025-2026 ENSO
PhiEaglesfan712 replied to 40/70 Benchmark's topic in Weather Forecasting and Discussion
Perhaps the most amazing thing about the record amount of snow storm tracks from about 3/1/2009 to 1/23/2016 is that we had a 2-winter record low snow stretch (2011-12 and 2012-13) right in the middle of it! -
E PA/NJ/DE Spring 2025 Obs/Discussion
PhiEaglesfan712 replied to PhiEaglesfan712's topic in Philadelphia Region
Nope, it was April 7, 2003 (my freshman year of high school, adding to a very historic snow season):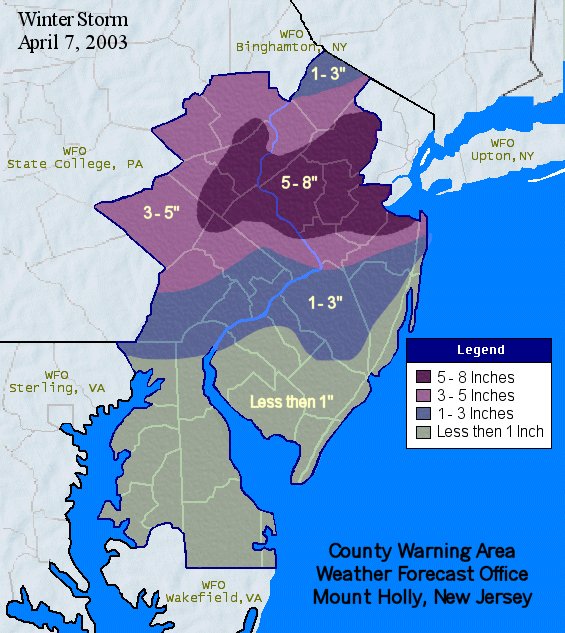
-
2025-2026 ENSO
PhiEaglesfan712 replied to 40/70 Benchmark's topic in Weather Forecasting and Discussion
16-17 wasn't a great snow winter, especially south of Philly. It even ranks among the Top 10 least snowy winters in Baltimore (3 inches) and Washington DC (3.4 inches). -
2025-2026 ENSO
PhiEaglesfan712 replied to 40/70 Benchmark's topic in Weather Forecasting and Discussion
-
E PA/NJ/DE Spring 2025 Obs/Discussion
PhiEaglesfan712 replied to PhiEaglesfan712's topic in Philadelphia Region
We've been doing well with rainfall the last month (6 events of 0.5+ inch, 3 events of 1+ inch): 2025-03-05 62 49 55.5 15.3 9 0 1.54 2025-03-16 70 50 60.0 16.6 5 0 0.53 0.0 0 2025-03-17 62 36 49.0 5.3 16 0 0.89 0.0 0 2025-03-20 72 45 58.5 13.8 6 0 0.58 2025-03-24 54 40 47.0 1.0 18 0 0.51 2025-03-31 82 50 66.0 17.4 0 1 1.27 2025-04-04 71 60 65.5 15.4 0 1 0.88 -
2025-2026 ENSO
PhiEaglesfan712 replied to 40/70 Benchmark's topic in Weather Forecasting and Discussion
I think we are seeing this with el ninos. The last moderate one was 2002-03, which is over 20 years ago now. Since then, either they've been weak (2004-05, 2006-07, 2014-15, and 2018-19/20) or strong/super (2009-10, 2015-16, and 2023-24). That doesn't seem to be the case with la ninas. We just had 3 straight years of moderate la nina in 2020-23. -
2024-2025 La Nina
PhiEaglesfan712 replied to George001's topic in Weather Forecasting and Discussion
JFM 2025 ONI (NOAA): -0.4 JFM 2025 RONI: -0.90 March 2025 PDO: -1.12 -
E PA/NJ/DE Spring 2025 Obs/Discussion
PhiEaglesfan712 replied to PhiEaglesfan712's topic in Philadelphia Region
We had at least 3 good rain events during the month of March. Starting with the one on the 5th, then on the 16th/17th, and last night. Over 5 inches of rain in during the month, which is a first since August. The worst of the drought is over. -
2024-2025 La Nina
PhiEaglesfan712 replied to George001's topic in Weather Forecasting and Discussion
I'd say that with the exception of January, the 2020-21 analog worked almost in line with this year, especially with temperature. December and February were cool to near average, while November and March absolutely torched in the East. -
E PA/NJ/DE Spring 2025 Obs/Discussion
PhiEaglesfan712 replied to PhiEaglesfan712's topic in Philadelphia Region
If I remember correctly, I think we went above 80 on 3/26/2021. Some locations in this area reached 80 on 2/21/2018. -
E PA/NJ/DE Spring 2025 Obs/Discussion
PhiEaglesfan712 replied to PhiEaglesfan712's topic in Philadelphia Region
I emptied out the gas in the snowblower this morning. -
E PA/NJ/DE Spring 2025 Obs/Discussion
PhiEaglesfan712 replied to PhiEaglesfan712's topic in Philadelphia Region
Probably an on and off thing for Saturday and Sunday. -
2025-2026 ENSO
PhiEaglesfan712 replied to 40/70 Benchmark's topic in Weather Forecasting and Discussion
The end to this winter/beginning of this spring is eerily similar to 2010. It just ended abruptly in mid/late February, then we have a warm March, and a heat wave in early April. The absence of a definitive ENSO state in 2024-25 is definitely helping this behave like the previous ENSO state, which was a strong el nino. -
E PA/NJ/DE Spring 2025 Obs/Discussion
PhiEaglesfan712 replied to PhiEaglesfan712's topic in Philadelphia Region
My phone is saying 78 on Saturday, 69 on Sunday, and 75 on Monday to end out the month. It's going to be very warm. The only question is how warm?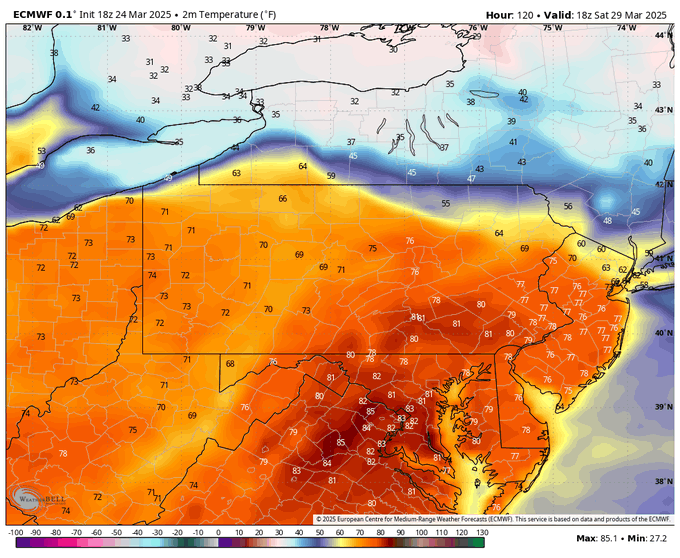
-
Or we could find a way to keep CJGJ. Because since he entered the NFL: 2019-2021 (No CJGJ) - No playoff wins 2022 (CJGJ) - Super Bowl appearance 2023 (No CJGJ) - Late season collapse 2024 (CJGJ) - Super Bowl Champions 2025 (No CJGJ) - ?