

griteater
-
Posts
9,635 -
Joined
Content Type
Profiles
Blogs
Forums
American Weather
Media Demo
Store
Gallery
Everything posted by griteater
-
Was just looking at this. Eric Webb has a page with an MEI that he did work to produce back to 1948 - https://www.webberweather.com/multivariate-enso-index.html Negative thing is that it is not updated in real-time ..."Here, the same original definition of the MEI is generally utilized, however several adjustments were made to increase the quality and reliability of the data. The detrended PCs in this MEI Index are based on more and newer data (1948-2018) as compared with Wolters MEI (1950-1993) and the detrending step along w/ the utilization of 30-year sliding base periods reduces the AGW signal in the data that is still present in the original MEI. Also, this version of the MEI is 2 years longer (1948-Present) compared to the original MEI (1950-present)"
-
Just flipping thru some reanalysis images, it looks like the surface pressure anomaly pattern was weak in Oct - you need strong low anomalies in E Pac and strong high anomalies in W Pac for high MEI. Accordingly, the 30-day SOI in October rose thru the whole month Same for low level zonal winds - need strong westerly anoms across the West and Central Pac for high MEI - didn't have that in Oct. OLR pattern for +MEI looked OK, but not robust
-
That MEI number really is amazeballs. Lowest Sep-Oct MEIs in oncoming El Nino years since 1979: 2014: 0.0 2023 / 2004 / 1979: 0.3
-
No doubt DT will be calling for an all-hands on deck ALEET when he sees this
-
The current strongest, most beastliest downwelling kelvin wave of the year per 97-98 twitter hounds will surely bring the MEI up a notch next month
-
These late fall / early winter WWBs are welcome per the Chuck +PNA correlation of keeping warmth in the subsurface
-
September was the killer. It was a slow and steady unimpeded climb. Then it flatlined, and the damage was done
-
Yeah, I liked your link. The GWO chart from MVentrice is a good one....but yeah, I was just pointing out that the data up to the current date is fine, but the forecast graphs/charts based off the CFS aren't regarded as very accurate, I don't think.
-
This is crazy...this is all moderate / strong / super ninos since 1866 and the corresponding averaged PDO for Aug/Sep/Oct prior to the winter (CPC PDO Data: https://www.ncei.noaa.gov/pub/data/cmb/ersst/v5/index/ersst.v5.pdo.dat)
-
I think those AAM forecasts tend to be sketchy. I'd refer to the past charts to kind of see how things have progressed https://atlas.niu.edu/gwo/ MR-latest-30days.png (1555×983) (niu.edu) MR-latest-365days.png (1566×983) (niu.edu)
-
That daily Modoki index is on StormVista. The latest...
-
A few thoughts: 1. Fair point from GA as the lack of big cooling in the W Pac and E Maritime Continent may cause some interference with El Nino at times by enhancing convection in the W Pac...but yeah, whether the MJO RMM plots are showing a legit east tracking MJO wave or not, there is almost always a background weak MJO wave/ripple that traverses the equator around the globe, and as that signal (usually seen well with VP movement) kicks out of the W Pac into the dateline and east and constructively interferes with the background El Nino convection, that will be the time that should offer the most promise for wintry weather in the East. 2. Look at how the precip maps from the winters of 09-10 / 02-03 (west-based El Ninos) compare with 97-98 / 82-83 (east-based El Ninos). Euro and Cansips Seasonals match more with the west-based look 3. Lastly, here is how MJO phases 6-7-8-1-2 look during El Nino in December / Jan / Feb (note: the Dec images don't have a 'Dec' label or El Nino label on them, but you can see that they are grouped under Dec during El Nino when you click on the images here): https://www.americanwx.com/raleighwx/MJO/MJO.html December: January: February:
-
This is a VERY cold 500mb pattern for January on the Euro for most of the E Half of U.S. Big -EPO / +PNA / Big cross-polar flow / Above normal heights Hudson Bay to S of Greenland
-
It was mentioned to wait until November to see where the forcing sets up. Well, here we are, precip enhanced across the central and eastern Pacific, but the main bulge is well west
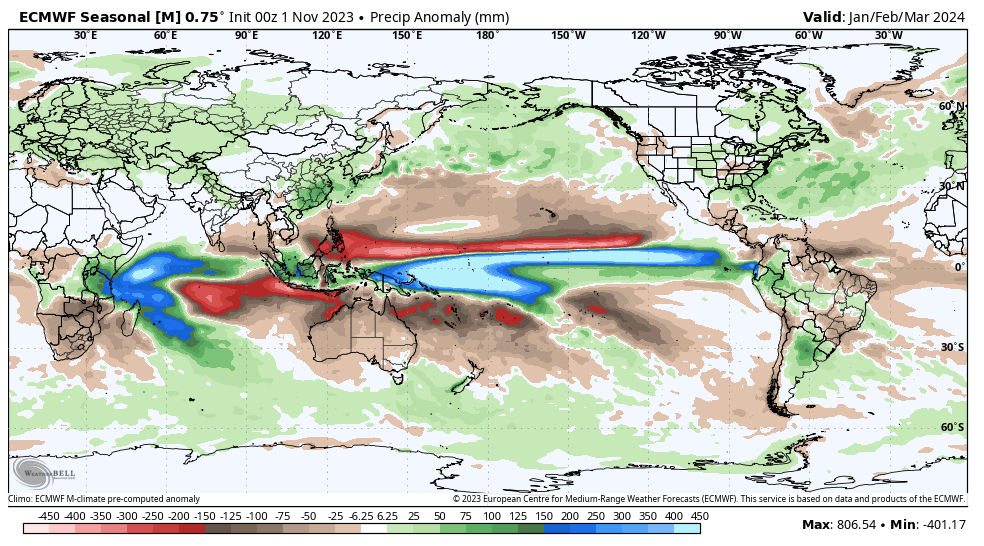
-
Not to mention, more yellow up top over the pole
-
Updated with October number in. This rose a little more than I thought it would
-
https://psl.noaa.gov/enso/mei/data/meiv2.data
-
He probably has additional ideas, but the bolded isn’t true cause the highest MEI values occurred during the big east based El Niños of 82-83 and 97-98
-
UK Met Office Nino 3.4 is at +1.67 after a current year high of +1.81 on Oct 30
-
VP and OLR data prior to ~1980 is known to be sketchy at best and unreliable (prior to extensive satellite coverage across the tropics by which these values are computed today). Obviously, reanalysis data is available for these fields prior to 1980 so there is some manner in which they are estimating the values...my guess is that it is an estimate based off surface pressure and precipitation patterns captured at tropical locations such as Tahiti / Darwin and others. At any rate, I would be curious as to the correlation values you would see if you just used data post 1980. Here are a few charts showing VP to 500mb pattern matches... 1st one is VP and 500mb for all Moderate and Stronger La Ninas vs El Ninos since 1980 2nd one is VP and 500mb for (Top 10 Most Neg / Top 10 Most Pos) PNA in January since 1980 The maps are lining up as one would expect
-
The point was......prior years that had the type of VP spatial pattern in the Sep-Nov timeframe on the image I posted tended to continue with that look into winter...and during El Nino, low frequency (3-4 month) -VP uplift in the central Pacific with +VP in Indonesia and Brazil absolutely does not correlate with a -PNA
-
Definitely a wave that will add some warming, but it doesn't look hawt IMO - more like a lot of the ripples we've been seeing this year
-
Checking back in on this post, so far in the Sep-Oct period, we are aligning more with the west-based look from a VP standpoint. And scanning thru the ensemble forecasts, I see no reason to think that November is going to see a major change from what has already occurred in Sep-Oct. Here is what we've seen so far in Sep-Oct...
-
Agree. If you look at 09-10, it had weak zonal wind in the lower stratosphere at 100mb (1st image) from mid-Nov all the way to April (makes it much easier for blocking to develop in the troposphere). At 10mb (2nd image) in the upper stratosphere, there was a sharp weakening in early November, then another in late Jan into early Feb, with an official SSW occurring. But bottom line, we want to see elevated heat flux (3rd image) / disruptions to the Strat PV...getting an official SSW is an extra bonus. Excellent description of heat flux on the NASA Ozone Watch site (https://ozonewatch.gsfc.nasa.gov/meteorology/flux_2009_MERRA2_NH.html): "Variations of temperature are strongly affected by weather systems in the troposphere. Very large-scale weather systems or waves can move or propagate upward into the stratosphere. The upward propagation of these weather systems warms the polar region. We measure this upward flow of wave energy with the eddy heat flux. The eddy heat flux is the product of north-south (meridional) wind departures and temperature departures from their respective zonal-mean values. There is a strong anticorrelation between stratospheric temperature and the 45-day average of the eddy heat flux lagged prior to the temperature. A more positive value of eddy heat flux indicates that wave systems are moving into the stratosphere and are warming the polar region. Wave events distort the polar vortex and allow for greater mixing inside the vortex. These events can result in major and minor polar warmings."
-
The El Nino / -QBO combo is a good one for SSWs, -AOs, and -NAOs. Posted this in the Winter thread a few months back... And during El Ninos, Sudden Stratospheric Warmings (SSW) have occurred in 8/10 cases (80%) when the QBO was negative in winter (40mb on Jan 1). And in the 8 cases where an SSW occurred during Nino and -QBO, the combined AO/NAO index was negative 6/8 cases (75%). In contrast, when the QBO was positive in winter during El Ninos, SSWs have occurred in only 6/13 cases (46%). And in the 6 cases where an SSW occurred during El Nino and +QBO, the combined AO/NAO index was negative in only 2/6 cases (33%).


