griteater
-
Posts
9,635 -
Joined
Content Type
Profiles
Blogs
Forums
American Weather
Media Demo
Store
Gallery
Everything posted by griteater
-
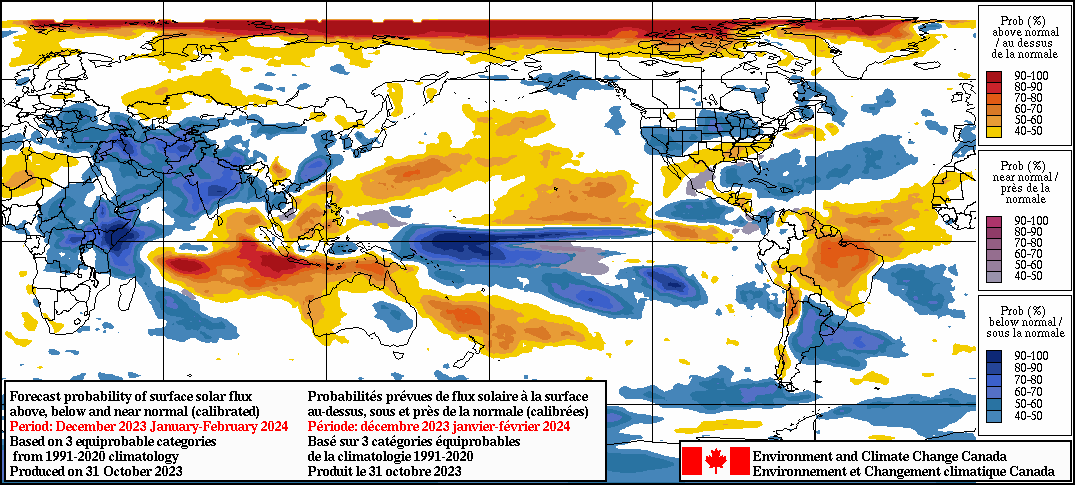
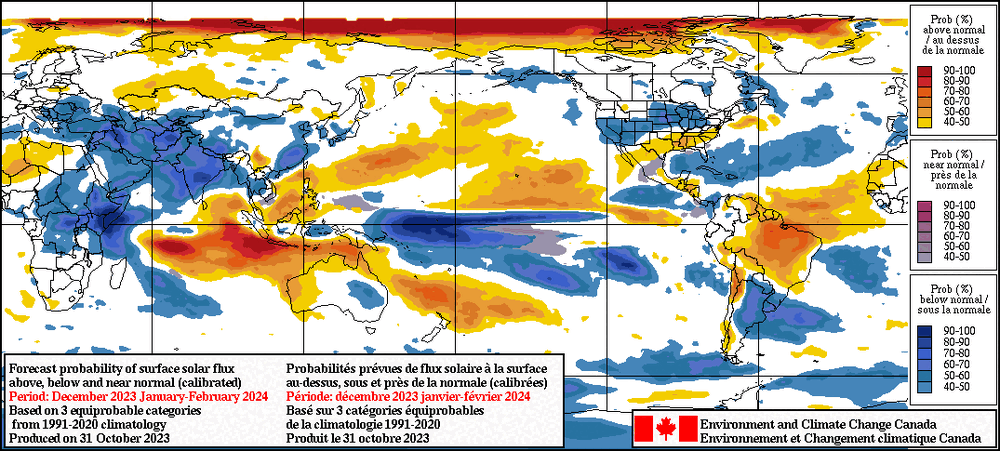
For some reason, everything is shifted a bit farther west than you'd expect with this year's El Nino / IOD (the color palette is reversed on the right side for the OLR comparison)
-
October numbers won't be out until a few more days, but here was the update that includes Aug/Sep. Based on Oct SST images, I don't think it will change much for the Sep/Oct value
-
Thorough and well done. Good luck with your forecast. I like the idea of the AO/NAO combo averaging negative for winter if we can keep the momentum going over the next couple weeks with the strat forecasts and don't see indications of strat/trop coupling of strong zonal winds / +NAM
-
Yeah looks like CANSIPS pretty much holds its line. Looks like a strong (not super) nino with some -PDO baked in. For the east, Dec is meh; Jan has strong southern stream underneath south based blocking; Feb (into Mar) looks like stock mod to strong nino with best overall pattern. Could look a whole lot worse
-
Cloudiness is NOT east-based for Dec-Feb
-
Agree, it’s not a perfect tripole, but it’s far away from the days of having the big cold sea there off the tip of Greenland when we were having a run of multiple +NAO winters in a row
-
Well, we’re off to a rough start with the CANSIPS failing to update so far on customary outlets like Trop Tidbits and WxBell
-
7-day trend loop of the CFS Seasonal for December shows flip from Aleutian Ridge to Aleutian Low. Urals ridging in NW Asia combined with Aleutian Low is a base configuration for strat vortex weakening
-
-QBO winters are known for early strat warmings, regardless of solar
-
Here is a 3-run trend loop of the associated 10mb temperature anomaly charts for the week of Dec 4-11 (Euro Weeklies)
-
World Climate Service on Twitter usually posts an afternoon update on the Cansips. Haven't seen the update today. What does it all mean??
-
VP Forecasts: CANSIPS on TTidbits: https://www.tropicaltidbits.com/analysis/models/?model=cansips®ion=global&pkg=chi200&runtime=2023100100&fh=0 Euro / Meteo France / UKMet on Meteo France site: http://seasonal.meteo.fr/content/PS-previ-cartes?language=en Copernicus Ensemble Mean on cyclonicwx site: https://cyclonicwx.com/models/c3s/global/vp200a/2023100100/003/
-
https://www.longpaddock.qld.gov.au/soi/ https://www.longpaddock.qld.gov.au/soi/soi-data-files/
-
This is correct regarding more ozone with a weak PV...."The position and size of the polar vortex plays a vital role in the amount and distribution of total column ozone. Very low temperatures are needed to form polar stratospheric clouds (PSCs). Chlorine gases react on the surface of these PSCs to release chlorine into a form that can easily destroy ozone." Look no further than the disaster that was the winter of 2019-2020 Source for strat data: NASA Ozone Watch: 2023 Arctic MERRA-2 Wind
-
And the QBO is behaving as it should / as expected with the zero line flip from +QBO to -QBO working it's way down from the upper stratosphere toward 50mb now in October
-
Normally you wouldn’t associate cold outbreaks with El Niño as much as you would La Niña unless it was a weak one with west-based / Modoki forcing, but I wouldn’t discount the chances for a few outbreaks this winter given that it looks like the base state wants to support tropical convection in the vicinity of the dateline, which could lead to some -EPO episodes (Alaska ridging), particularly in Jan-Feb
-
92-93, 93-94, and 94-95 all had a triple whammy favoring +AO/+NAO...Elevated CFCs, Pinatubo aerosol leftovers, and descending solar.
-
Nino 3.4 is at +1.78 here which is highest reading of this year. Nino 1.2 (top line) with a slow and steady decline since late August. Modoki Index at neutral
-
IOD has dropped to +1.58 from a recent high of +2.16 on Oct 15
-
Here is the Global AAM Chart for 2023. Positive numbers are considered El Nino-like and negative numbers are considered La Nina-like, but as with most indicies, there is variance on a seasonal basis. And here is how this year compares with Moderate / Strong / Super El Ninos since 1958. More evidence showing a disconnect between this year and the Super El Ninos of 82-83, 97-98, and 15-16. This year's El Nino strength and AAM would probably compare most favorably to 65-66, 72-73, and 91-92 (probably 57-58 as well as the Jan/Feb and Feb/Mar AAM numbers for that winter were slightly positive at 0.90 and 0.29 respectively...I don't have the numbers for fall of 1957). Note: I put this chart together some years back. I no longer have a link to the raw AAM numbers, but had previously saved them. The thick black line on the chart for this year is an estimate based on the previous chart above. If we combine El Nino Strength (Strong but not into Super), El Nino SST Base (East-Based moving to Basin-Wide), PDO (slightly negative), and AAM (negative in fall and potentially increasing into winter), that yields 65-66 and 72-73 as good matches. 65-66 was solidly -AO/-NAO and 72-73 was the opposite, solidly +AO/+NAO. 72-73 was in the descending portion of the solar cycle (sunspots / flux), again, known for +AO/+NAO. But blend those together against the same climate period (i.e. 1950-1980), and for Jan-Feb, it yields an El Nino / -PDO look along and off the west coast, with split flow across the conus, and with south-based blocking in Canada like we've seen a bunch of this year. Here is the enhanced subtropical jet across the southern tier on the 200mb zonal wind anomalies... Here are the 850mb Temperature anomalies... Anyway, those are some potential ideas for Jan-Feb....would need to modernize the analogs a bit (modern warming and Tip compressed air flow)
-
Trends in Jan-Mar snowfall since 1959
-
This is your winter DC...go get it Source: S(no)w pain, S(no)w gain: How does El Niño affect snowfall over North America? | NOAA Climate.gov Note: for Mod-Strong Ninos in the 2nd image, this includes Mod/Strong/Super (I can tell that just by counting the number of years included in the image...13 since 1959 - she mentions 13 mod-strong in the article)
-
That's the thing with snow cover. Yes, the Cohen snow cover advance to AO correlation has fallen flat on its face over the past decade...but there was a Met on here many years back who used snow cover extent in late October to predict E U.S. cold for the winter rather than using it to predict the AO. That one has held up pretty well over the years (I've posted about it before in the snowcover thread)
-
I agree with the spirit of what you are saying here that we will see warming associated with this new downwelling wave and bouts of general westerly wind anomalies across the nino basin. Where I think I differ is with the magnitude of warming. It's kind of like the old saying "when someone shows you who they are, believe it." Same thing here, we should see some warming, but will we see intense warming rates that are in excess of what we've seen for many months now that will throw this up into super status? I'm thinking no.
-
Yes, it's on the Climate Driver Update page > Pacific Ocean > Sea sub-surface: Climate Driver Update (bom.gov.au) They also have some nice subsurface archive images back to 1980 at the bottom of this page: Subsurface Temperature - Ocean Analysis - Oceanography (bom.gov.au)