

griteater
-
Posts
9,635 -
Joined
Content Type
Profiles
Blogs
Forums
American Weather
Media Demo
Store
Gallery
Everything posted by griteater
-
Mid-late Dec 1994 has been showing up on the CPC analog dates recently
-
Lots of ENSO metrics to consider and debate, but many point to a robust El Nino if not strong. The Equatorial SOI (a quality ENSO metric) 3-month average for Sep-Nov was -1.33 (6th lowest since 1950). EQSOI is a measure of surface pressure anomalies between Indonesia and the Eastern Equatorial Pacific
-
There are 2 upcoming cold surges w/ sfc high pressure that move into SE Asia, one on Dec 16th and another on Dec 19th. Those lead to +EAMT which, IMO, combines with the current ENSO state to give us the well-advertised big Pac Jet extension in the Dec 20-25 timeframe...which leads to a Dec 1994 type pattern (warm/mild across much of N Amer). The first step to getting more cold air into the pattern will be for the SE Asia cold surges and +EAMT / +AAM to back off some. During La Ninas, we often want to see +EAMT/+AAM to get the Pac Jet to extend into -EPO/+PNA ridging...but in this strong El Nino, the added +AAM is too much of a good thing in this case
-
48% of GEFS Ext members with SSW in early Jan period on tonight's run. Highest I've seen so far this winter for that product http://arctic.som.ou.edu/tburg/products/realtime/strat/
-

Winter 2023-2024
griteater replied to Stormchaserchuck1's topic in Weather Forecasting and Discussion
Dec 11 - Thoughts on the upcoming pattern with Southeast and Southern Mid-Atlantic focus... -
My guess is that the WWB will be fairly significant come go time, with good warming realized
-
Australian BOMM and CFS are on the amplified side. Euro EPS has the least amp. BOMM is the fastest / Euro the slowest GEFS looks like a good middle ground. That would put the MJO entering Phase 8 on Dec 19. Let's see if there are any slow downs.
-
Sep 2019 per the NOAA PDO data - https://www.ncei.noaa.gov/pub/data/cmb/ersst/v5/index/ersst.v5.pdo.dat
-
Nino 3.4 at +1.89 today (as of 12/6)
-
Winter 2023-2024
griteater replied to Stormchaserchuck1's topic in Weather Forecasting and Discussion
Was noticing that Phase 3 in Jan & Feb are both good during El Nino per Allan Huffman's composites when you use the one for all MJO amplitudes. For >1 amplitude, they are not as good. But P3 could help us some in January -
Winter 2023-2024
griteater replied to Stormchaserchuck1's topic in Weather Forecasting and Discussion
Tonight's GEFS Ext for Jan 3-Jan 10. Very tasty if true -
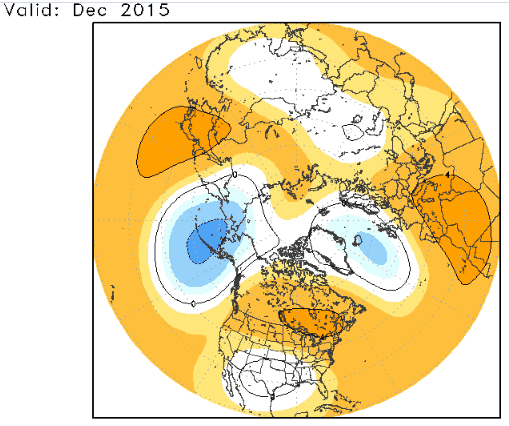
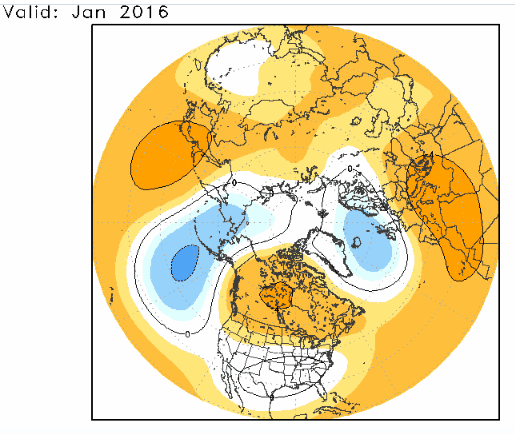
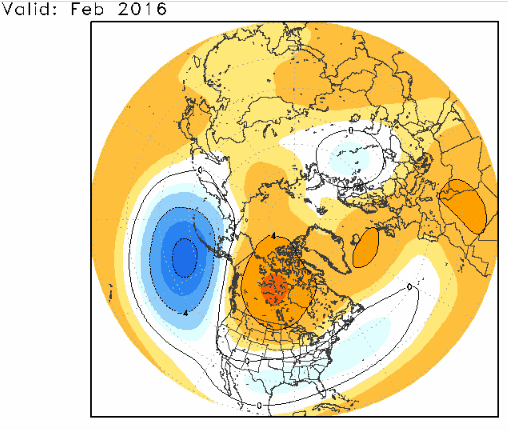
Dug these up. Here is what the Euro Seasonal had in Oct 2015 for Dec-Feb (2015-2016)
-
Looks like the Euro Weeklies from late Nov 2015 for Dec had a sort of stock super nino look with a big Aleutian Low and big ridge over Canada and Northern U.S (only posting the Dec Wk 2 image here).....but yeah, the final outcome was shifted east with ridge in E U.S.
-
I wonder if anyone has the Nov or Dec Euro Seasonal from 2015 just to see what it was showing then?
-
Yall can't wait a few weeks? Cold high pressure diving into SE Asia is usually a good launching point for processes that lead to cold east of the Rockies
-
Winter 2023-2024
griteater replied to Stormchaserchuck1's topic in Weather Forecasting and Discussion
Here's the weenie version of the RMM...slow trek thru 8-1-2. This is titled 'Total'. It is the regular MJO plot, but 'retaining the interannual 120-day signal'....so, the MJO atop the El Nino signal. Sounds logical to me, but I haven't used it / seen how it performs / biases etc.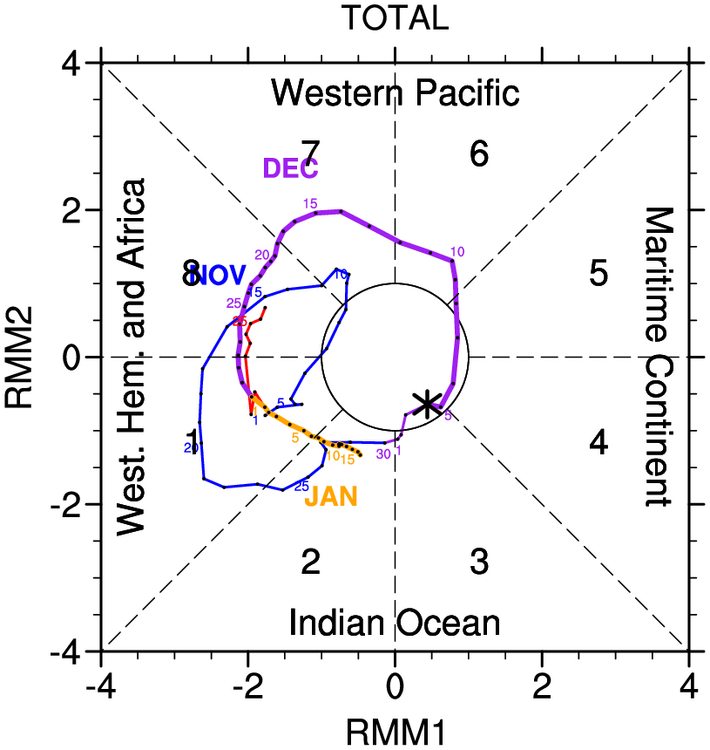
-
-
Winter 2023-2024
griteater replied to Stormchaserchuck1's topic in Weather Forecasting and Discussion
^ No shortage of ridging in W Canada. Impressive showing from the Euro Seasonal for the E U.S. Here is JFM precip... -
Winter 2023-2024
griteater replied to Stormchaserchuck1's topic in Weather Forecasting and Discussion
Dec 5 - My thoughts on the upcoming weather pattern with Southeast and Southern Mid-Atlantic focus... -
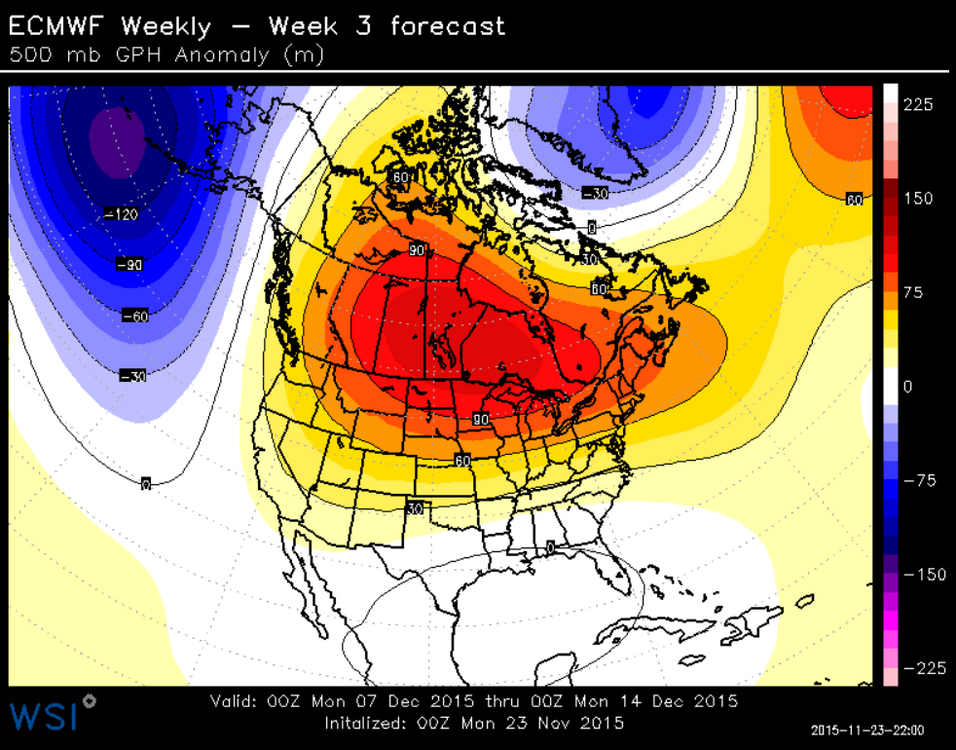
Sometimes I feel like the Pacific Jet is the Rodney Dangerfield of weather forecasting. We actually need an extended jet to get +PNA patterns. -PNA is the opposite...it is associated with the Pac Jet being in a weakened state where it is retracted back to the W Pacific (red and blue contours on the image are the height anomalies), Of course, there are other flavors. If the jet extension runs poleward, then that does favor low pressure in AK...but the point is, the Pac Jet strengthening and extending shouldn't be binned as a bad thing in all cases for the eastern U.S. Bouts of warmth here in mid-Dec has been pretty well expected. I think the bigger questions come late Dec into early Jan Source: https://www.weather.gov/media/sti/nggps/Presentations 2017/08 NGGPS17_PImeeting_Bosart.pdf
-
Winter 2023-2024
griteater replied to Stormchaserchuck1's topic in Weather Forecasting and Discussion
https://www.nasa.gov/solar-cycle-progression-and-forecast/ Problem is, I don't see anywhere on the web where they have these geomag plots going way back in time (they do have them for solar cycles - sunspots), but you can get geomag data (Ap) back to 1932 here: https://kp.gfz-potsdam.de/app/files/Kp_ap_Ap_SN_F107_since_1932.txt -
Winter 2023-2024
griteater replied to Stormchaserchuck1's topic in Weather Forecasting and Discussion
I'm thinking the winters of 25-26, 26-27, 27-28, 28-29 will be the most problematic for -NAO from a solar geomag standpoint. Of course, the timing could change a little -
Winter 2023-2024
griteater replied to Stormchaserchuck1's topic in Weather Forecasting and Discussion
-
Winter 2023-2024
griteater replied to Stormchaserchuck1's topic in Weather Forecasting and Discussion
Good to see you in these threads Don. Yeah, I saw that about the NOAA PV Blog. I thought Judah Cohen's PV blog was a good one this week (https://www.aer.com/science-research/climate-weather/arctic-oscillation/). He mentioned that Canadian Warmings are often followed by PV stretching and cold outbreaks (even though at the time, the models weren't showing the PV stretching)...but sure enough, the models have come around to that a bit in the strat, just not showing much AK ridging in the trop...but that could change in time (I think it will). This is an Op run (GFS), but it shows the potential strat progression which could aid a cold outbreak -
Well dang, you are going Barry Bonds hit in the bay right there


