

Stormchaserchuck1
-
Posts
2,038 -
Joined
-
Last visited
Content Type
Profiles
Blogs
Forums
American Weather
Media Demo
Store
Gallery
Posts posted by Stormchaserchuck1
-
-
57 minutes ago, psuhoffman said:
The logical assumption is -nao. Something is clearly running interference. Maybe the WV from Tonga. Maybe the pacific base state. Dunno. But I’m skeptical.
I'd be interested to know why we aren't getting -NAO's too, especially sustained -NAO's. The CPC has us +1.10 for DJ, and it looks like another >+1.00 month for February as per their method of calculating. Going back in their stats, we have had 1 -NAO January since 2011 (12/13 years positive!), and 1 -NAO February since 2011 (12/13 years). That's crazy. I think their calculations is more based around SLP near the Azores, but wow! Beyond that, when the NAO goes negative on a daily basis, it's usually no more than 10-14 days.
-
43 minutes ago, psuhoffman said:
I think you’re talking about the ridge in the central pacific near the Aleutian's right?
Yeah, you're right.. shorter wavelengths in March make the downstream Aleutian islands ridge not have as much effect as it would in January.
.gif.e27e610c3e758b536126c52ff7bc9104.gif)
NAO is the bigger variable in March if they are both the same strength, although the Greenland ridge can spill into the NE sometimes.
.gif.07b37074c4f3ee919d9451d3e97dc1e9.gif)
But what you don't want to see is that trough over Alaska and the Bering Strait.. just about all times of the year that is a warm to very warm pattern. Models do have have that feature in the long range.. this isn't like last March where the ridge was building up into Alaska. The N. Pacific Aleutian islands ridge that I am talking about, that looks so impressive on MR-LR models, is flat and south-based, and has a trough over top of it. That could give us 50s and 60s high temps for some time, if the -NAO doesn't depress the pattern.
.gif.23f91ebeb07cb7de55963a401d04059f.gif)
We have had +WPO and +EPO a lot of the Winter (^opposite temperature graph as the map above).. some research I've done suggest that they are heavily -PDO correlated, although there certainly could be other reasons.
-
8 minutes ago, Blizzard of 93 said:
The latest Weeklies get the patten workable by the week of the 11th to the 18th.
The pattern on the Weeklies then continues to look workable through the end of March.
I don't know.. the El Nino's about to take a big hit. These -2-3c anomalies are about to make it to the surface
I wouldn't be surprised if some cold water started to appear at the surface in the next few weeks.
-
 1
1
-
-
There have been a lot of clear sky days lately. With the pattern switching to La Nina, maybe we are going to start having drier conditions.
-
1
-
-
38 minutes ago, WEATHER53 said:
Only 15-30 days away. It’s become lunacy vs discussion. Reminds me of political sites where wishes and feelings overtake reality and outcome
That’s a bad direction switch from just 5 years ago
I think it will verify.
Everyone pretty much knows that it's not going to snow for the next 16 days. That would be much more difficult without models.
Humans like to be challenged, because that's how they learn best.
-
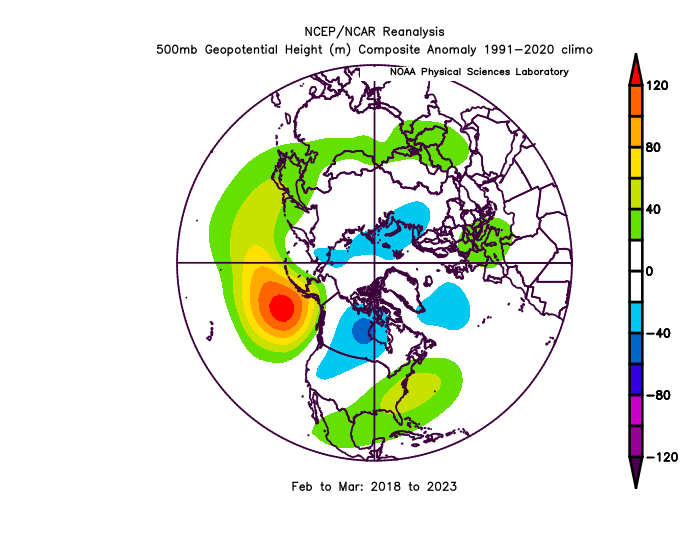
That is a massive -PNA (in the Pacific) through Day 16 on the 12z GEFS!
-
1
-
-
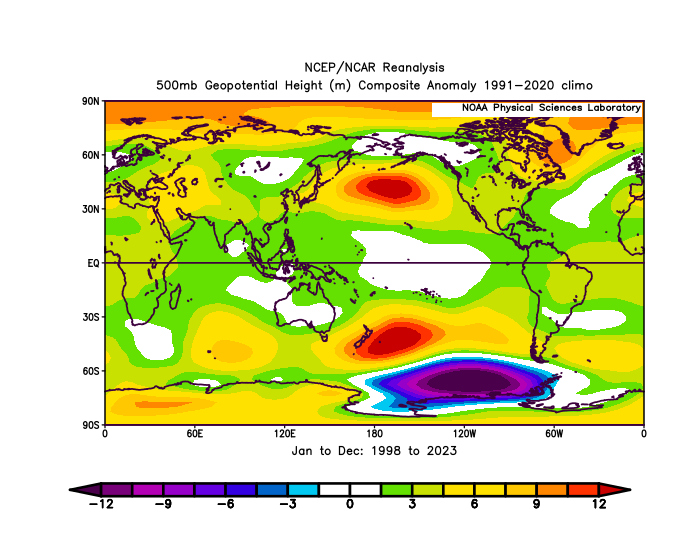
A hot summer may be likely.
Here is Summer patterns of all 19 La Nina's minus El Nino's since the PDO went negative, and AMO went positive in ~95-98.
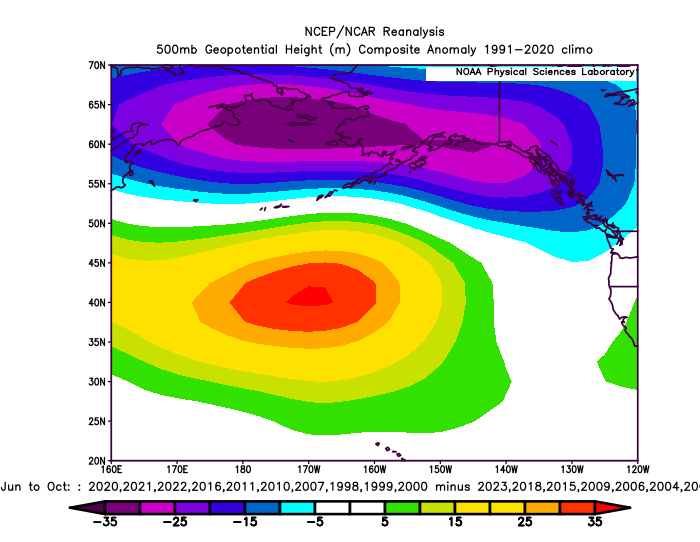
That trough up north over the Bering Strait and Alaska is a very warm pattern for the CONUS:
.gif.bae5992e50d85ba594b1ce5c54ff1efd.gif)
0.5 is a high correlation for what's going on far away in the Summer months. Here's the long wave connection
-
2
-
-
Weird that the CDC composites doesn't have it. https://ibb.co/syZ7nVz Unless this is it? https://ibb.co/hC0bxT5
-
The orientation and strength of current Atlantic SSTs supports an active season. Here is an anomaly map:
.gif.d3d05fefd391c9c59ce7af08bb2c54bd.gif)
Since 1995, Positive analogs: 2016, 2011, 2010, 2007, 2002, 1998
Since 1995, Negative analogs: 2018, 2015, 2014, 2012, 2009, 1999
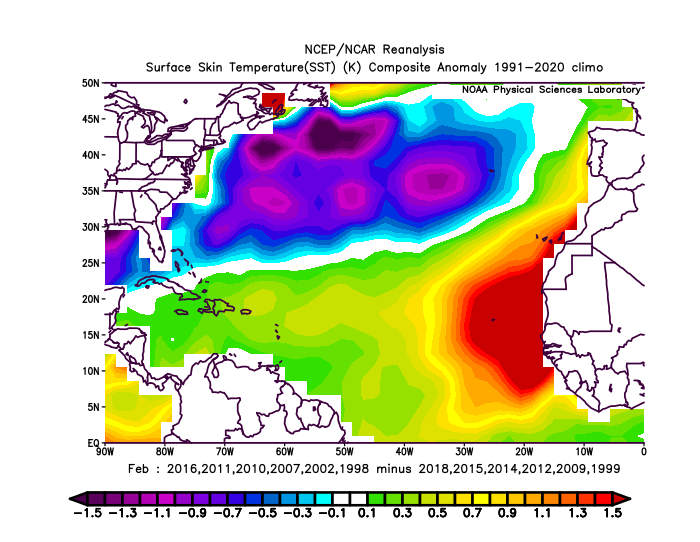
Positive analogs: 15.5 NS/yr, 7.7 Hurr/yr, 3.3 MH/yr
Negative analogs: 12.3 NS/yr, 6.5 Hurr/yr, 2.5 MH/yr.
(12 analogs encompasses 41% of total timeframe (95-23))
Feb 2024 is the warmest east of the Caribbean of all the analogs.
-
Mitchnick posted something today that models are projecting a 10mb wind reversal March 5 - Apr 2. There is a 10-15 day lag at this time of year with most probable -AO effects, so that would support a ~March 15-Apr 12 -AO, if it verifies.
We had this cold 10-day period in January: https://ibb.co/wYR5Jqk But otherwise, it's been a very warm Winter. If I graded the last two 10mb warmings with average time lag, it would just look warm everywhere.. that doesn't necessarily mean late March is going to be warm though.
Models haven't been too great on the strength of these Stratosphere warmings so far this Winter, but they have been right from this average time lead, of events happening. That we have a strong -QBO (2nd lowest January reading on record) and Stronger El Nino also supports +10mb conditions persisting through the cold season..
-
1
-
-
I think that after the Sun started quieting down after the 1990s, we started getting more La Nina's:
-
 2
2
-
-
14 minutes ago, Ralph Wiggum said:
Chuck, what say you about the mid lat blocking during hurricane season? Do you see that on the increase with the shifting ocean currents that scientists have predicted?
I think the Hadley Cell is really strong right now. I'm very impressed by this -PNA, and that it looks to continue through March. I think that favors a hotter Summer, which would mean possibly ridging in SE Canada, which favors SE hits, but we haven't seen that pattern in many years, but I don't see +pna's/passing troughs in the heart of Summer this year. Raleigh, NC is likely to go 1000 days without any snow!
-
8 minutes ago, Ralph Wiggum said:
So with the "oceans on fire" that I've seen posted here, maybe we should move on from big snow tracking because obviously that isnt working, and start tracking landfalling canes in the Mid Atlantic and NJ. We're due for another Sandy. Well, not really and this post is pretty much just sarcasm, but I wonder if we will start seeing more Northern landfalling tropical systems up this way in the coming years? Would make for an Interesting study anyway.
Atlantic Hurricanes have increased 180%, but EC landfalling storms are only 60% during that time. The biggest difference is over SC/NC, and I think the east coast of Florida is also below average.
-
43 minutes ago, psuhoffman said:
You’re just wrong here Chuck. We didn’t get less snow because of low ratios. We got less snow because the fgen banding that models had over us shifted north into PA. Guidance showed .4-.6 qpf across DC, Northern VA and MD 12z the day before the storm which was the run used to issue the warnings. The area got closer to .15-.3 qpf. The places that got the banding we were supposed to get ended up with like 10” from .5 qpf. That was supposed to be us!
The depth maps were wrong. They showed no one getting more than 4”. Places got 12”+. A huge area for 4+. It was just north of us. The maps were correct for DC but for the wrong reasons. That’s not good science.
I guess we could have done better in this storm. I was all over presidents day time period like 20 days ago, because there was a favorable 500mb setting up. If you plot most snowfalls for the area, you really see that feature of +PNA displaced a little east, over the gulf of alaska, but still far enough west where we get a downstream trough. We repeated that pattern perfectly for this storm. Then there were mild -NAO conditions. When Allentown, PA plots 12"+ snowstorms, the pattern matches! That's all. If anything it speaks about how model progression has really slowed since the early 2000s, when a LR 500mb can hit it but not the Hrr and RAP lol.
-
1 hour ago, Heisy said:
SSW magic still on the table, will be interesting see if see any changes in the LR with Atlantic blocking. I’m no expert in the Strat that’s for sure but it can’t hurt. 3 week lag time or so takes us to like end of first week of March.
Yeah we have a pretty good warming going on now.
The lag at this time of the year is 15 days, so that puts us into the first few days of march with -NAO correlation.
Some models are showing an aggressive 2nd wave warming ~March 5-25. That one is +10-15 days, so March 15-April 5 -NAO correlation.
The problem is the Pacific 500mb pattern.. we need a pattern change there. Subsurface ENSO cold water has changed the PNA to negative, and with lingering -PDO the EPO is positive there.. our chance is that these cycles tend to happen every 40 days (MJO, etc), so after some time the -PNA tendency starts to wane a little. If we can time a Pacific change with favorable NAO in March, but we just have so much tendency toward a bad Pacific/warmth for March right now.. I've posted this earlier, but we have the highest 6-year anomaly for a 2-month period on records, by a good 20%.
^ 3 Neutral/El Nino years happened within that, too. Just a really strong part of the cycle we are in. I would think if the NAO goes negative in March, its long term correlation would hold, and we would have more tendency to have a -pna/+epo pattern too. We'll see!
-
1
-
-
Man Roger tough luck.
-
4 hours ago, psuhoffman said:
The depth maps are too low. They just are. They’re only “right” when snow ends up low in a location because the storm missed them.
Then you're not paying attention. If they weren't valid, I wouldn't use them. I get your blank assertions knowings. They probably have busted more times too high than too low over the last 4 years. The last 2 storms are great examples of 20:1 posting model charts showing 6-8" vs 2" snow depth, and the later verifying. Everyone acts like the models shifted last minute. That's really what they tell themselves! "384hr GFS again"!
-
3 minutes ago, GaWx said:
Chuck, I have this winter as basinwide/cross between EP and CP as 1+2 fell sharply before winter and 3 has been about same as 3.4. In addition, 4 has been quite warm vs its own climo.
Also, an argument can be made that this was a moderate if one were basing this on either the RONI peak of only +1.49:https://www.cpc.ncep.noaa.gov/data/indices/RONI.ascii.txt
or on the MEI peak of only +1.1:
https://psl.noaa.gov/enso/mei/
Yeah, I mean the 500mb pattern matches east-based Nino's vs central or western based. I know we started off east-based, but you're right, technically Nino 4 was pretty warm.
-
2
-
-
16 minutes ago, mitchnick said:
Have you ever seen an extended period like the one the Eps is showing for March? Can't say I really followed this stuff too much before this year so I have little reference or experience.
I plotted them all before, but I lost the research, or I would give you analogs. I'll have to go through and do it again. I do know the EPS was showing a strong reversal from about this range (for January) all through December, and that ended up being only really 3-4 days of strong anomalies hitting +1800-2000. The rest of the days were +1000-1400. Historically, there quite a few events that went >+1800 for many days (10-14+). It seems that the EPS is showing that stronger event happening, but it has been a little flimsy in the long range this year.
I also think that if there is tendency for the NAO to go negative in March, I think there will be equal tendency for -PNA/+EPO conditions to also occur.
-
1
-
-
30 minutes ago, mitchnick said:
Anybody still watching the 10mb for SSW? Today EPS show it happening in a few days, recovering briefly, then switching direction again for an extended period. That's crazy.
The effects on the 500mb NAO are almost immediate (~10 days) once you get to mid-late March.
We have a minor warming going on now: https://ibb.co/YBdKxQb The typical lag time in mid-late February is 15 days. They are minor NAO correlations for minor Stratosphere warmings though.
-
2
-
-
21 hours ago, raindancewx said:
I suspect the water vapor from the volcano is what drove a lot of the precipitable water though. I've also seen some papers recently saying that the hole in the ozone layer by Australia was likely damaged by the eruption based on observations that were taken immediately after. Anything that impacts heat/energy transfer unexpectedly is a big deal really.
The pink, purple, orange skyline/clouds in the last few years is too dreamy to be from a volcano.
-
1
-
-
Thanks. It's amazing how much we matched PDO this year:
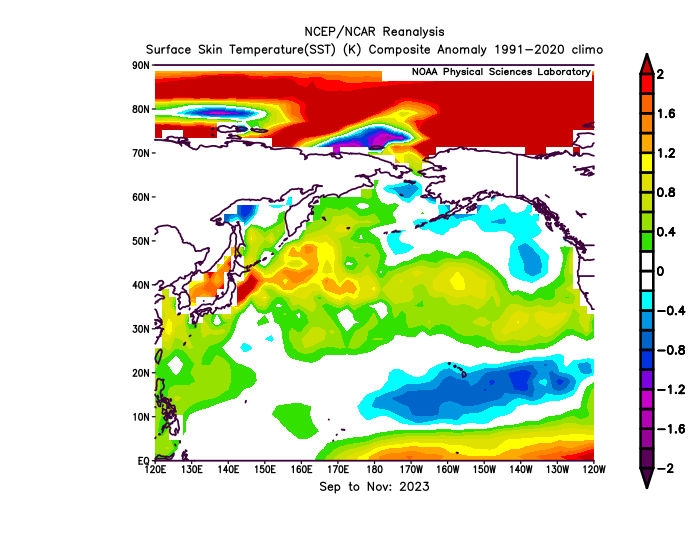
All you had to do was roll forward that SST configuration in the Summer/Fall.
You can see how El Nino correlated too, with the NPH (North Pacific High) off the West Coast, US, rolling up into Siberia.
.gif.870c2030a8654720a3ab5239e87fffc8.gif)
Combination of Strong East-based El Nino and Strong -PDO (Fall) did very well in the Pacific 500mb this Winter.
-
1
-
-
7 hours ago, psuhoffman said:
Chuck, I’ve joked about the resolution of those maps but seriously it’s time to have a real discussion about the depth maps.
I don't really feel like arguing this. Let's just say to check the soundings is the best way to go. Another point is that in the warmer sector of the last few storms, we have been drying up. That's because the frontogenesis sets up to the north where it's colder. They are not really two separate things. I noticed in 2020 I think that the snow depth was hitting it every time, and that continued through last year, and now it's 5/6 in the area this year.. it's just a little weenieish to post that 0.58" of precip is going to produce 5-6" of snow when the temp is 35. I feel bad because I know there's a lot of younger people that check the board (like me when I was younger) and they just want an accurate assessment. I don't really feel like arguing this anymore though.
-
I think +PNA still works. I've seen many cold periods lately, when the PNA lines up right. The -NAO is ridging north, and even the -AO and -EPO to an extent, but the W->E flow pattern is still in effect. The global +13dm -PNA over the total last 25 years is a major anomaly, and no one should be making assessments about snow seasons being over because of that anomaly. As far as I know, it's cyclical.
Late Feb/March Medium/Long Range Discussion
in Mid Atlantic
Posted
Well, here ya go.. +12 months PDO (chart maps default is positive, so negative PDO is opposite)
I would say since it's performing strong relative to Strong Nino right now makes it a peak-time index.