

Stormchaserchuck1
-
Posts
2,040 -
Joined
-
Last visited
Content Type
Profiles
Blogs
Forums
American Weather
Media Demo
Store
Gallery
Posts posted by Stormchaserchuck1
-
-
2 hours ago, FPizz said:
Did the trimonthly get to 2.0 for this to be super? I feel like I've seen both listed elsewhere.
It did. https://origin.cpc.ncep.noaa.gov/products/analysis_monitoring/ensostuff/ONI_v5.php
Since 1948, The 4 times we had a OND ONI +2.0 or greater, we had a La Nina the following OND. One of those was the strongest La Nina on record (1973).
-
 1
1
-
-
3 minutes ago, Maestrobjwa said:
The problem with moving for snow when it's been this bad is...most people can't move to the mountains. Career opportunities for most is closer to where people actually live...the corridors!
Now I am still shocked that the snow climo dropped off so drastically for Boston. Is even their's damaged now? But if it's bad from Boston on down, there's literally nowhere to go and have a career in whatever field you are. Everybody can't just pile into WV!
I think we all are gonna have to make peace with it if things don't/can't get better. No choice, really...otherwise woodland creatures wouldn't be safe

I thought it was telling when Boston only had 2" of snow in the core of Winter, I think it was either 17-18, or 19-20. The jet stream has been lifting north for sure..
-
12z GFS ensembles trended much more -NAO, starting the first few days of March. We had a minor Stratosphere warming Feb 15-23, so the beginning of March actually fits the average lag for warmings at this time of year.. interesting that standard methods would have got it right, and not models until now.. problem for snow/cold is the Pacific pattern is bad for the foreseeable future..
-
18z GEFS tries to develop a west-based -NAO block by mid-March. Let's see if the Pacific pattern breaks down shortly after.. I think if we have a big -NAO develop, the Pacific will correlate and -PNA/+EPO will prevail..
-
2 hours ago, GaWx said:
We finally reached the coldest normal mean of any day in the Arctic, Feb 25th. Compare that to mid to late Jan for a good portion of the US, including the SE. For about the next two weeks, the daily normals only very slow warm and are still only near Jan normals. Only afterward (after Mar 10) the warming of normals accelerates. There have been many winters when the coldest Arctic day was in Mar, especially recently.
Very interesting that, that's when the N. Pacific High has been fluxing:
This 7-year trend now, is record breaking ('64-69 -NAO comes in 2nd, at 80% of the anomaly).
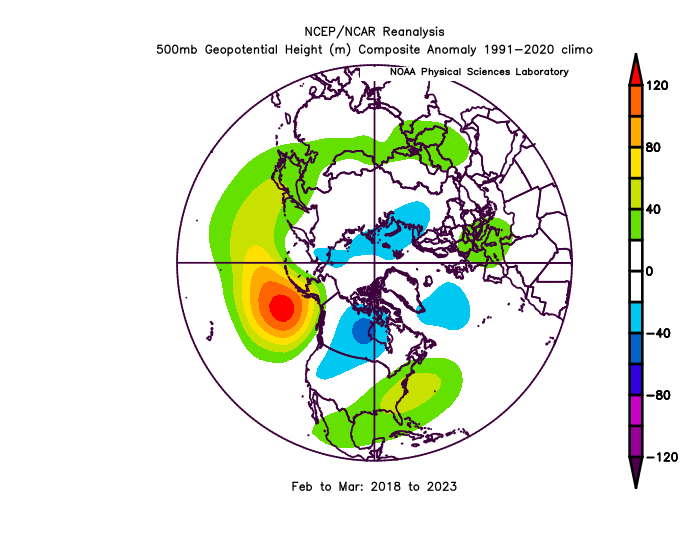
2-months including March is also record breaking for a 6/7 year stretch.
-
2
-
-
Yeah, PDO's usually go in the direction of ENSO state like 85% of the time.
Another thing too is, this La Nina is already heavily supporting -PNA.. Since the subsurface cooled, and the SOI flipped, this new High pressure pattern took over in the N. Pacific. so if that trend continues through the Spring and Summer, which I think it will, the PDO should drop further.
-
 1
1
-
-
6 hours ago, psuhoffman said:
When I look at this I think warm. It’s definitely not ideal. But I don’t think 3rd warmest winter ever across the US! Warm yes. Not close to warmest ever.
The crazy thing about this map and us being the 3rd warmest is, it looks like it's a -AO pattern! It was once theorized that AO was our #1 pattern for warm and cold, but there have been some warm -AO's the last few Winters.. I think the key these days is more on the Pacific side. The circulation between the Poles and the mid-latitudes seems to have quieted down some.. it's more about having more low pressures around the Earth at your latitude.
-
2
-
-
1 hour ago, psuhoffman said:
Wouldn’t the expanded Hadley cell explain. If the jet is shifted north in the pacific the compression of the flow between the subtropical, polar, and arctic jets in the pacific speeds them up. Its also shifting the NS north. Add in the -pdo Nina base state that puts a ridge in the east more often. That’s a bad combo for getting a trough deep enough to get a clipper here. Doesn’t seem like a mystery to me.
The thing about the expanded Hadley Cell is, what's causing it? For the Hadley cell to expand, another cell has to contract. You could say that the +AMO and -PDO favor more mid-latitude High pressures. I also think it could come from more La Nina patterns that we have seen (almost 2:1), since sunspots started quieting down in the 1990s?
In global warming, the poles are hit the hardest, but it seems like a La Nina pattern to me. That doesn't mean general warming still isn't occurring.. it is, and actually, almost exponentially.
-
2
-
-
Here is what I accidentaly posted in the long range thread.. I left it there because PSUhoffman replied quoting it.
I think the reason for less clippers and Miller A's is lack of +PNA, although even when that pattern is present, those two storm types are happening about 30% less of the time.
Basically.. I don't have a good answer for you. The pattern has been more zonal, vs major troughs.. now, the -PNA that we have seen since 1998 and then 3x more since 2016 is a real anomaly, and not a product of global warming.
-
We had a minor 10mb warming Feb 15-23
.gif.3de8112b7c845eb6c09b3a07154caeb9.gif)
The estimated time to impact, March 3-10, looks very warm on current models in the Eastern, US (No +NAO though, it's because of +EPO/-PNA). We may get cold shots in the West during that time.
This was our 3rd 10mb warming event of the Winter season.
I believe models were showing a 4th warming event starting after ~March 5.
-
1
-
-
Oops.. I meant to post it in the other thread. Oh well, might as well say that until that trough moves from Alaska, we will be in the 50s and 60s. Good news is LR models haven't been great this year.
-
I think the reason for less clippers and Miller A's is lack of +PNA, although even when that pattern is present, those two storm types are happening about 30% less of the time.
-
1 hour ago, psuhoffman said:
When I look at this I think warm. It’s definitely not ideal. But I don’t think 3rd warmest winter ever across the US! Warm yes. Not close to warmest ever.
+EPO/+WPO floods the surface CONUS with warm air. The number 2 on record, I think? 01-02, had a similar pattern.
We are also shattering previous records for global temperature, the chart is starting to move more exponential.
-
lol.. you guys.. Raleigh, NC is going to go 1000 days without any snow, no flurries, nothing. Richmond hasn't snowed in 2 years.
-
3 hours ago, PrinceFrederickWx said:
What’s your sample size for a -QBO strong Nino?
There's a really strong 10mb correlation with -QBO/Stronger Nino and +QBO/Stronger Nina.. but that's about as far as that goes.
QBO is an upper atmosphere wind index.
-
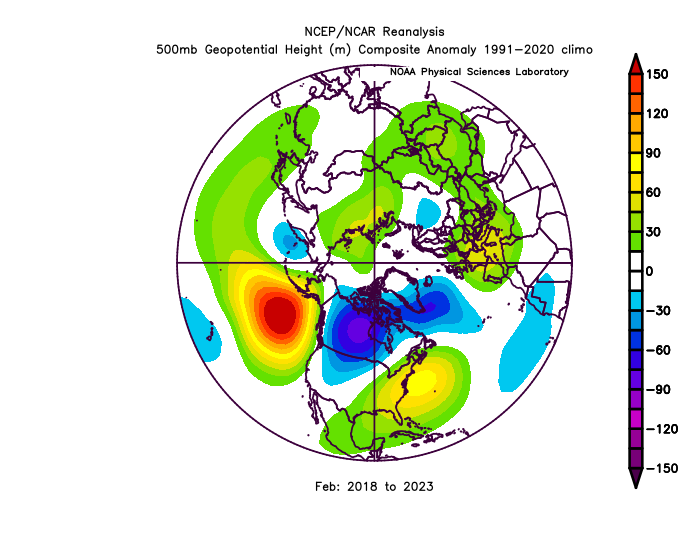
For the next 2 weeks, there is an impressive High pressure setting up in the N. Pacific Ocean. The strength is going to rival some of the strongest on record. This pattern started, imo, when the cold water moved into the central-ENSO-subsurface. The SOI being super negative was holding the pattern back for a while, but when that moderated, the major pattern moved into the N. Pacific Ocean. It seems to be super-connected to the La Nina early, so I don't see why that wouldn't last through the event, and maybe even with such a strong correlation that it holds the strength of the coming La Nina down some.
With the 500mb conditions in the N. Pacific that have occurred Feb-March 2018-2024, breaking high anomaly records in other times by +20-25%, it's easy to formulate that we are at the peak of this "global La Nina cycle", or some are calling it the -PDO, or +AMO. The -PNA pattern held in the Summer/Fall through a lot of the Strong El Nino last year, breaking the strong-ENSO correlation we had, had for many decades, so it will be interesting to see what happens going back to the opposite ENSO state this year. La Nina's have been hitting on N. Pacific pattern correlation, El Nino's have not been.
-
4 minutes ago, Jebman said:
80 degrees in Buda, in FEBRUARY!
WE are doing very good, right on track for a record warm EARLY SPRING then a HELL HOT SUMMER with all time record highs! Maybe even some 105/83 conditions in direct July Texas sunshine! I'd enjoy some 129 heat indices! While working outside at 3pm in direct brilliant Texas sunshine!
This is gonna be GOOD!
Lol, yeah, we have a really hot Summertime pattern setting up now.
It's connected to the La Nina early, so my thoughts is it will continue if the La Nina does continue to develop.
-
Better start breeding those butterflies in Africa.
-
1
-
-
56 minutes ago, Blizzard of 93 said:
Yes, the AK trough is still there at day 15, but the trough is undercutting in the southern US.
The undercutting “blue” on today’s 12z run has advanced further to the east into the western Carolinas this run vs. last run.Today’s run also doesn’t connect the southeast ridge with the northern ridge in the east that is lifting up into eastern Canada.
There’s still work to do, but the first step is getting the massive eastern ridging booted out.
12z today topThe surface is very warm in that pattern.. warmer than 500mb implies. Here's the March correlation (opposite)
.gif.e12621d00857ac5725966149d6ad2918.gif)
.gif.7d49d171e69db995a2e2554bf50641f0.gif)
-
GFS ensembles trended warmer today.. On March 3-4 on the 12z GEFS, the 570dm line goes north of Toronto! The big difference is the NAO-domain.. yesterday they were showing signs of blocking in the long range.. today, there is +NAO in the medium range, and neutral in the long range.. Agrees with my Natural Gas analogs, which I posted about yesterday.
-
5 hours ago, psuhoffman said:
But you’re discounting the link between enso and the epo. It’s rare for a strong Nino not to impact the pacific pattern more than it did.
The PDO actually has a high correlation with the EPO-WPO (even with lead time)
Here's a post
-
4 hours ago, psuhoffman said:
This was a true disaster!
I think you underestimate the EPO/WPO.. when they are +, they are some of our worst Winters.
Yeah, -PNA's can be wet.. but precip plus temps in EPO patterns is the highest of all patterns (+snow), by a pretty good margin! I said before 1 reason they didn't show up in your research, is because the average cycle of a flux there is 7-12 days at a time, The PNA and NAO regions last much longer (can go 30-40+ days, which makes them more visible).
-
2
-
-
57 minutes ago, Ji said:
Now we need all that with apparently a modoki moderate Nino with a positive pdo
Sent from my SM-A515U using Tapatalk
The differences between weak and stronger ENSO events, are because there's more happening all the time than just ENSO. A small sample size gives skewed results because of coincidence, or it lining up with other factors.
Weak Nina's were always cold in the composite, until a few years ago, when they started to go warm.
If it's a modoki Nino, the stronger the better... you will say, well, 91-92, but that's a total of 0/1 all time.. I think we want forcing out of the western-ENSO regions to amplify above it a +PNA and maybe -EPO.
-
I don't think it was a true disaster because we had 4 Stratosphere warmings (if you include the one projected to come in March). The QBO does not effect the surface directly, all of its linear correlations are weak. It's an upper atmosphere oscillation.
I did pick the -QBO/Nino, and record global precipitation in the Fall to have high totals in the snowfall forecast. I did not really think we would be that cold, but I thought our opportune times (When -NAO's came in El Nino) could give us big storms (in contests you do not want to not be near the majority). I underestimated the effect of the PDO, and that the global pattern is very stagnant right now (High pressure systems).
Late Feb/March Medium/Long Range Discussion
in Mid Atlantic
Posted
CPC is pretty big on the +EPO pattern sticking around
https://ibb.co/37rmSNg