

Stormchaserchuck1
-
Posts
2,038 -
Joined
-
Last visited
Content Type
Profiles
Blogs
Forums
American Weather
Media Demo
Store
Gallery
Posts posted by Stormchaserchuck1
-
-
11 hours ago, so_whats_happening said:
I was just about to post this quite the increase in negative anomalies (or decrease, however you choose to look at it) in just 5 days. This also seems farther west then past events have shown which end up around 120-140 W currently this is sitting just east of the dateline.
-PNA pattern starting to set in. https://ibb.co/DVGmNdf
I've researched this, the PNA is more sensitive to ENSO central-subsurface than any other ENSO measurement, including surface SSTs and the MEI, at 0-time.
-
 2
2
-
-
Really cold in the subsurface now. For comparison, this may rival the strongest subsurface anomalies we saw in this past El Nino.
.png.7cb2446f96216449c7b327a0d4a2c454.png)
-
1
-
-
All time Hurricane tracks
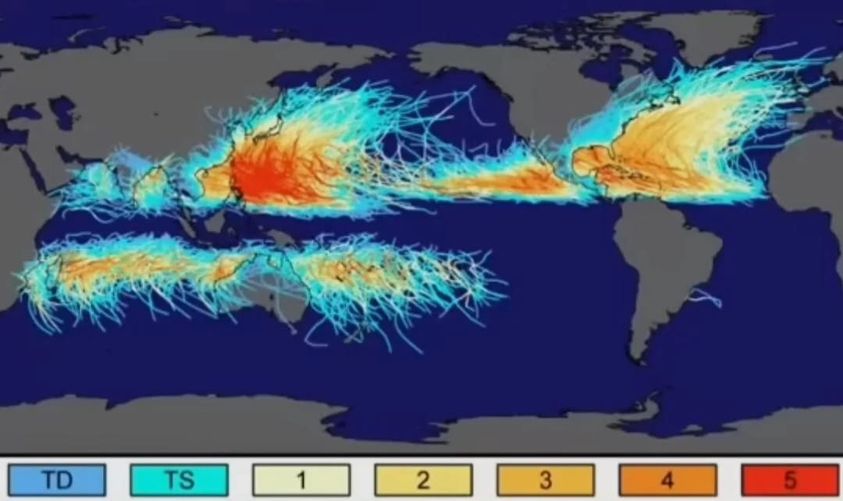
East coast, US has been lowest relative to long term average, and vs Atlantic activity lately (since 2000).
-
The central-subsurface is cooling rapidly.
-
We had an expanded Hadley Cell/N. America SE ridge since late January:
.gif.d717ac698f2c4a10884aaf50a88bae50.gif)
I've theorized that ENSO subsurface conditions have a stronger correlation to the N. Hemisphere pattern than the surface does at 0-time (not perfect, but more often than not, historically.. ). We had cold water move below the central-ENSO region during mid to late January...
I made list of analogs matching this US Temp pattern, since the AMO went positive and PDO went negative ~1995. These transitioned from an east-based El Nino look in April, to a stronger La Nina by the following December.. (13 analogs):
.png.f2b9851f2ed5ac441f82de5da35bda79.png)
-
1
-
-
Big US SE ridge pattern, extending up into Canada Jan 23 - March 14:
.gif.b61cb13a19bce3b451784df9e63a5dec.gif)
Hadley Cell extends north in the Pacific and Atlantic Oceans in April (analogs rolled forward)..
A correlation to following Atlantic Hurricane season has been strong since 2012:
Positive analogs: 2023, 2020, 2017, 2012, Average Storms for Positive analog seasons: 21.8 NS, 9.8 Hurricanes, 4.5 Major Hurricanes
Negative analogs: 2015, 2014, Average Storms for Negative analog seasons: 9.5 NS, 5.0 Hurricanes, 2.0 Major Hurricanes
-
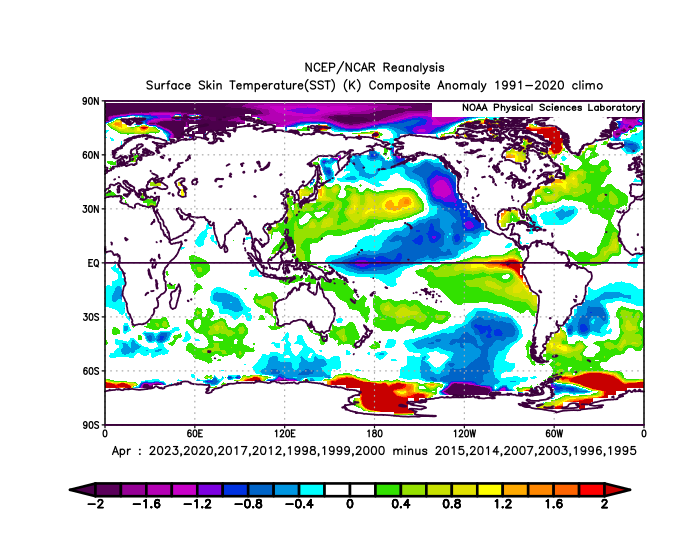
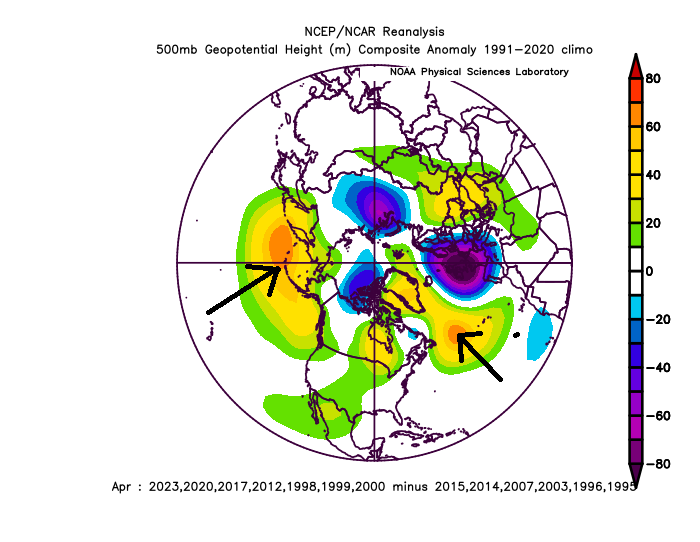
We may be headed for an above average Spring.. I know that's not saying much, but..since the AMO went positive/PDO went negative ~1995 here are our top analogs to this composite since Jan 23rd:
.gif.7d71dee02bf8c54442db05f0a41d3c57.gif)
Positive analogs: 2023, 2020, 2017, 2012, 2000, 1999, 1998
Negative analogs: 2015, 2014, 2007, 2003, 1996, 1995
^13 years since 1995...
Roll-forward to April:
.png.c97359afe5cc34086ff2acc2ec224086.png)
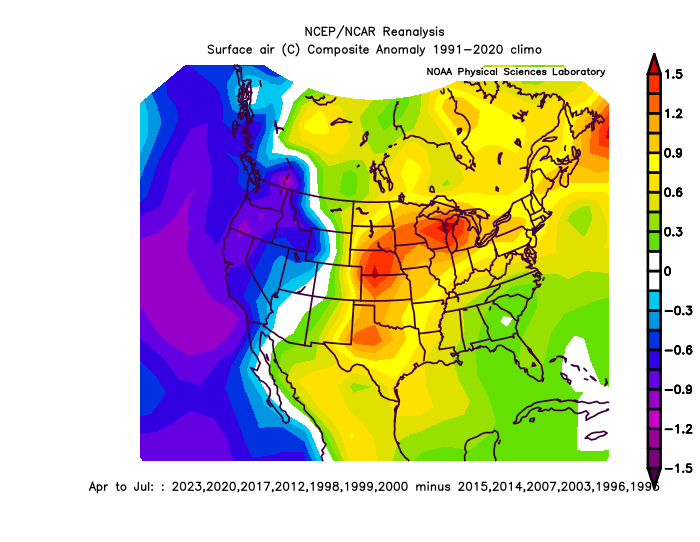
April through July:
-
1
-
-
CPC is now giving >80% chance of La Nina for peak Hurricane season
.png.51769e7a48fd48fc580c068456fef8f0.png)
Climate models are keying in on possibly a transition to Strong La Nina later this year
.thumb.gif.615c5b49c917d9211804cc5eb39f95c1.gif)
The SE Atlantic Ocean is still very warm, as several countries in Africa have recently broken temperature records.
-
1
-
 1
1
-
-
On 3/12/2024 at 9:50 PM, Stormchaserchuck1 said:
The Pacific pattern actually changes this weekend, and sometimes when we have cold the day of (warm the day of too), models go more aggressive on the same pattern initialized out down the road.
With that being said, it is 70 degrees out the next 2 days, and the PDO still has not changed, so the same model trend that has occurred all Winter has a chance to repeat in the next few days, going not as aggressive with the cold in the LR..
Yup, two warm days, and the LR look for significantly below average/-NAO is gone..
Models initialize current conditions out. For example, if they are saying the LR is going to be severely cold, and first you have two 70+ degrees, you should figure that during those two days the LR models are going to completely lose the cold signal.
-
Easily coasting up to 76 here in northern MD
-
1
-
-
Denver area continues to do well with snowfall. They are in a sweet spot with the warming, like NYC was 2010-2015. Meanwhile, we are almost 80 in Baltimore.
-
The sun is pretty hot today. Like, hot. This thing is taking over pretty quickly.
-
Pretty awesome pattern for below average here:
Too bad this didn't occur in the Winter time..
The Pacific pattern actually changes this weekend, and sometimes when we have cold the day of (warm the day of too), models go more aggressive on the same pattern initialized out down the road. I think we can hold out some hope for some snow flakes in northern MD by the end of March..
With that being said, it is 70 degrees out the next 2 days, and the PDO still has not changed, so the same model trend that has occurred all Winter has a chance to repeat in the next few days, going not as aggressive with the cold in the LR.. If it holds though, that's a really nice look at least for some below average conditions in the NE for the last few days of March and into early April..
We do have a strong 10mb warming going on now, so that at least supports what the model shows (average time lag at this time of the year is +10-15 days)..
.gif.25e72d9d918da2214119185c7b186f42.gif)
-
On 3/9/2024 at 12:25 PM, Stormchaserchuck1 said:
The NAO is just not sustaining negative lately.
Winter 23-24:
Dec 2023 +1.94
Jan 2024 +0.21  Feb 2024 +1.09
Since Dec 2013, only 5 Winter months negative (41/46 positive)
Dec 2011  2.52
2012   1.17   0.42   1.27     Dec  0.17
2013   0.35  -0.45  -1.61     Dec  0.95
2014   0.29   1.34   0.80     Dec  1.86
2015   1.79   1.32   1.45     Dec  2.24
2016   0.12   1.58   0.73     Dec  0.48
2017   0.48   1.00   0.74     Dec  0.88
2018   1.44   1.58  -0.93     Dec  0.61
2019   0.59   0.29   1.23     Dec  1.20
2020   1.34   1.26   1.01     Dec -0.30
2021  -1.11   0.14   0.73     Dec  0.29
2022   1.08   1.68   0.77     Dec -0.15
2023   1.25   0.92  -1.11     Dec  1.94
2024   0.21   1.09
Never going below -1.11 for the Winter month since Dec 2013.
Since Dec 2013, 16 Winter months over +1.11! (16-0)
A lot of that has to do with the southern part of the NAO measurement, near the Azores, and spread out over the N. Central Atlantic Ocean.
Upon further review, there is something wrong with the CPC's NAO calculation.
This is not a strongly positive NAO:
Looking back over past Winter's, there were a few -NAO's in there too, that were deemed to be positive. The NAO is calculated by sea-level pressure differences between Iceland and the Azores. High up top, Low at the bottom, is -NAO. Low at the top, High pressure bottom is +NAO.
-
The NAO is just not sustaining negative lately.
Winter 23-24:
Dec 2023 +1.94
Jan 2024 +0.21  Feb 2024 +1.09
Since Dec 2013, only 5 Winter months negative (41/46 positive)
Dec 2011  2.52
2012   1.17   0.42   1.27     Dec  0.17
2013   0.35  -0.45  -1.61     Dec  0.95
2014   0.29   1.34   0.80     Dec  1.86
2015   1.79   1.32   1.45     Dec  2.24
2016   0.12   1.58   0.73     Dec  0.48
2017   0.48   1.00   0.74     Dec  0.88
2018   1.44   1.58  -0.93     Dec  0.61
2019   0.59   0.29   1.23     Dec  1.20
2020   1.34   1.26   1.01     Dec -0.30
2021  -1.11   0.14   0.73     Dec  0.29
2022   1.08   1.68   0.77     Dec -0.15
2023   1.25   0.92  -1.11     Dec  1.94
2024   0.21   1.09
Never going below -1.11 for the Winter month since Dec 2013.
Since Dec 2013, 16 Winter months over +1.11! (16-0)
A lot of that has to do with the southern part of the NAO measurement, near the Azores, and spread out over the N. Central Atlantic Ocean.
-
1
-
-
You did very well, congrats.
That's 2 Winter's in a row I think. I remember thinking that you would be too warm last Winter, but it verified.
-
1
-
-
Not only that, but the warmth seems to be accelerating! Since the satellite era in 1948, the N. Pacific Ocean High pressure for Feb-March (-PNA) is going to be after this March, a whole +25% over any 500mb anomaly on record (for a 2-month period, spanning 7 years).
But perhaps a side point is, that is a pattern. It's not random, general warming happening, it's something causing -PNA's to be more frequent in Feb-March.
I would put money on next Feb-March also featuring this -PNA, SE ridge pattern.
-
 2
2
-
-
Here's your -AO look:
.png.6058b31aa027a32cb19557edd2942d59.png)
I thought a Strong El Nino/Strong -QBO combo would do that.. we had a few Stratosphere warmings. The Pacific Ocean pattern kept North America warmer..
-
I nailed it.. there was more -PNA in February than +PNA
.gif.1e28b6641b65e55eef9129f00ca0568c.gif)
The big Aleutian low that models were showing ended up in the Bering Strait, which isn't really the same thing.
Persistence won.
-
16 minutes ago, roardog said:
what causes these “marine heatwaves” we are seeing? A gradual warming of the air in earth should take years or decades even to warm the deep ocean waters. You have to warm the deeper waters from the turning over of the water. That would take a long time. The marine heatwaves have to be fairly shallow since they disappear as fast as they start sometimes.
I think the rotation of the Earth has slowed a little.. we are seeing more High pressure systems. land vs water friction also seems to be a little greater (cold coming more from Canada vs 50/50 low cold).
-
1
-
 2
2
-
-
The PDO talk drives me crazy. It's not some independent thing, It's feedback from previous patterns. Air is so much lighter than water, so it changes first.. then the water warms/cools. All that's being spotted with the PDO is pattern marks, some alternate mechanism, unless the Pacific rim is active or something..
-
It looks like we're going to be too far south for severe wx tomorrow.. an El Nino February
Chicago's under a tornado watch, and the radar looks impressive there
-
1
-
-
CPC is pretty big on the +EPO pattern sticking around
-
2 hours ago, FPizz said:
Did the trimonthly get to 2.0 for this to be super? I feel like I've seen both listed elsewhere.
It did. https://origin.cpc.ncep.noaa.gov/products/analysis_monitoring/ensostuff/ONI_v5.php
Since 1948, The 4 times we had a OND ONI +2.0 or greater, we had a La Nina the following OND. One of those was the strongest La Nina on record (1973).
-
1
-
.gif.21bd0f0c018d85603835453c01933f32.gif)
April Discobs 2024
in Mid Atlantic
Posted
Wow what a wind storm!