Hurricane Agnes
-
Posts
9,344 -
Joined
Content Type
Profiles
Blogs
Forums
American Weather
Media Demo
Store
Gallery
Everything posted by Hurricane Agnes
-
E PA/NJ/DE Spring 2022 OBS Thread
Hurricane Agnes replied to Hurricane Agnes's topic in Philadelphia Region
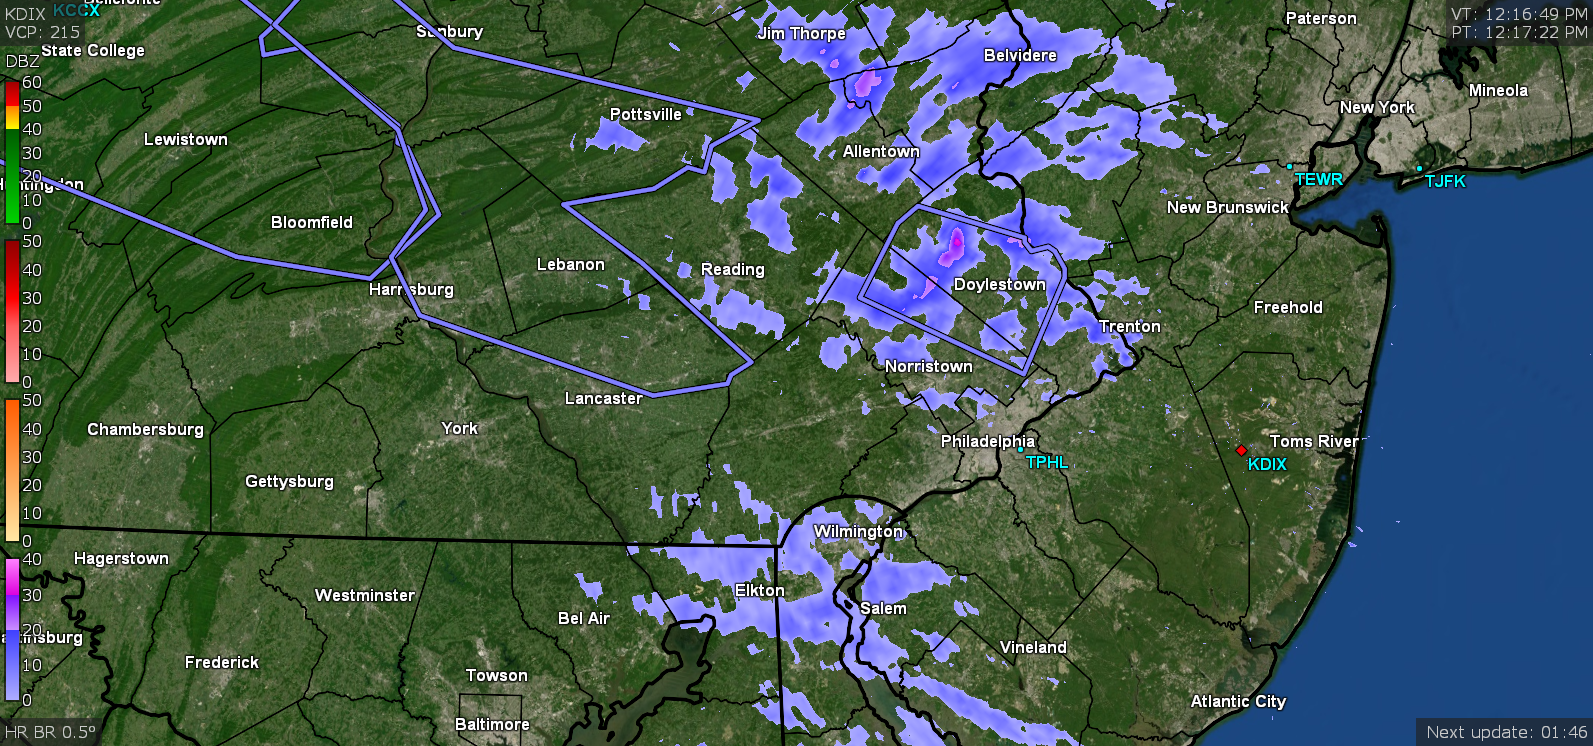
Had a pile of flizzards, squalls, and quick snow showers - but mostly later in the afternoon. Looks like the lake effect machine has been turned off now. Currently 26 with dp back down into the single digits here at 5 and falling fairly rapidly. -
Latest Sub-Freezing Day in History on Monday??
Hurricane Agnes replied to ChescoWx's topic in Philadelphia Region
RER tweet from Mt. Holly - -
Latest Sub-Freezing Day in History on Monday??
Hurricane Agnes replied to ChescoWx's topic in Philadelphia Region
And another flizzard blob overhead. Temp down to 25 with dp 18. Also had a bunch of RERs today for coldest max for the date (Philly may have just missed it or tied it last I checked) -
-
Latest Sub-Freezing Day in History on Monday??
Hurricane Agnes replied to ChescoWx's topic in Philadelphia Region
And getting some more although the sun is out too... Temp 27 dp 15.
-
Latest Sub-Freezing Day in History on Monday??
Hurricane Agnes replied to ChescoWx's topic in Philadelphia Region
And another flizzard has appeared. Temp 28 dp 15.
-
Latest Sub-Freezing Day in History on Monday??
Hurricane Agnes replied to ChescoWx's topic in Philadelphia Region
EAS issued over me...
-
Latest Sub-Freezing Day in History on Monday??
Hurricane Agnes replied to ChescoWx's topic in Philadelphia Region
Getting another flizzard. Temp 29 with dp 11.
-
Latest Sub-Freezing Day in History on Monday??
Hurricane Agnes replied to ChescoWx's topic in Philadelphia Region
New Snow Squall Warning issued south of me across the western 'burbs and through west/central Philly and into Jersey - Sun back out here and temp back up to 31 with d 11. -
Latest Sub-Freezing Day in History on Monday??
Hurricane Agnes replied to ChescoWx's topic in Philadelphia Region
Took all day but am finally getting a flizzard with blowing snow. Temp is 28 and dp 12.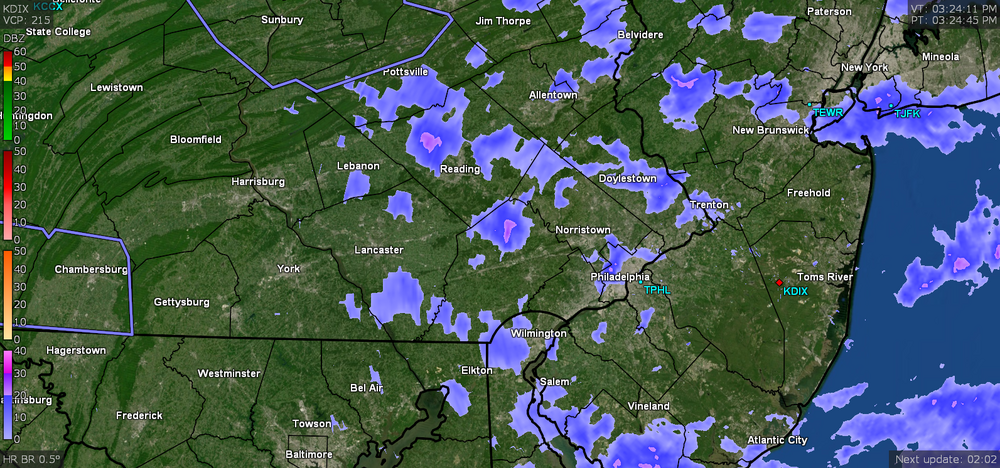
-
Latest Sub-Freezing Day in History on Monday??
Hurricane Agnes replied to ChescoWx's topic in Philadelphia Region
Another Snow Squall Warning Eastern Montco/Bucks and into Jersey - -
Latest Sub-Freezing Day in History on Monday??
Hurricane Agnes replied to ChescoWx's topic in Philadelphia Region
Have some returns over me down here but not seeing anything. Temp is 30 with dp 12.
-
Latest Sub-Freezing Day in History on Monday??
Hurricane Agnes replied to ChescoWx's topic in Philadelphia Region
Multiple Snow Squall Warnings issued for Berks, Central Montco & Bucks - (about to expire) - -
Latest Sub-Freezing Day in History on Monday??
Hurricane Agnes replied to ChescoWx's topic in Philadelphia Region
-
Latest Sub-Freezing Day in History on Monday??
Hurricane Agnes replied to ChescoWx's topic in Philadelphia Region
That was pretty serious cold here and I bottomed out at 22 at 6:45 am this morning. The winds never went calm overnight so that was pure cold air and not even radiational cooling. The dp dropped down to as low as 2. I know the blooms on star magnolia not far from me are or will probably be mush (although it had been blooming for about a week already). It's currently partly cloudy with lots of cumulus and the temp has recovered to 29 with dp now up to 10. -
Latest Sub-Freezing Day in History on Monday??
Hurricane Agnes replied to ChescoWx's topic in Philadelphia Region
Just posted by Mt. Holly - -
Latest Sub-Freezing Day in History on Monday??
Hurricane Agnes replied to ChescoWx's topic in Philadelphia Region
Polar Vortex weakening. It has been very strong much of the winter and stayed put, which is not that common for such an extended period in general... but then the stratospheric warming began - https://www.severe-weather.eu/global-weather/strong-polar-vortex-warming-collapse-event-forecast-spring-2022-usa-europe-fa/ leading to this - https://www.severe-weather.eu/global-weather/polar-vortex-2022-dramatic-arctic-cold-season-return-united-states-canada-mk/ -
Latest Sub-Freezing Day in History on Monday??
Hurricane Agnes replied to ChescoWx's topic in Philadelphia Region
Mt. Holly had a climatology section in their AFD this morning that included the Monday March 28 record low max temps for the area - -
E PA/NJ/DE Spring 2022 OBS Thread
Hurricane Agnes replied to Hurricane Agnes's topic in Philadelphia Region
Nothing here although I am under a radar hole with the sun peeping out from the cloud deck. Temp has been wavering today where I hit a high of 43 just before 11 am (after a low of 36 earlier this morning) but am down to 40 with dp 29. My sis in Upper Darby texted about seeing some flurries down her way.
-
E PA/NJ/DE Spring 2022 OBS Thread
Hurricane Agnes replied to Hurricane Agnes's topic in Philadelphia Region
Some thoughts from Mt. Holly this morning about the unsettled weather - Talk about a mixed bag! I know KYW reported a brief snow shower downtown earlier. I haven't seen anything here other than the light rain I had earlier this morning. Currently changeable skies and 49 with dp 33. -
E PA/NJ/DE Spring 2022 OBS Thread
Hurricane Agnes replied to Hurricane Agnes's topic in Philadelphia Region
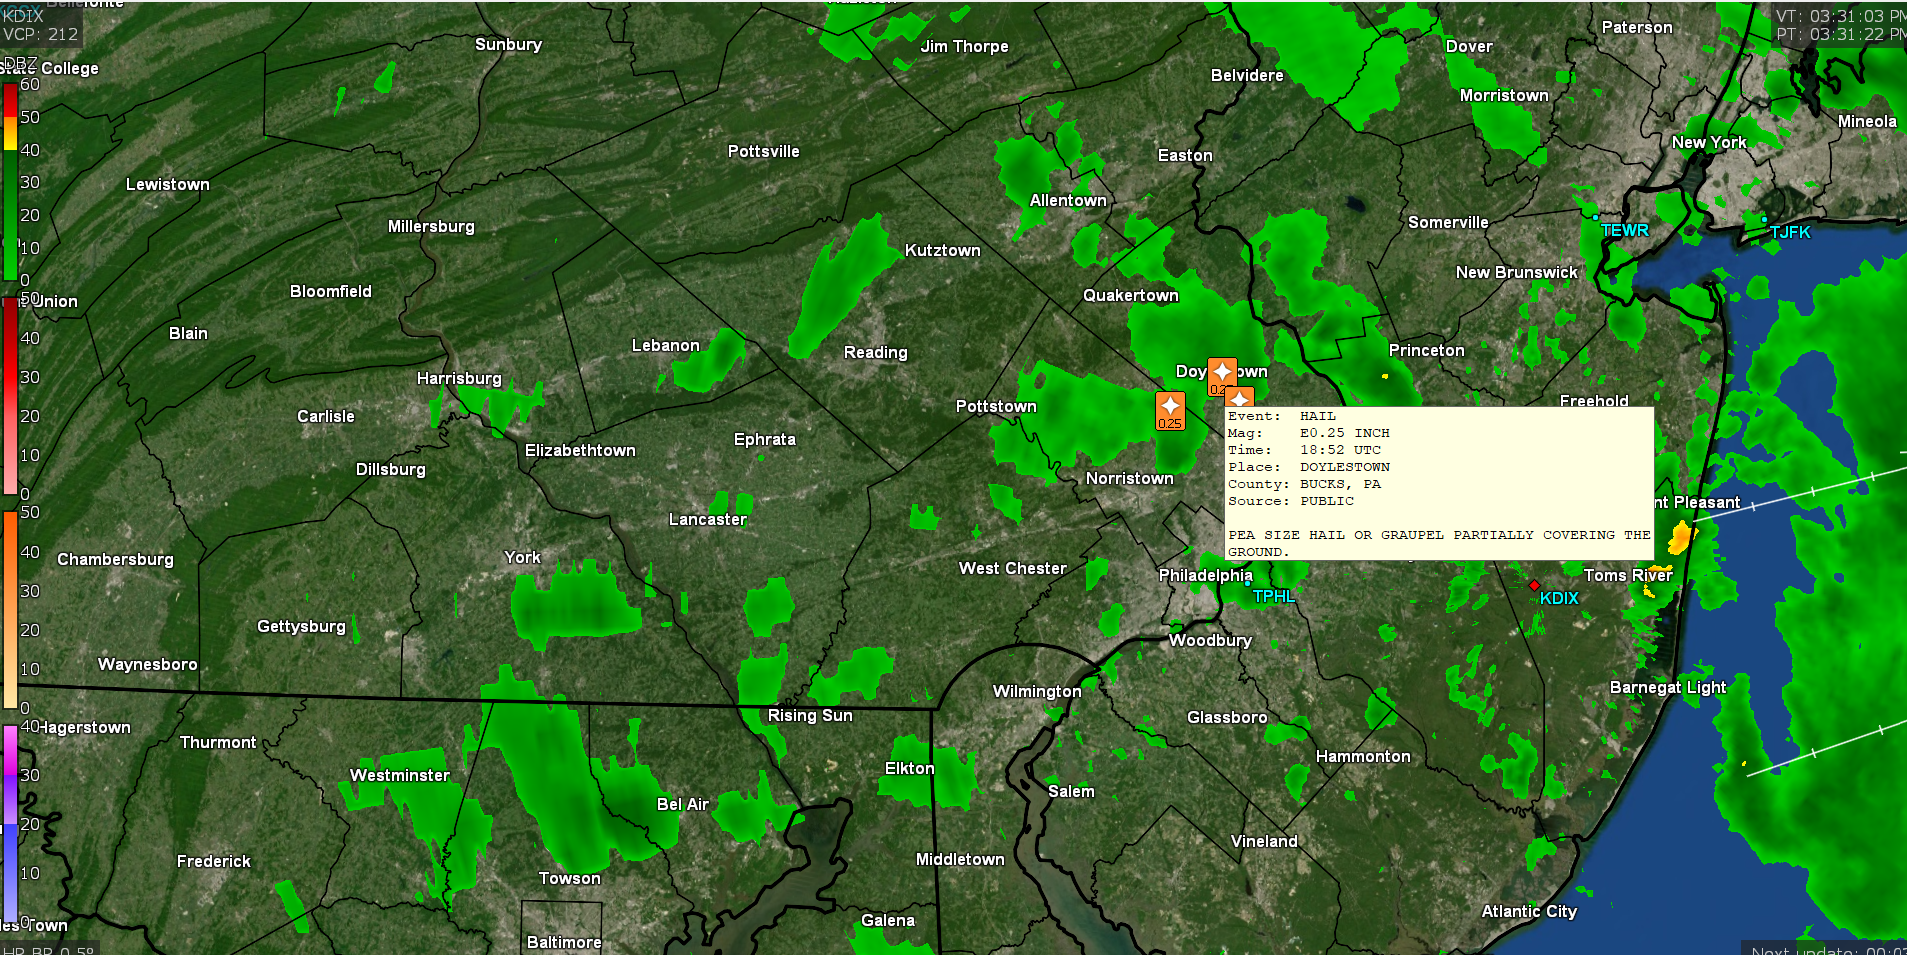
Here were some of the reports earlier in both Bucks and Montco of the graupel (including indicating it was enough to accumulate to at least a coating).
-
E PA/NJ/DE Spring 2022 OBS Thread
Hurricane Agnes replied to Hurricane Agnes's topic in Philadelphia Region
NBC10's Krystal Klei (on KYW) was noting that N/W of Philly there were reports of graupel so that may be what it was, particularly due to the warmer surface temps. Other than a passing light shower before noon that deposited 0.01", It's been mostly unsettled here today with the sun in and out and a high (so far) of 54, after a low of 45. Currently mostly cloudy, with the sun coming in and out, and 50 with dp down to 30 with I'm guessing what is some CAA drying things up. ETA - traffic guy (Andy Anderson) on KYW in shock reporting what he said appears to be snow in the traffic cams (and the anchor Ellen Kolodziej confirmed looking out her window downtown at 24th & Market - she just said it was like "snow in Southtown" from the Christmas cartoon). -
E PA/NJ/DE Spring 2022 OBS Thread
Hurricane Agnes replied to Hurricane Agnes's topic in Philadelphia Region
Stratus has lifted, sun is out with some scattered clouds (more clouds towards the N/E) with temp and dp 48. -
E PA/NJ/DE Spring 2022 OBS Thread
Hurricane Agnes replied to Hurricane Agnes's topic in Philadelphia Region
Some kind of convection came through here overnight between 9 - 10 pm, triggering the lightning detector. Ended up with an additional 0.13" of rain during that round for a total of 0.62" for the day, and along with another 0.02" early this morning, yields a 3-day total of 0.81". Currently misty and 43 with dp 43. -
E PA/NJ/DE Spring 2022 OBS Thread
Hurricane Agnes replied to Hurricane Agnes's topic in Philadelphia Region
Ended up Wednesday with a high of 51 after a low of 40, and 0.17" in the bucket. Today I had a low of 41 and only managed to get to 46, which is my current temp at post time, and it's overcast/misty, with another 0.49" in the bucket (2-day event total so far = 0.66"). -
E PA/NJ/DE Spring 2022 OBS Thread
Hurricane Agnes replied to Hurricane Agnes's topic in Philadelphia Region
Ended up with a high of 62 and low of 49 yesterday, followed by a cooler high of 59 today after a low of 43 this morning. Currently 50 with dp a dry 23, but know some precip is due the next couple days. Will see if the progged amounts verify (although this is over 2 days) -