

csnavywx
-
Posts
5,702 -
Joined
-
Last visited
Content Type
Profiles
Blogs
Forums
American Weather
Media Demo
Store
Gallery
Posts posted by csnavywx
-
-
On 4/17/2023 at 10:48 PM, GaWx said:
More on this huge Ft Lauderdale rain:
- Records go back to 1913.
- 25.91", which fell mainly within just a 12 hour period, far exceeds the greatest there on record in one calendar day. The old record was 14.59" on 4/25/1979 from a weak low in the NE GOM.
Here are prior 10"+ 2 calendar day rains:
- 16.74" 10/19-20/1924 from hurricane moving NE from NW Caribb.
- 15.79" 4/24-5/1979 from weak NE GOM low
- 13.72" 6/2-3/1930 with no tropical system anywhere nearby
- 13.10" 10/11-12/1947 from hurricane moving NE from NW Caribb.
- 12.25" 10/31-11/1/1969 near stationary front
- 11.00" 10/4-5/1948 from hurricane moving NE from NW Caribb.
- 10.89" 5/27-28/2003 (nothing tropical).
- 10.75" 3/14-15/1919 (nothing tropical).
- 10.68" 11/19-20/1973 (nothing tropical).
- 10.14" 6/7-8/1999 (nothing tropical).
The THREE day record is "only" 18.24" set 10/19-21/1924 per this:https://www.newsweek.com/fort-lauderdale-third-annual-rainfall-only-7-hours-1794169?amp=1
Interestingly, no 10"+ event has occurred from a tropical cyclone since way back in 1948! If someone had told me before I did this research that it had been 75 years since the last from a TC, I would have wondered if that was accurate.
Is there any clearcut evidence that GW was a major factor? No clearcut evidence imho. Why?
- It occurred with dewpoints in the low 70s and offshore SSTs no higher than the low 80s. Yes, those are above average for mid April. However, SSTs get into the mid to upper 80s and dewpoints into the upper 70s every summer and yet nothing even close to this heavy an event has occurred most years in S FL summers.
- Look at the decades for the listed 11 heaviest Ft Lauderdale events since 1913:
1910s, 1920s, 1930s, 1940s (2), 1960s, 1970s (2), 1990s, 2000s, 2020s
This looks like a pretty even distribution. If these records had been heavily influenced by the 3 or so degree F warmer globe, I would have expected a heavier concentration since the 1980s (and especially in summer/early fall). Yet, there have been only 3 of 11 since then.
Good stats listed here, but I would debate this portion and some of the interpretation. I'll agree it's complex and difficult to tease out. However -- you're generally not going to get environments favorable for supercells in S FL in summer and fall, esp for the kind we saw with long duration. This strikes me as a combination of mid-spring setup overlapping with higher SSTs than should have been available. 1-2C warmer than normal temps/dews temps into a skinny CAPE-high shear profile will absolutely make a difference in both updraft maintenance and precip output, esp if warm cloud layer is deep enough. A few degrees cooler at the surface and in the inflow layer and I'm not even sure you get an event anywhere near this magnitude -- probably several inches less. But in a marginal situation like this? The persistent maintenance of a mesocyclone alone could've contributed up to 50% of the updraft speed.
Obvs. it falling over a metro area and the expanding bullseye effect have some blame here too.
-
 2
2
-
-
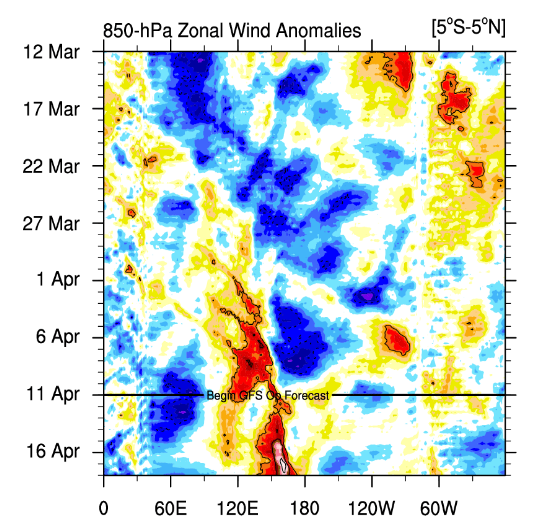
Trades return next week in CP/WPac. Will have to see how big the downwelling EKW was from the recent WWB activity. Meanwhile, in the EPac, EC/EPS have yet another WWB lined up from 110W to the SA coast. Thermocline suppression will remain and with the leading edge of the first downwelling Kelvin wave approaching, we should see some expansion of the warm anomalies to the west.
Would like to see the next WWB in the WPac be closer to the Dateline. Will probably have to wait a few weeks for that. In the meantime, full steam ahead.
-
 1
1
-
-
Saturday looking halfway decent for southern areas. Tendency towards less AM precip and a bit of clearing ahead of the front. Timing is good. Probably around 500-1000 MLCAPE and great directional shear, DPVA and jet support ahead of a neg. tilt trough. Worth an extension of SLGT northwards.
-
3
-
-
Weak 0.5
Mod 1.0
Strong 1.5
Super 2.0
-
3
-
1
-
-
No reason to think we get subsurface cooling over the next 3-4 weeks with a powerful EWR and resultant WPac WWB.
Also, atmospheric response lags behind SST changes, so still being in "Nina mode" is expected.
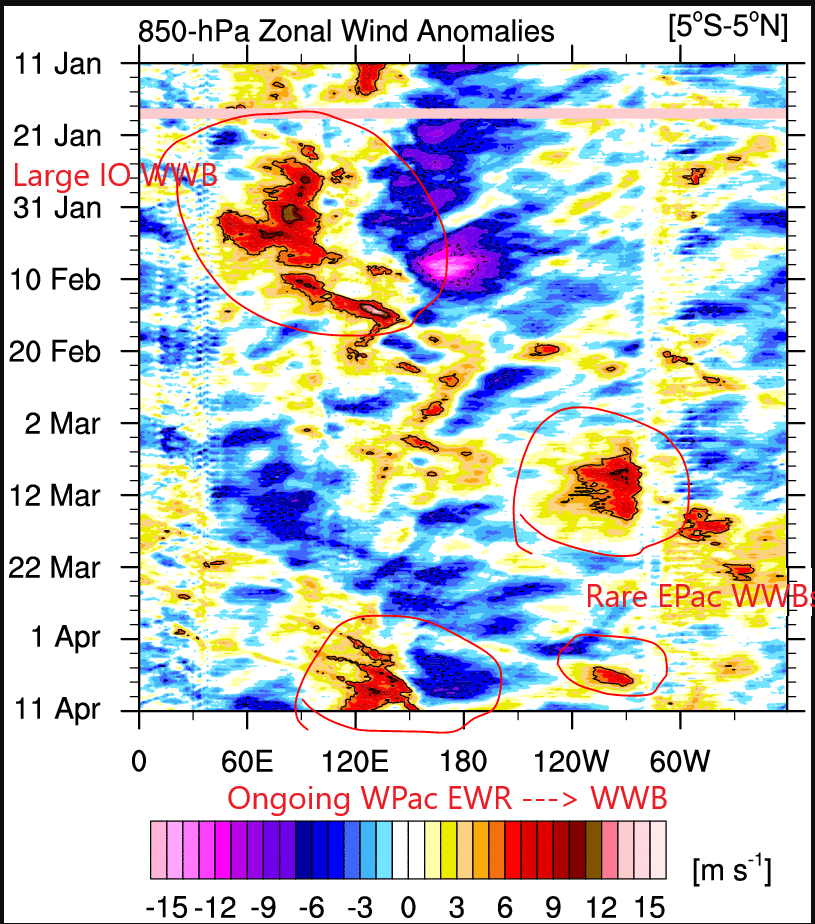
This Nino isn't building like recent events and the event so far has started almost entirely from more distant forcing. In fact, the trigger for the end of the Nina can be traced back to a large Indian Ocean WWB in January and the resulting "sloshing" of the warm pool into the WPac. Careful on leaning too hard on analogs. They should only ever form a part of your toolkit. Ma Nature throwing out some strong hints that this evolution will be different from most modern ones.

-
4
-
-
Just now, bluewave said:
Wonder if Nino 1.2 peaks early in the next few months like 57-58 did? These Nino 1+2 maxes typically occur later on in the event.
It was overwhelmingly driven by the exceptionally rare, large EPac WWB in March (and a smaller one just occurred a few days ago). That caused a large drop in the thermocline. Unlikely to repeat that, even if we are getting an east-building event with weak trades there. So it could very well have a local peak early. Or a double peak (later if WPac plays ball). Of larger consequence now is the EWR event evident in guidance over the next week that should send the WPac warm pool moving as it induces a significant WWB there. The relative lack of WWB activity there up to this point has been an issue. Will need to see how the subsurface responds to it and if there are any follow up events.
-
7
-
-
Sweet. Gimme a severe outbreak with my eclipse pls. A supercell with an eclipse in the background would be the shot-of-10-lifetimes.
-
3
-
-
10 hours ago, chubbs said:
This is not a technically sound analysis. SO2 has a few days to two week lifetime, so the impact of the marine sulfur regulation would have been felt quickly in January 2000. The timing is off for the recent spike in SST to be closely associated with ship SOx emissions.
Eeehhhh. Don't be so quick to dismiss this, imo. There was an immediate upswing in EEI and SST in 2020 over both the NPac and NATL. The EEI signal is still very much there.
Some of this warming is probably due to Nina influence on the mid-latitudes, but once you account for that there's still a (large) residual there that I don't think can be easily accounted for. Plus, why Jan and not Sept when the impact of aerosols and time lagged (inertia induced) solar heating is maximized?
-
On 4/5/2023 at 11:28 AM, GaWx said:
So, the April 1st Euro ensemble mean 3.4 plume for ASO is ~+1.7. How does this compare to some past actual El Niño ASOs?
2015: +2.2
1997: +2.1
1965: +1.9
1972, 1982: +1.6
1957: +1.3
1963: +1.2
For these 7, the average increase from ASO to peak was 0.4 with a range of 0.1 to 0.6. So, that would imply based on the April 1st Euro ASO forecast of +1.7 a later peak between +1.8 and +2.3 (mean of +2.1).
https://origin.cpc.ncep.noaa.gov/products/analysis_monitoring/ensostuff/ONI_v5.php
Keep in mind though that none of this takes into account whatever forecast bias the Euro may or may not have (see below). And of course even if the bias is negligible, there is mean forecast error to keep in mind when looking ahead that far (as much as 6 months).
How does the April 1st Euro plume mean of +1.7 for ASO compare to some past April 1st Euro progs for ASO?
- 2017: +1.1 (the year of worst forecast) vs -0.4 actual
- 2015: +2.0 vs +2.2 actual
- 2014: +1.5 vs +0.2 actual
- 2012: +1.0 vs +0.4 actual
- 2009: +0.8 based on May 1st forecast vs +0.7 actual
So, for these 5 years, the April 1st forecast mean for ASO ended up too warm 4 times and too cool once. On average for these five years, the April forecast for ASO was 0.6 too warm. Even if I were to throw out the 2017 forecast debacle, the April forecast for ASO for the remaining four years was still 0.45 too warm. So, perhaps the April 1st forecast for ASO has a too warm bias. If so, the odds would favor the actual ASO end up lower than +1.7.
But regardless, the +1.7 ASO prediction being the 2nd warmest for the Euro in April is a significant indicator that a pretty robust El Niño is probably on the way. Even if I were to reduce the +1.7 ASO forecast to +1.2 or +1.3 to account for Euro warm bias, that would still imply that the later peak would most likely end up in the strong (+1.5 to +1.9) category though most likely not super-strong and with high end moderate also in the mix. Then again, the trend from last month's Euro forecast is significantly warmer.
So, we'll see! Lots of uncertainty but the chance for a robust El Niño has increased significantly from last month based on the Euro.There was a *very rare* strong EPac WWB in the first half of March that did a lot of work on the thermocline and boosted the odds of a strong event. There's a smaller one ongoing right now. Not all Nino events build the same way and the sort of evolution we're seeing now strongly suggests we're tilting towards an east-based event. If we continue to get some cooperation from the WPac and get an extension towards the dateline while all of this work is being done on the thermocline in the east -- better start shifting those targets higher.
This equatorial rossby wave event might help do the job:
-
3
-
1
-
-
The backside of those storms have been some of the best lightning displays I've seen around here. TONS of sky spanning anvil crawlers. Have only seen a few better than this -- all of them in the Midwest on big supercell and MCS nights.
-
3
-
-
Helluva day down here in southern St. Mary's:
1.28" (so far -- much needed)
61 mph wind gusts
1" hail
Got to witness a microburst hit the ground 3-4 miles southwest of my observation post. Classic white rain/hailshaft complete with curl and roll/rotor cloud. We caught the perhipery of that. I imagine my house got it much worse. Will find out here in a few hours when I go home.
-
7
-
-
These arguments about geothermal heat and volcanic CO2 aren't just wrong, they're wrong by orders of magnitude. 2 orders of magnitude on volcanic CO2 and 4 or 5 on geothermal heat. Not even in the same solar system. This is the sort of thing that a basic back-of-the-napkin order of magnitude estimate from a basic statistics or physics class could rule out in about 10 minutes. Really! First week of class, first year stuff.
-
6
-
-
Yep. Running at just 1.02" for March and got 0.90" for Feb. Jan was 60% of normal and Dec was half of normal. I think we're at 4.5" for the last 4 months. Climo-wise, it's the driest time of year anyways, but even with that fact, still unusual to see. Temps also 5-9F above normal. Doesn't necessarily bode that well for summer. At least an oncoming Nino should end it in fall/winter if summer ends up being bad.
-
12 hours ago, Typhoon Tip said:
To me it is interesting that in thesis it is written, "...This temperature increase is consistent with the calculated effect due to measured increases of atmospheric carbon dioxide..."
You know, this goes back to the Keeling curve (1958+) analysis - later, superimposing the temperature rise over the C02 increases demonstrates a pretty dead match.
It's like these Hansen et al findings are really just adding to a consilience. The science of climate change keeps formulating new approaches that just add to a correlative pool.
Of course, 1981 is a long while ago.. Any skepticism about the C02 correlation by this point in history is either contrived by faux science or all but immoral. But it is interesting that the history/evolution of the present day understanding really should be more institutional at this point -
Personal furthering notion... the problem in that latter sense (I suspect) is human limitation related, a limitation that is there by way of all evolution of life at a biological level; constructing truth has to happen by means "corporeal-based reality." Meaning, what is directly observable via the 5 senses.
You tell a person to beware of something, they'll bear it in mind. If they hear, see, smell, taste or touch, sample that something directly, only then will they actually react. This specter of CC, prior to ...perhaps 10 or 15 years ago, had now corporeal advocate. Simply put, it was invisible. Combining that notion with the shear grandeur of the whole scale of the planet just not being mentally tenable to most ( let's get real), acceptance --> recourse was going to be racing against time with a broken leg.
It really is only beginning to manifest in such a way that can be seen or heard or felt...etc, and even these cataclysms are being ..almost shelved because they are media drama someplace else? They are offset by technology protecting civility. Eventually, though, the industrial bubble does have a fragility. And, until CC somehow either directly or through indirection of a multitude of factors finally pops that protection, humanity will unfortunately continue enabled from what it is they (apparently) must have in order to at last react and learn -
pain.
All the while, the wrong momentum gathers....
Speaking of momentum:
https://journals.plos.org/plosone/article?id=10.1371/journal.pone.0237672
Probably one of the most interesting papers I've read in some time.
Presents the issue as one of a giant momentum trap that's not easy to maneuver out of. Adding RE (renewable energy) simply grows the entire system of civilizational networks, growing the entire pie (including the fossil part) as you would a snowflake if you added water vapor to the environment around the branches (the facet competes with them but nevertheless still benefits from an expansion of the branches). Efficiency gains do nothing to decarbonize on a global scale because they are used for growth. Direct replacement possible but not easy because of offsetting network effects. Slowing its growth via constriction of energy consumption (like '09 GFC or '20 Covid) possible temporarily but causes big disruption and RE replacement efforts are often sidelined in favor of quick recovery. This growing "superorganism" does not like to be starved and will hurt everybody until it is properly fed again, so to speak.
As for global temperature, that kind of inertia argues for a continued expansion of EEI (earth energy imbalance) as we warm -- and that's exactly what we've seen. EEI continues to rip higher even after the last big ENSO cycle.
-
1
-
2
-
-
you wanna see a scary good prediction -- try hansen '81 scen B compared to actual surface Ts
-
1
-
1
-
-
On 2/17/2023 at 10:19 AM, Wxdood said:
The arctic can go ice free all year? Based on what evidence?
but but… Al gore said it would be ice free in 2008. Why isn’t it ice free now?
how gut hooked do you have to be to believe the arctic can be open water all year?
How do you believe all of those peat and fossil fuel deposits got there in the first place -- or fossilized tropical and sub-tropical forests?
-
1
-
-
Feb. 17th and still snowless here in SoMD. Realistic window for snow only open for about 3 more weeks here.
-
27 minutes ago, ChescoWx said:
CSNavy waiting as usual for any actual non NOAA adjusted long term weather data verification ...more than since 1970 to support with any scientific rigor any such warming claims.
Dodging it still. Not gonna work. State your entire climate position clearly and the conditions under which your position will be falsified.
-
On 2/7/2023 at 3:13 AM, csnavywx said:
What would you have to see to change your mind?
Because I know what I would have to see for my position to be falsified. You need to state that here or expect to be challenged until you do.
Crickets...
Like usual.
-
1
-
 1
1
-
-
On 2/3/2023 at 8:07 PM, ChescoWx said:
Thanks Cape - Agreed!! LOL!! Facts always get in the way of models and feelings!!!
What would you have to see to change your mind?
Because I know what I would have to see for my position to be falsified. You need to state that here or expect to be challenged until you do.
-
2
-
-
What happened to all of the Antarctic sea ice pumpers from a few years ago? Two year spike and all we heard was how this disproves global warming. Crickets now.....
-
6
-
-
Doesn't matter what ya throw at him. It won't work. The only thing that matters is this when engaging in this sort of discussion:
What would it take to invalidate your position?
If he can't state it clearly at this point -- block and move on.
Tired of the years of coddling this shit on this board. It's tiring.
-
7
-
-
On 12/12/2022 at 12:18 PM, LibertyBell said:
Some news
This is big news today-- how many decades are we now from controllable nuclear fusion and could this eventually be used not just for energy right here at home but also for space propulsion fuel?
Q-plasma only. Nowhere near break-even on Q-total. Entire fusion research community needs to come to grips with this and tell it like it is or we're gonna get another 30 years of articles like this.
-
2
-
-
51 minutes ago, Brian5671 said:
GFS with absured rainfall totals...the freshwater flooding will be a big story in itself if this comes even close to verifying

10000% this. Wind will be bad enough but this kind of rainfall is devastating. Overnight/diurnal enhancement of training feeder bands and downshear enhancement north/northwest of a slow moving eyewall could produce some hellacious rainfall amounts.
-
7
-
26 inch Fort Lauderdale rainfall
in Weather Forecasting and Discussion
Posted
Probably coincidence. The amount of heat generated by condensation from ocean fluxes dwarfs anything we can generally produce *directly* (and flights would've been shut down, anyways). Exception is generally from retained solar heat in buildings/concrete, etc -- but wasn't much solar heating going on before that.