CustomWX
-
Posts
25 -
Joined
-
Last visited
Content Type
Profiles
Blogs
Forums
American Weather
Media Demo
Store
Gallery
Everything posted by CustomWX
-

Link to Plot Relative AAM Charts
CustomWX replied to LakeEffectOH's topic in Weather Forecasting and Discussion
If I recall it’s not available to the public and only folks like HM have a legacy account. However, Victor Gensini has similar maps on his page. https://atlas.niu.edu/gwo/ -
I figured you all would like to see a more clear-cut difference between the more east and west based El Nino events. Below is a statistical correlation graphic that determines relationships between two variables. In this case, geopotential height and ENSO regions (1+2, 3, 3.4, 4). The red indicates there is a direct relationship between ENSO (as El Nino strengthens, so does geopotential height). The purple/blue is an inverse relationship (as El Nino strengthens, geopotential height falls). There is a clear west trend in the heights as the ENSO regions move west. The highest heights to go from the Hudson Bay to the Pacific Northwest, the 50/50 low is strengthened closer to the coast as El Nino is centered further west. Same trend with surface temperatures. Note that I changed it to regression here, which is a linear fit. I just think its interesting to actually see why "modoki" El Ninos are more favorable. Link to the site: https://psl.noaa.gov/data/correlation/
-
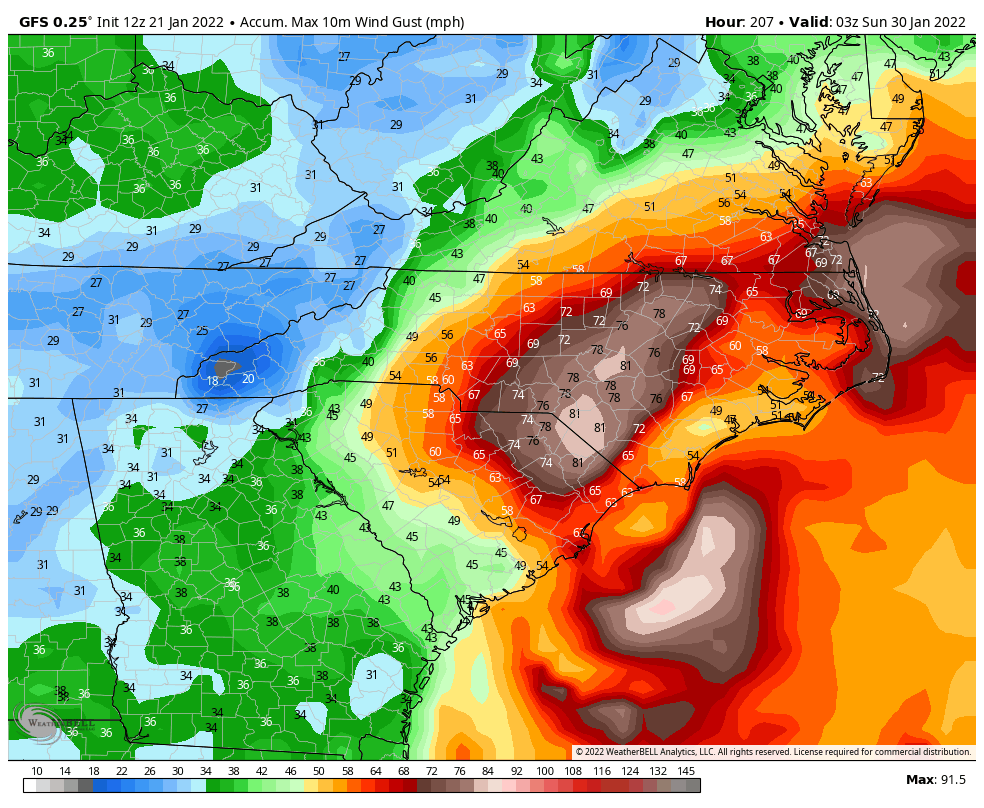
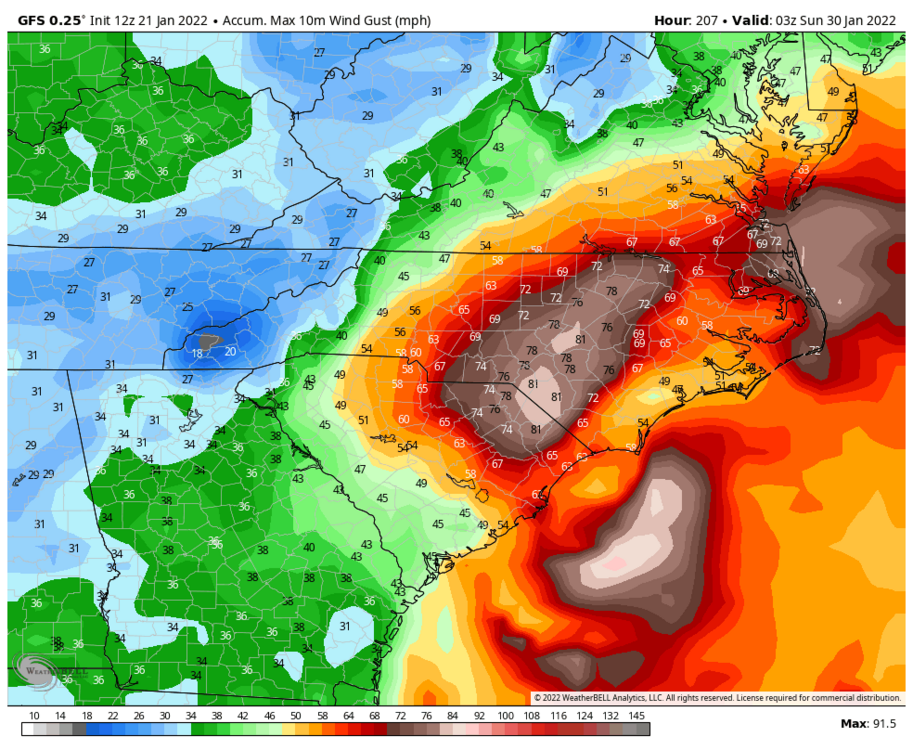
Hurricane Force Wind Gusts. Would be the new storm of the century haha.
-
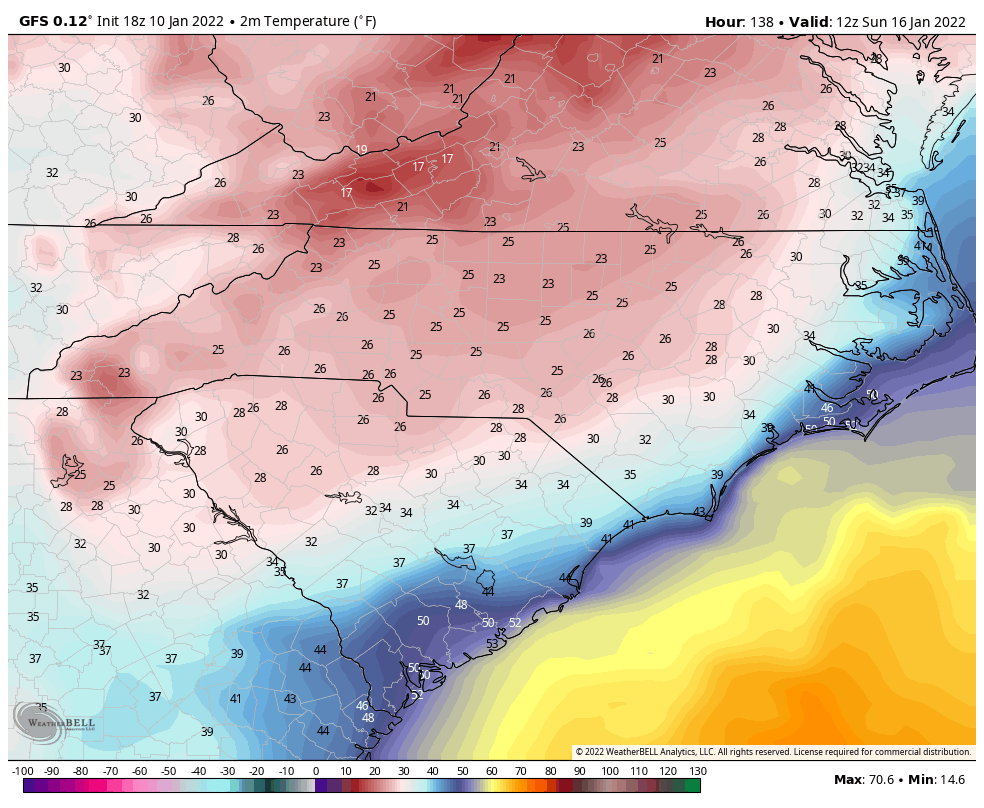
Surface temperatures are in the mid-20's. Definitely not a storm that we would need to deal with a lack of cold air if the more southerly tracks verify. s

-
Here's a gif showing the timeline:

-
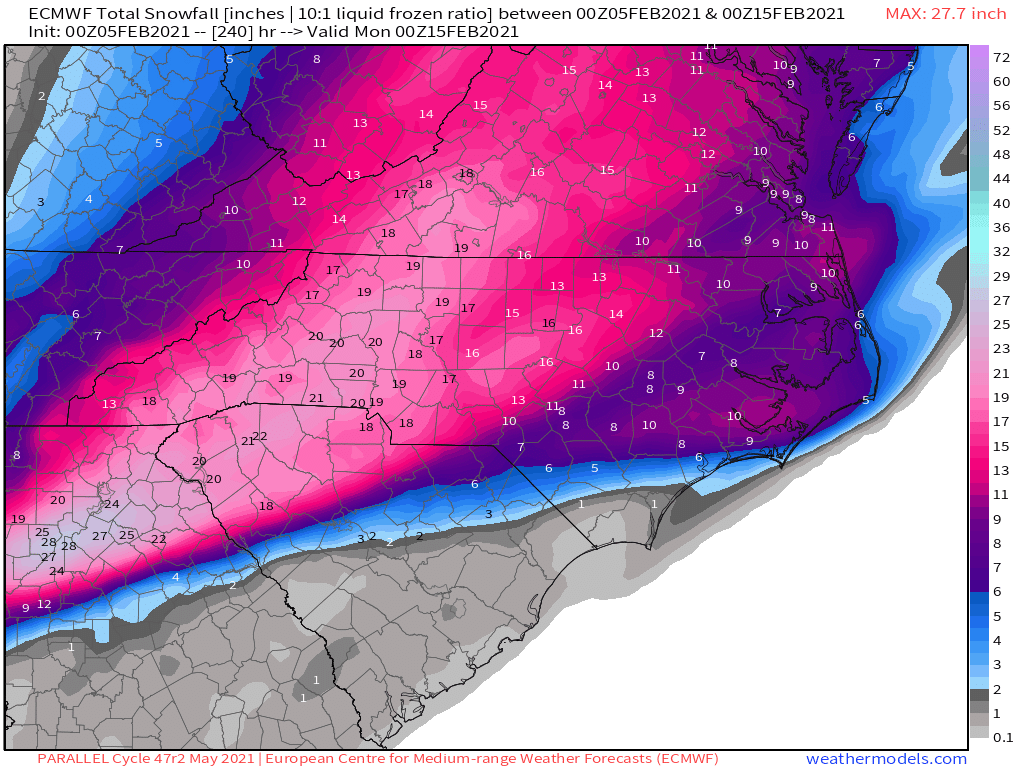
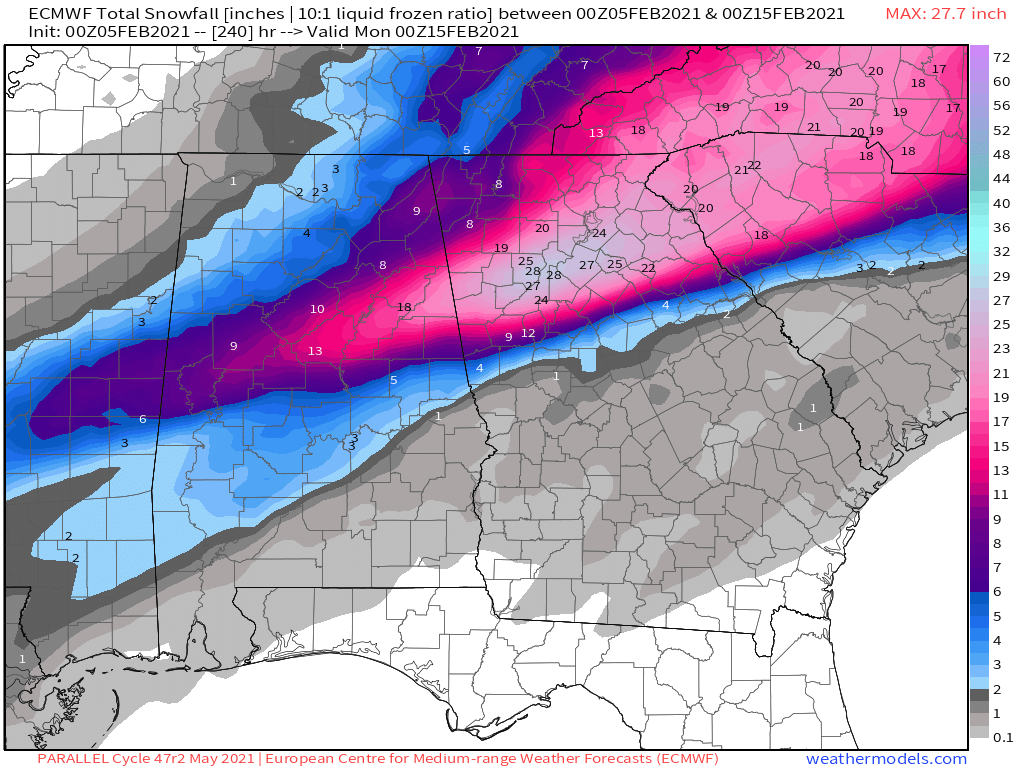
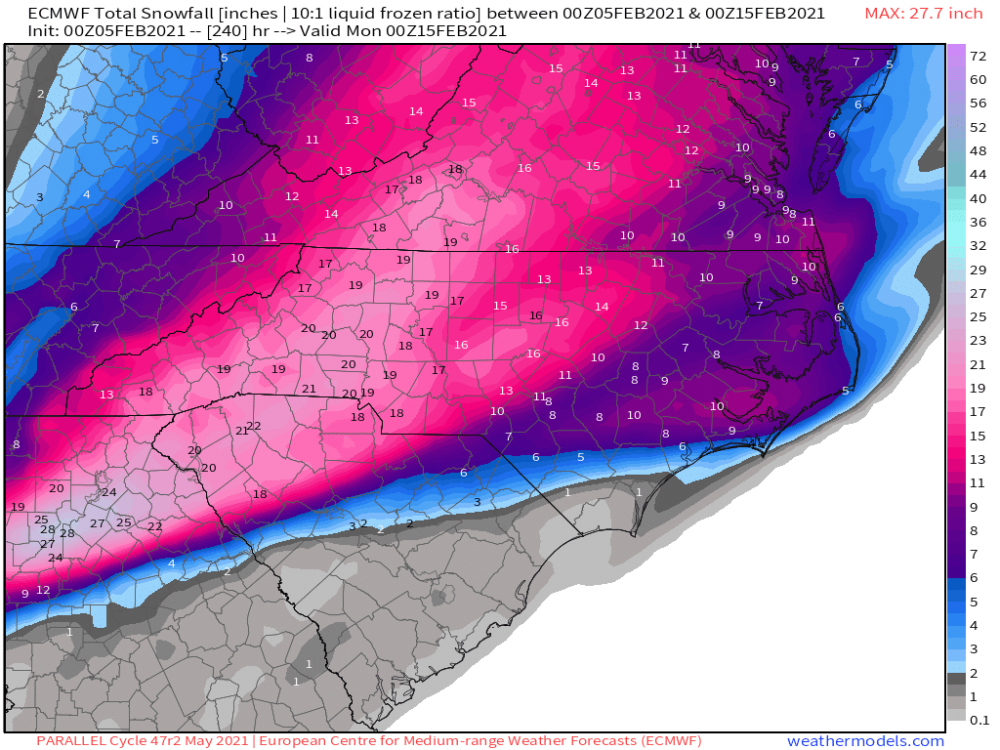
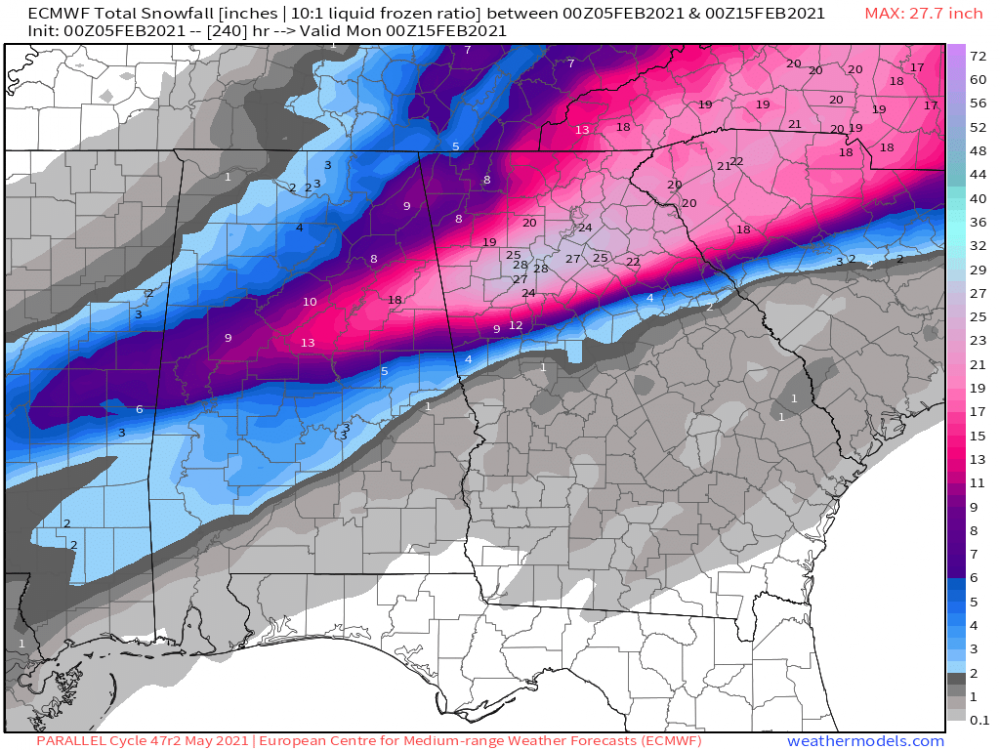
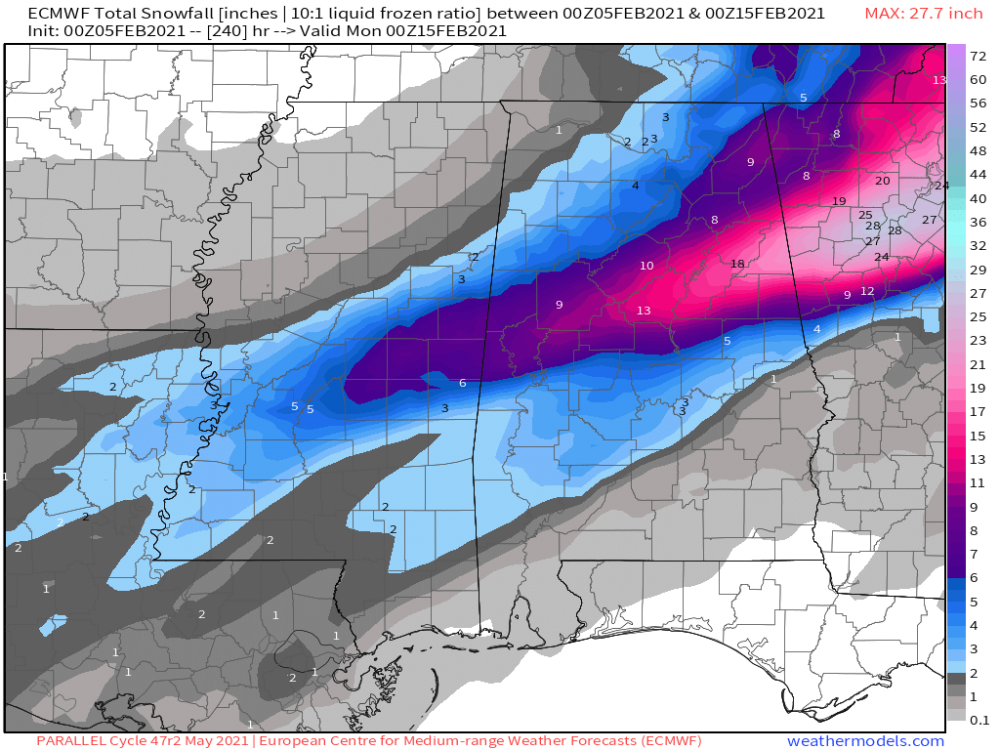
FWIW, the Euro Parallel continues with its bullish runs.
-
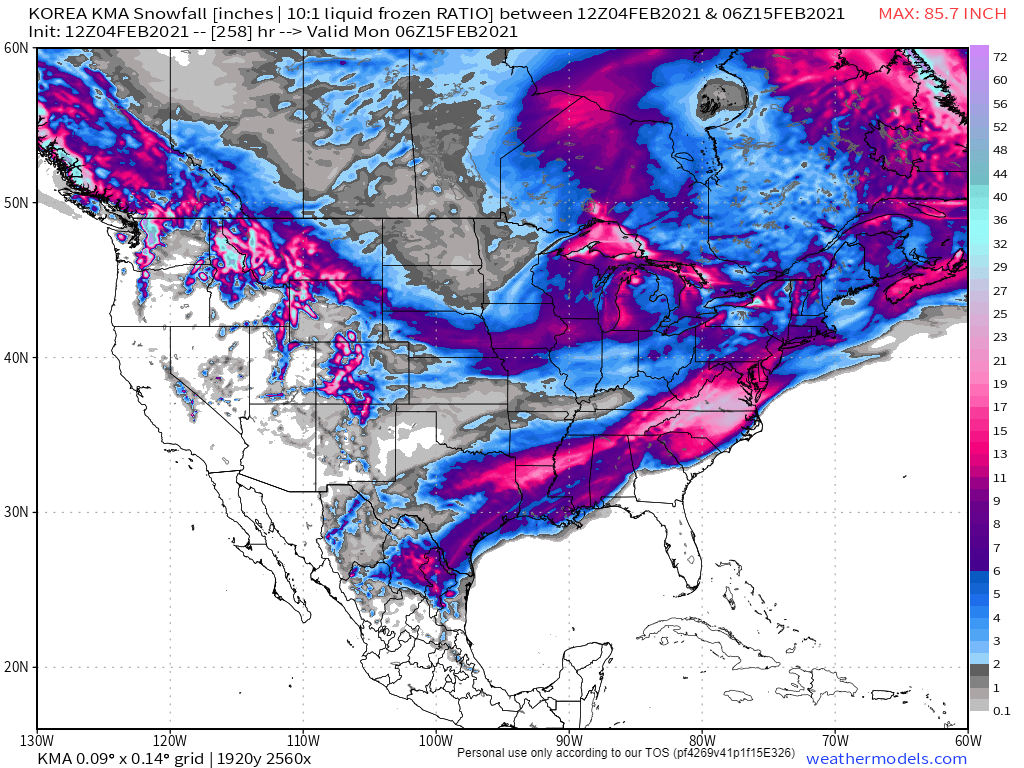
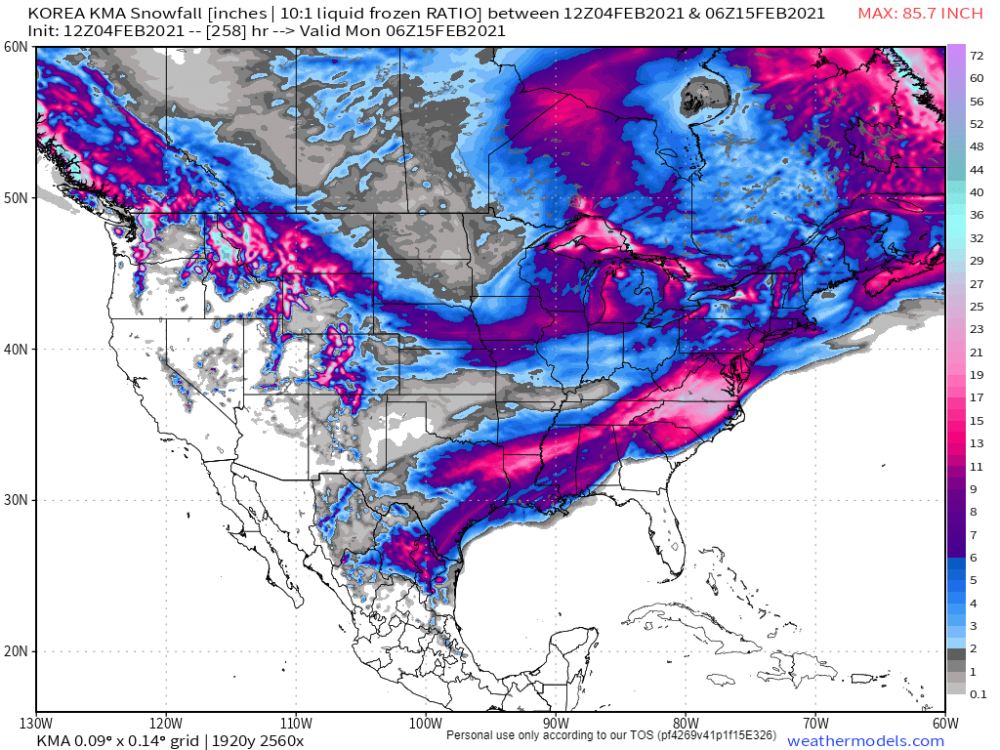
Nah, The KMA model is where it's at!
-
The 12z Euro Parallel looks awesome!


-
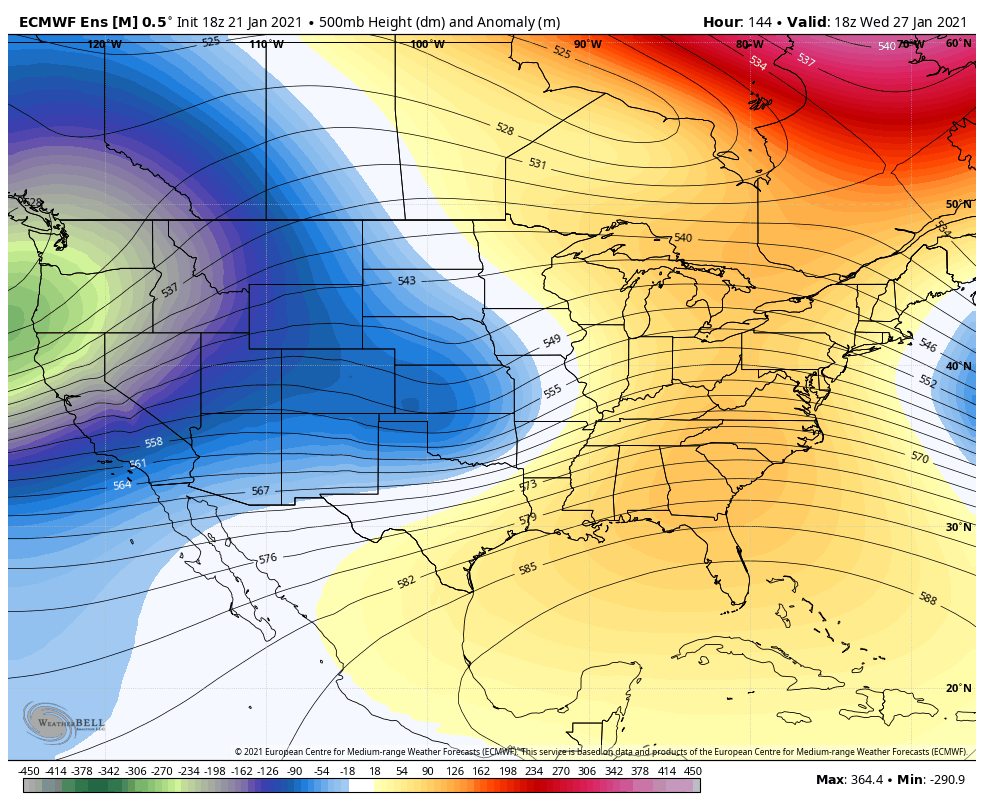
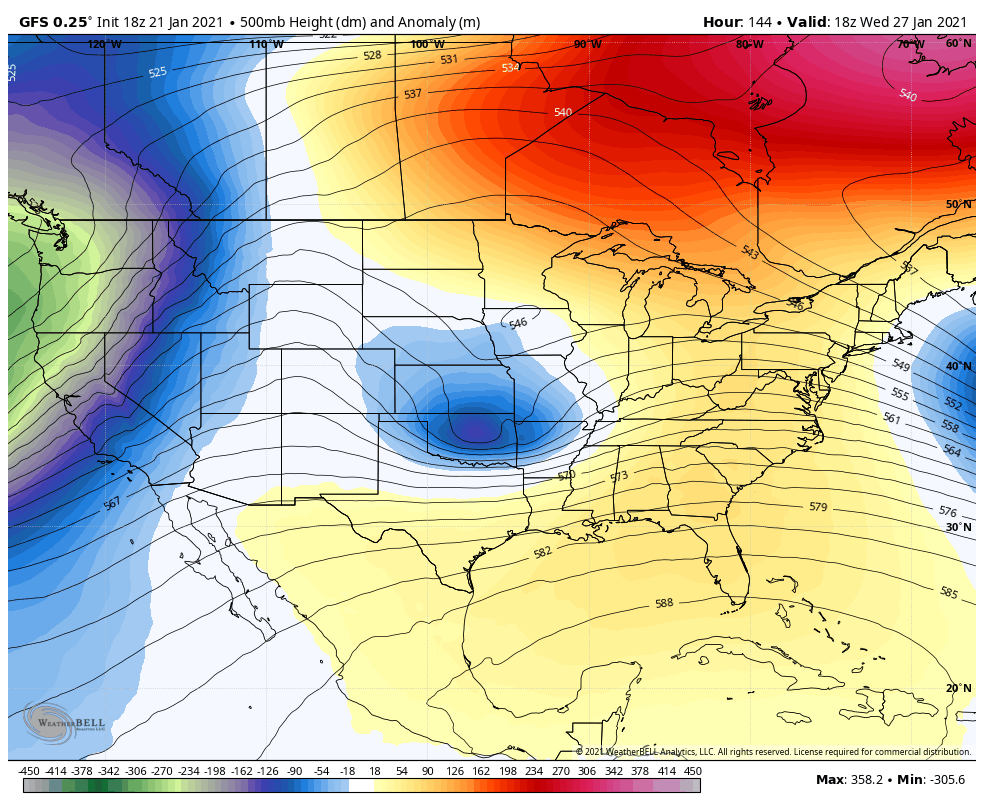
I'm not liking the 18z EPS. That piece of the TPV might end up screwing us over. GFS

-
This is legitimately kind of funny.
-
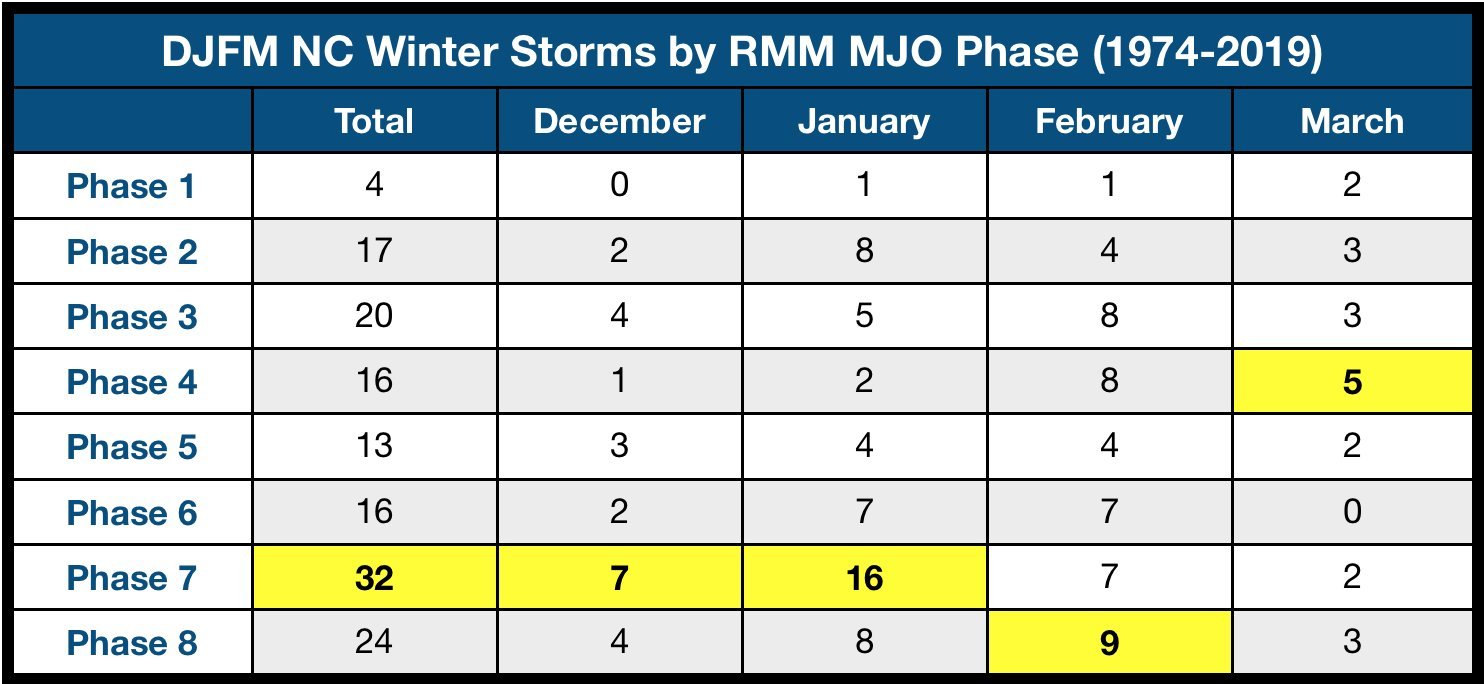
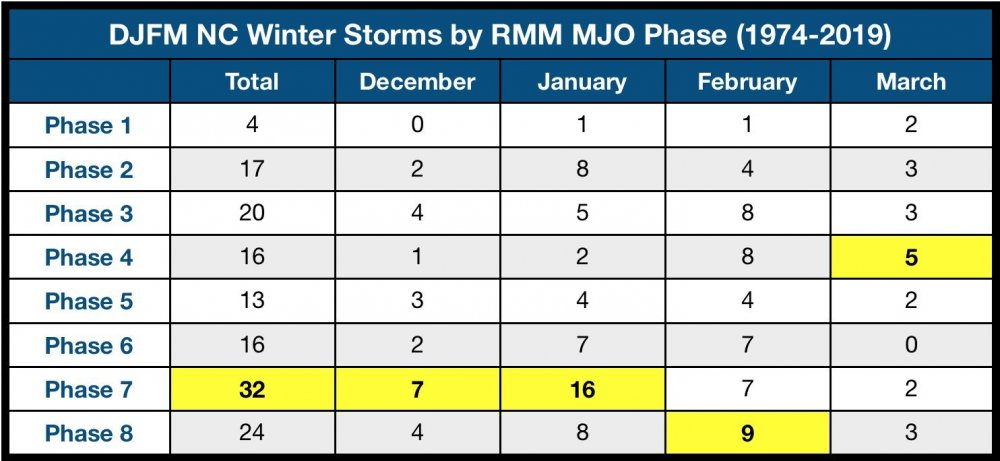
Accord to Eric Webb’s MJO research, we do not want to MJO to go to phase one. It’s our least snowiest phase!
-
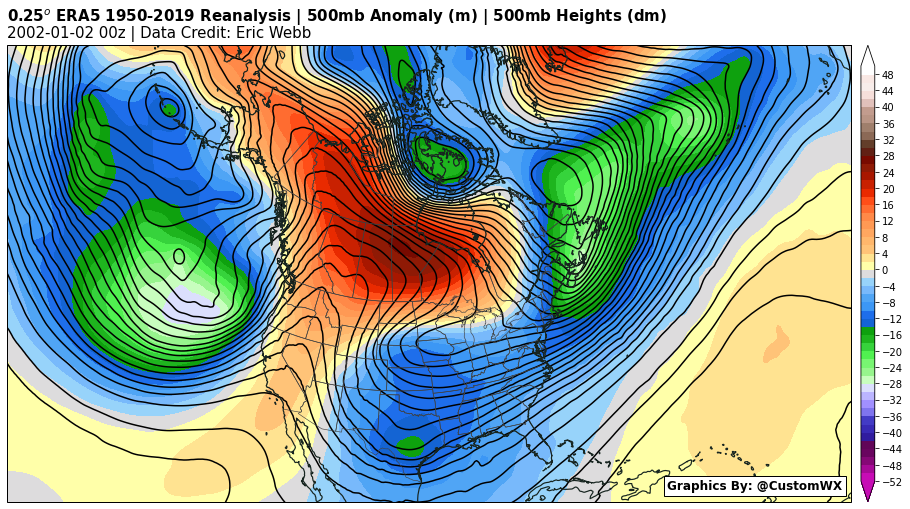
I know that Webber has been preaching this for a while, but I’m really not upset with the Pacific. Heck, I’m fine if we keep it as it is the entire year! I took a look back at some of our classic CAD/Miller B storms, and put them into a composite. Those years were Dec 208, Feb 2004, Jan 2002, Jan 1988, Dec 1971, Feb 1969, many of which produced a foot in Charlotte. Definitely some minor adjustments I would like to see, like more of a 50/50 low, but still, relatively close to the current look!
-
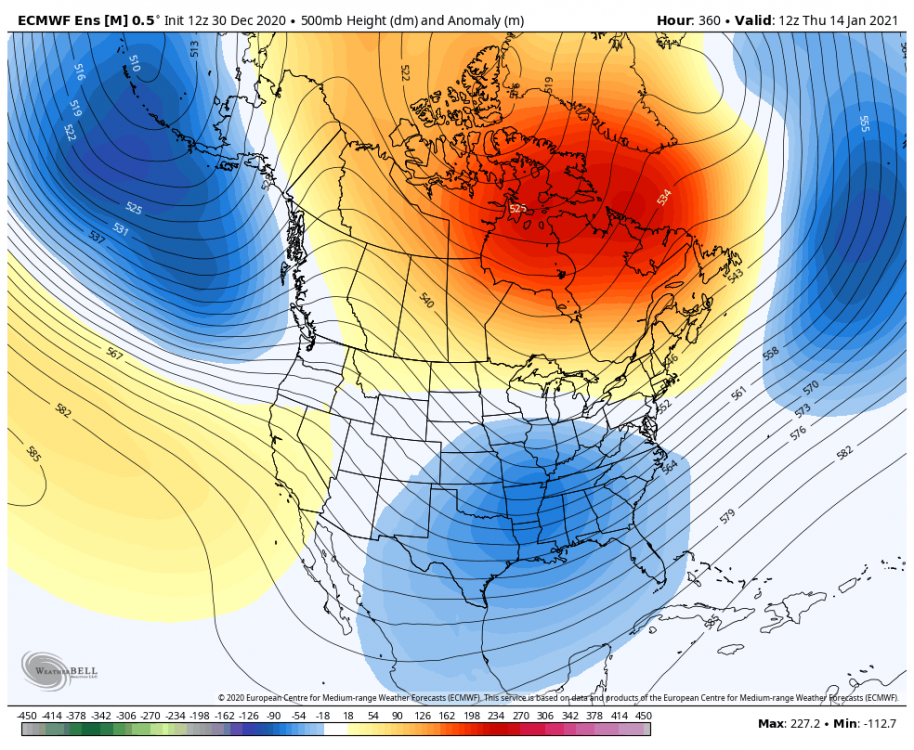
Here’s the H5 look!
-
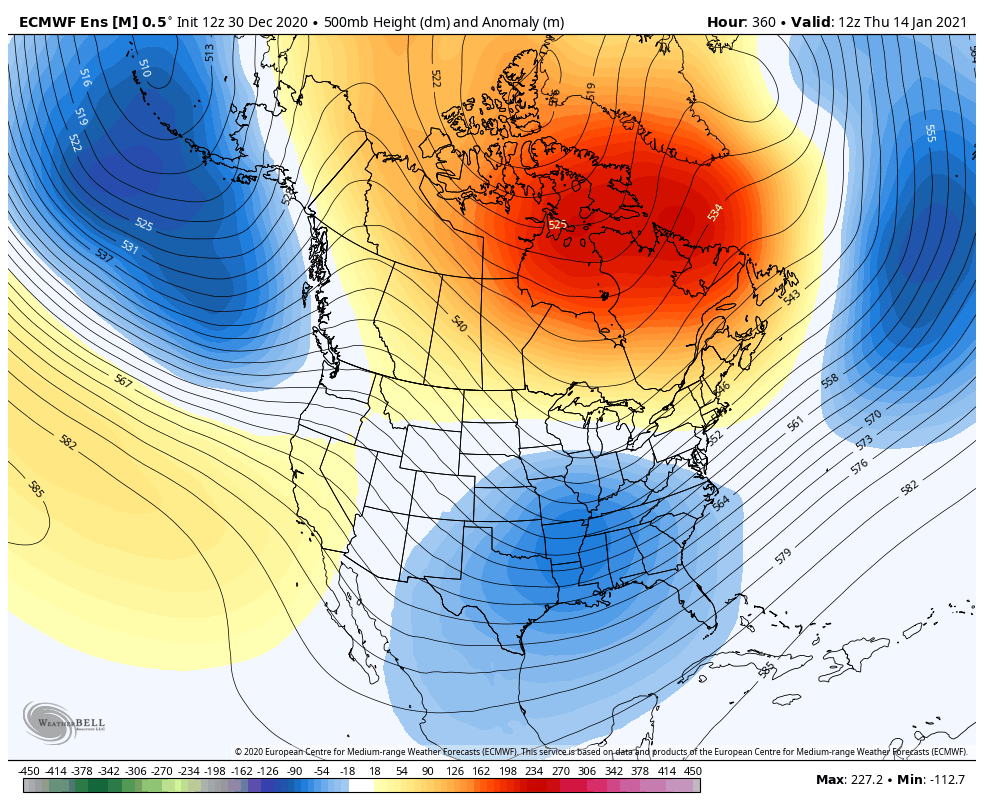
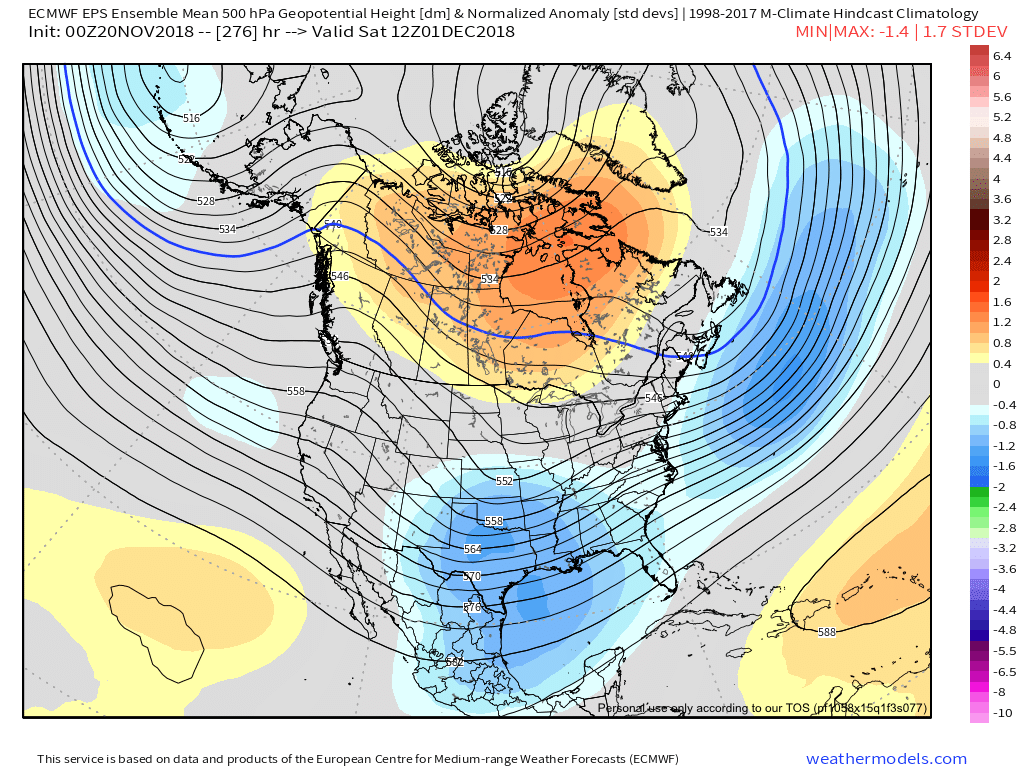
Interestingly enough, the EPS run looks extremely similar to late November, Early December 2018 (Timeframe where we got our December storm). Sure I'm cherry-picking a couple of maps, but almost identical look if we were to raise the height over Canada. To be clear the 2 maps from 2018 are not the same forecast period from two different models. .
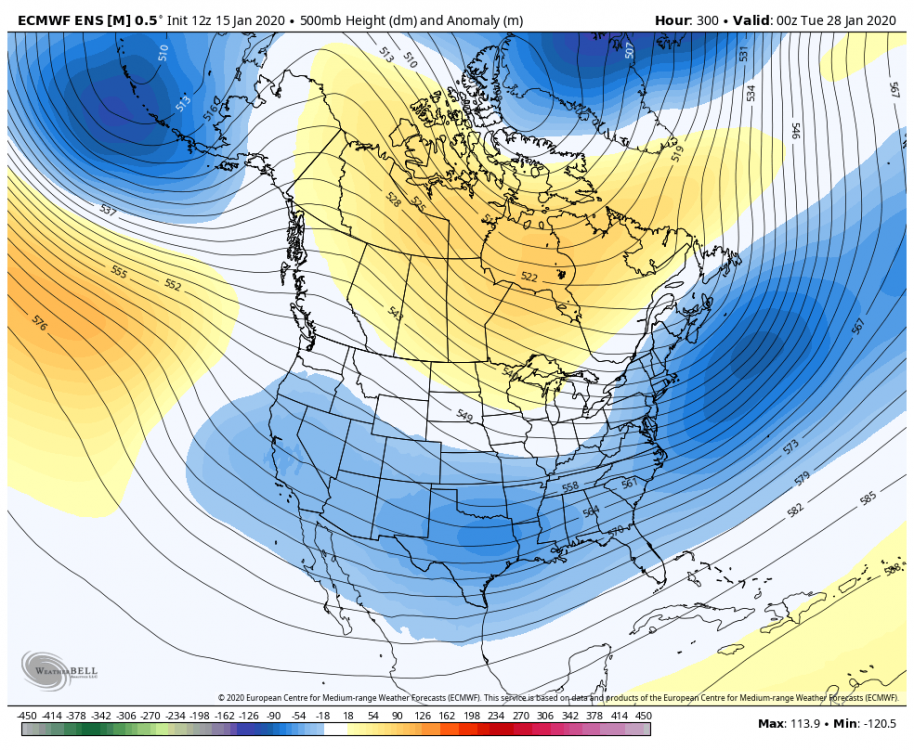
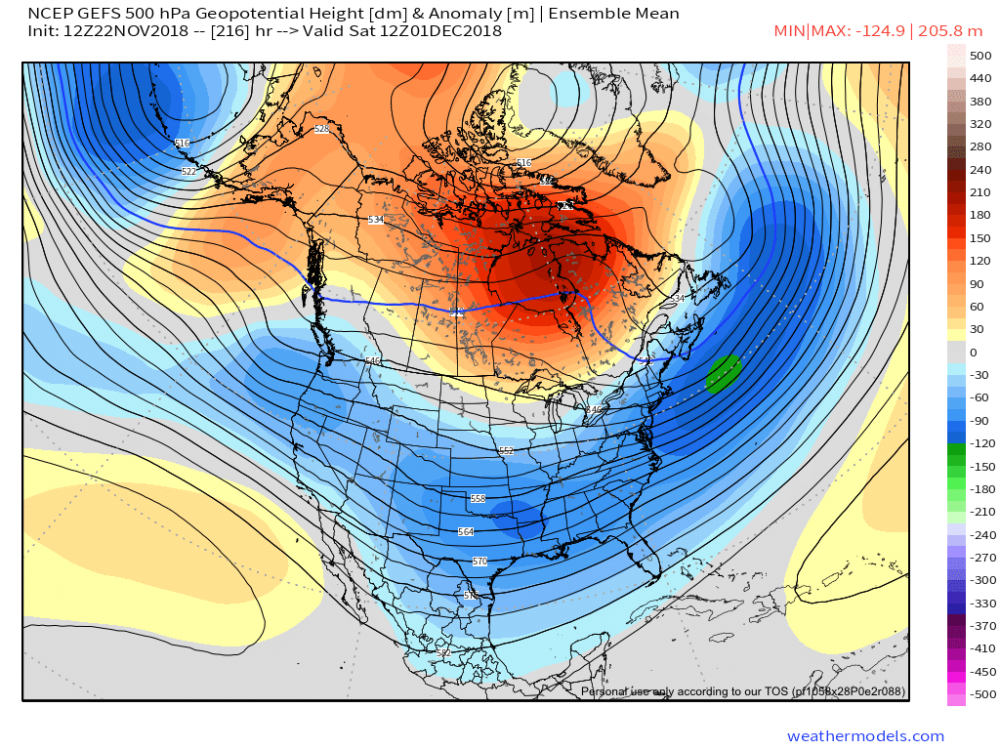

-
EPS isn't necessarily bad, it's just worse than 00z. At this point changes at H5 are well within the realm of possibility.

-
EPS is onboard. Lots of big dogs!


-
CMC onboard!


-
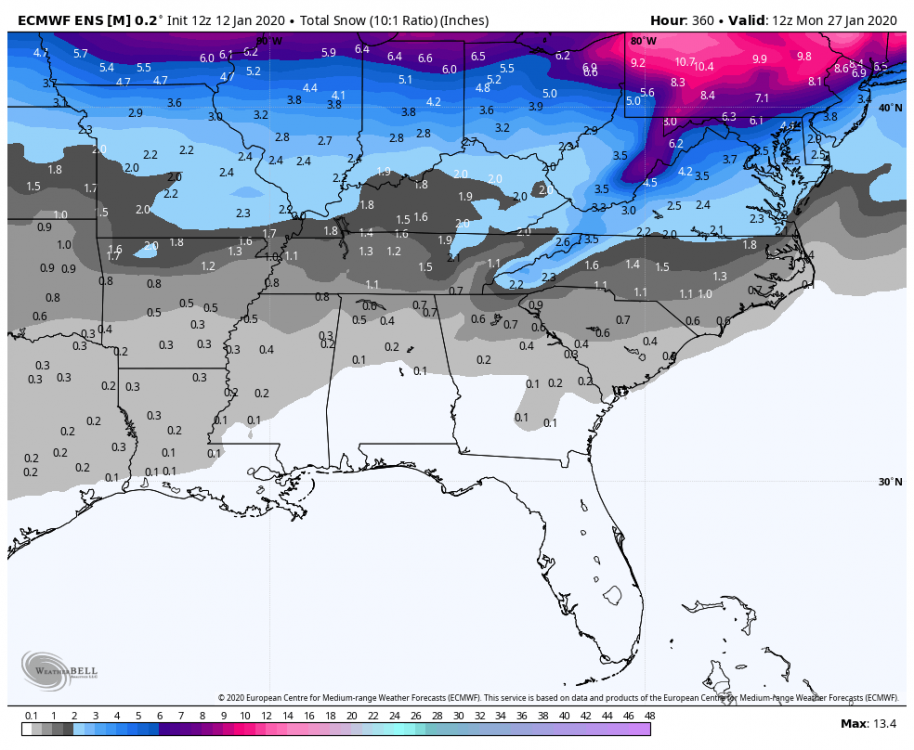
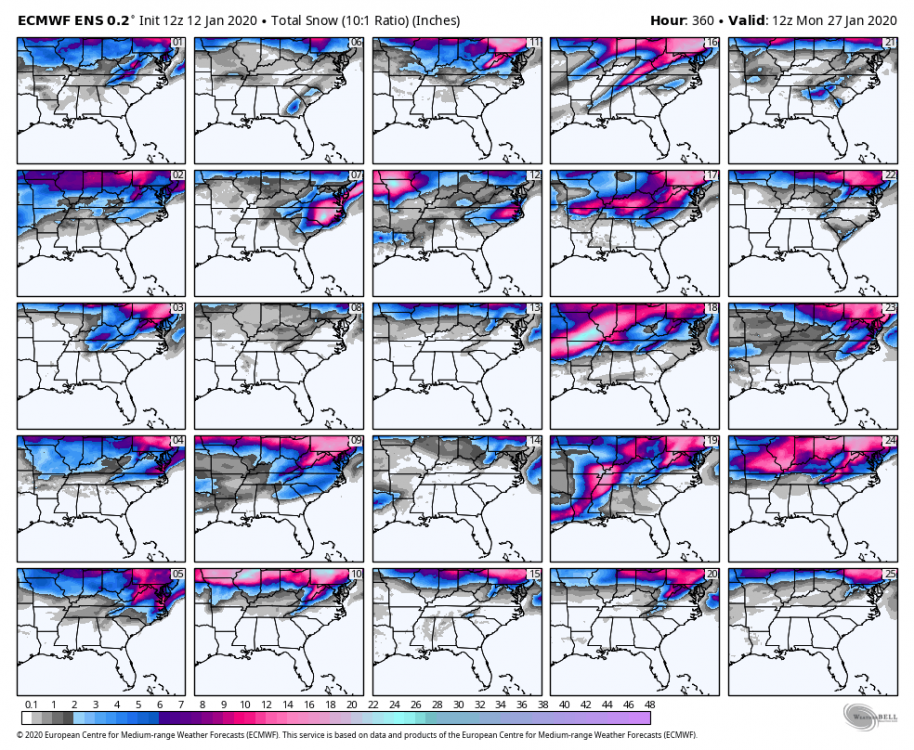
Most beautiful ensemble run since December 2018. Nearly half of the members are big dogs


-
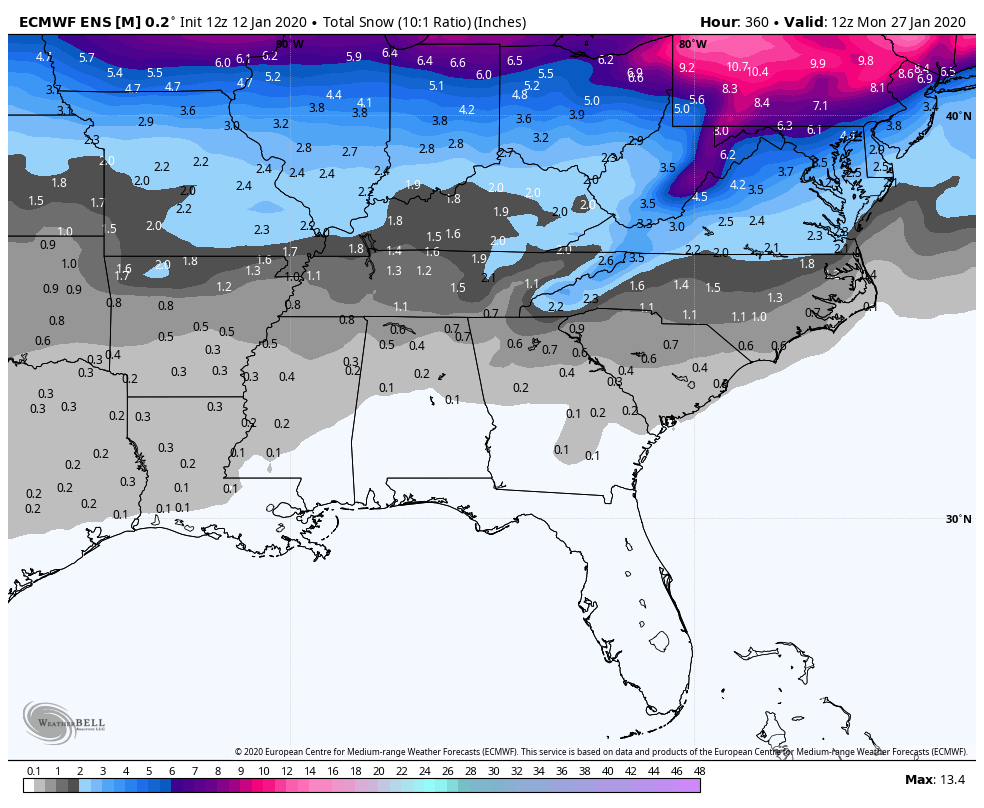
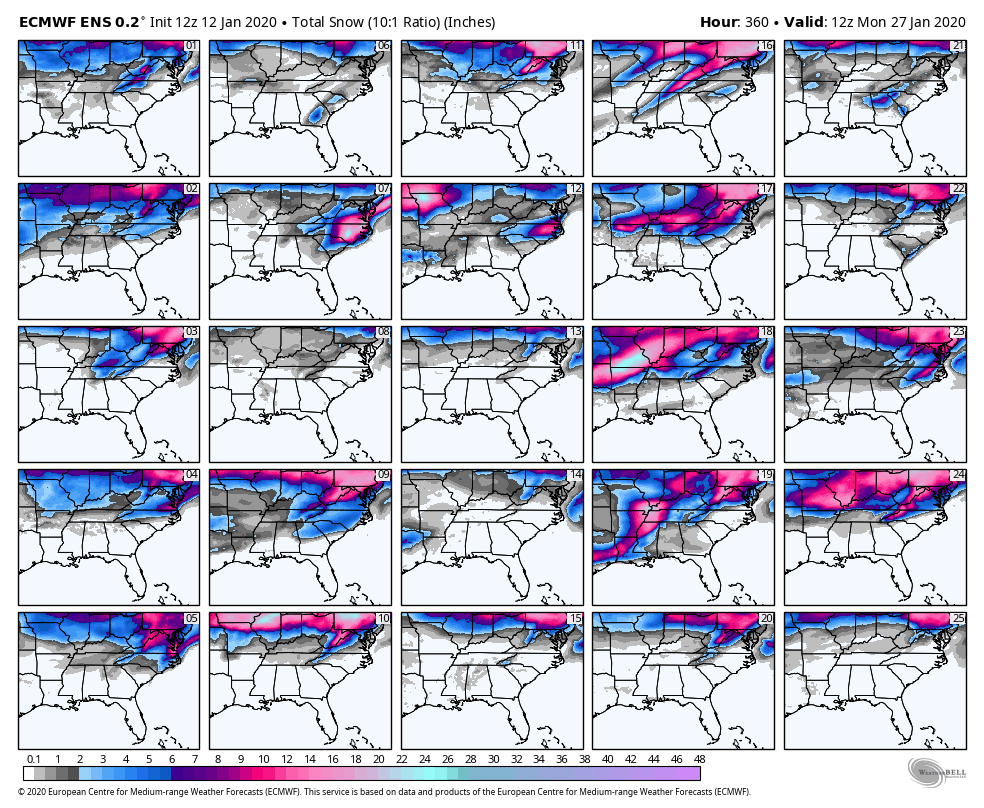
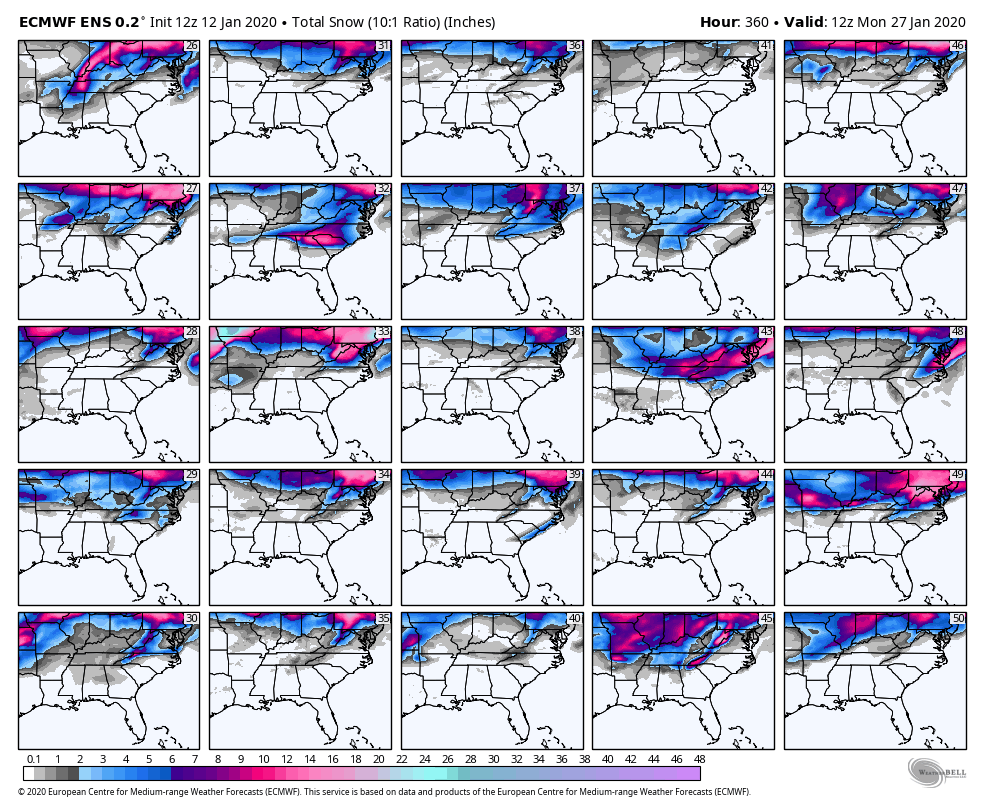
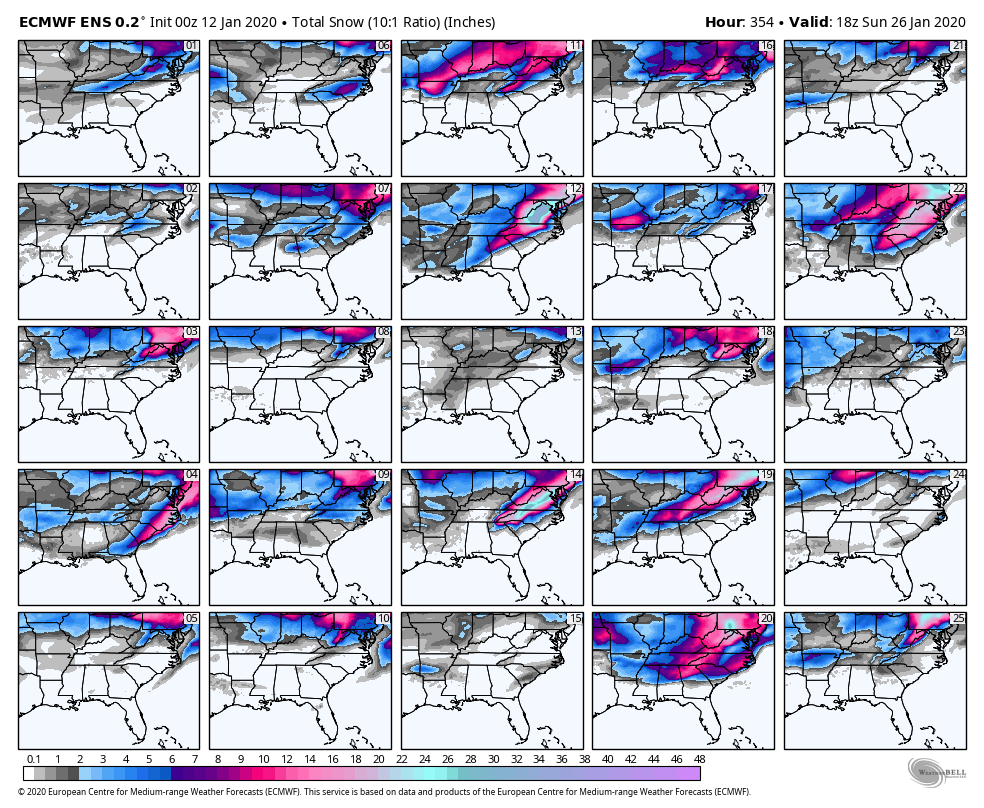
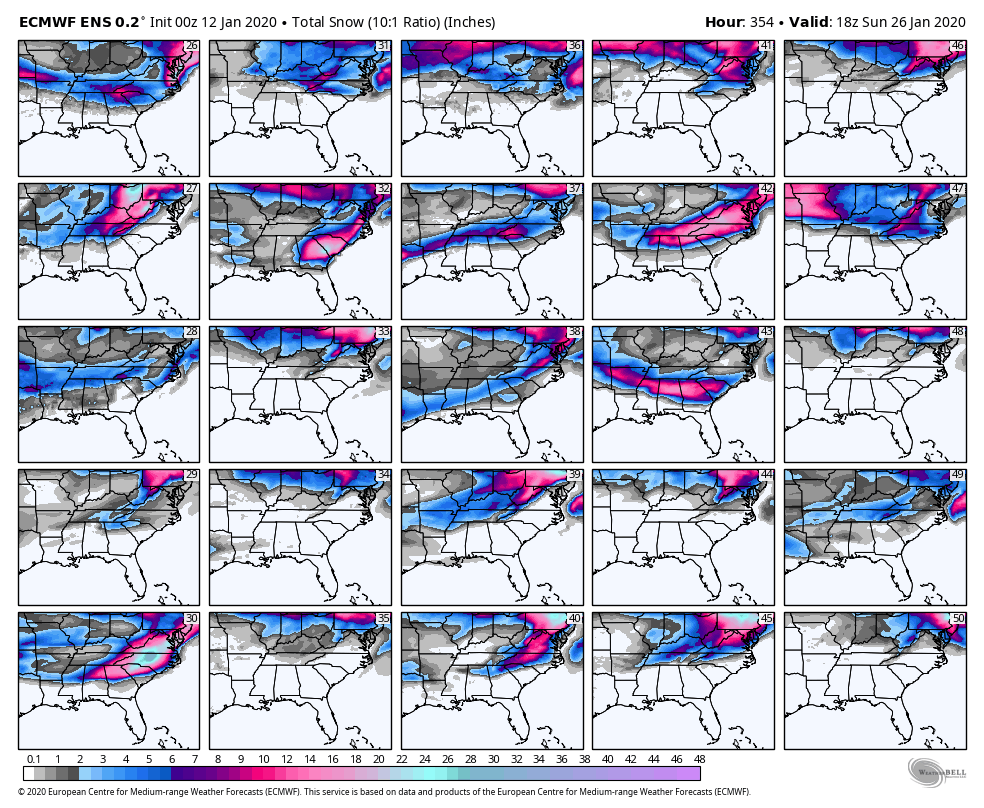
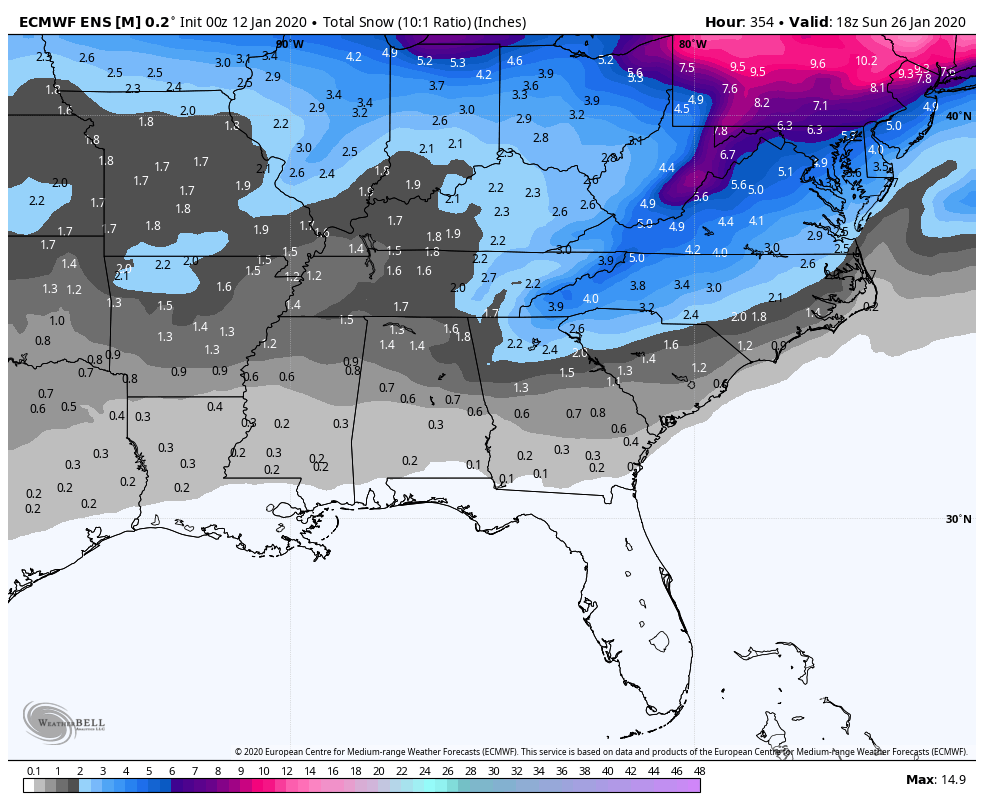
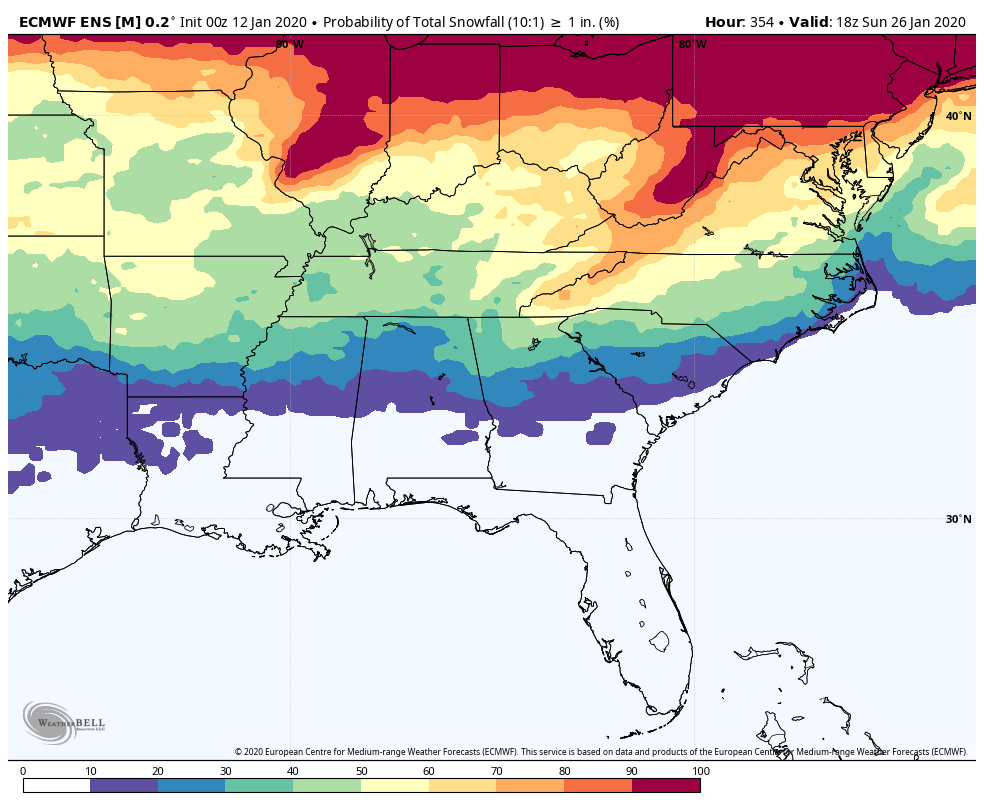
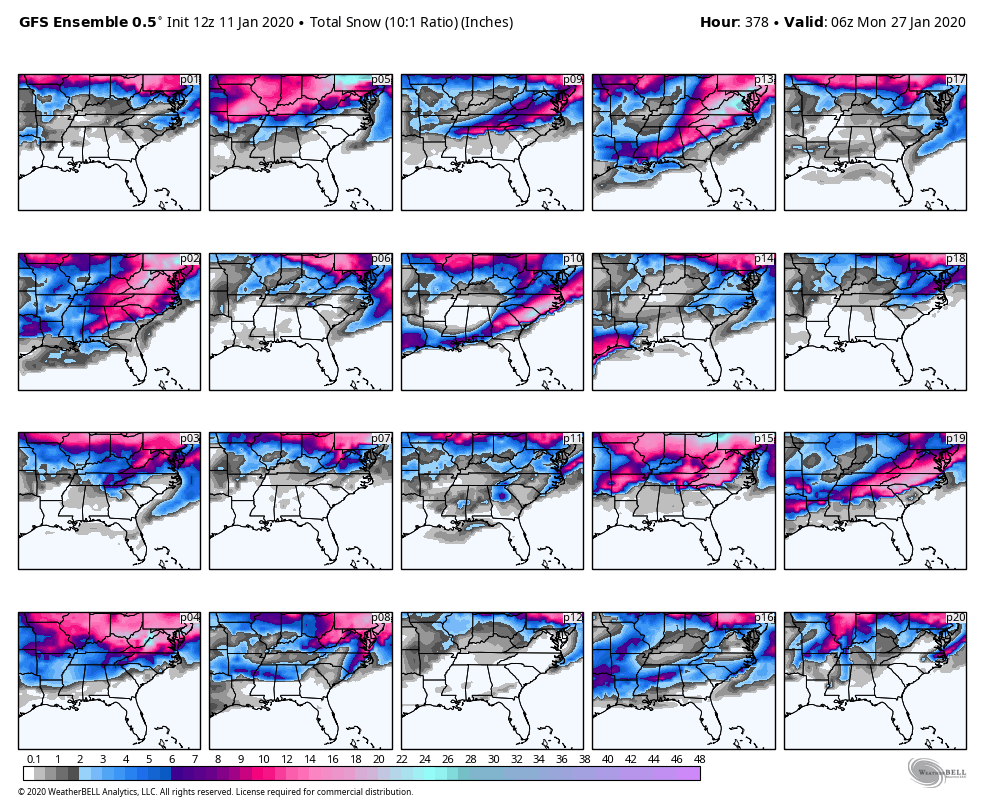
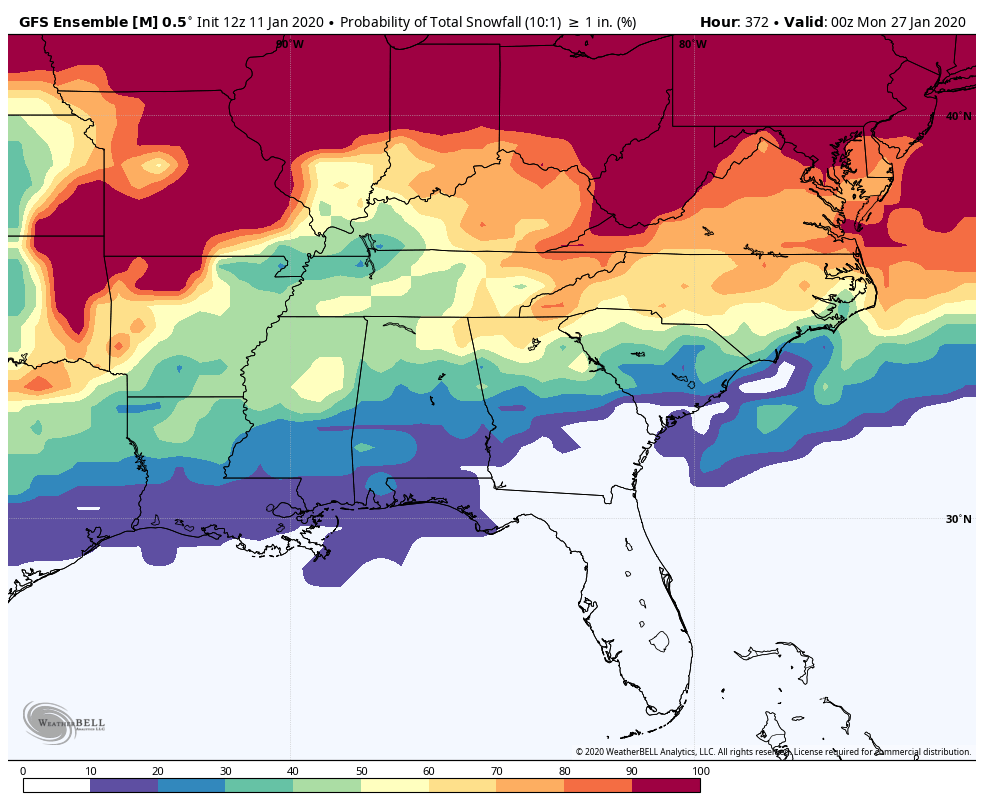
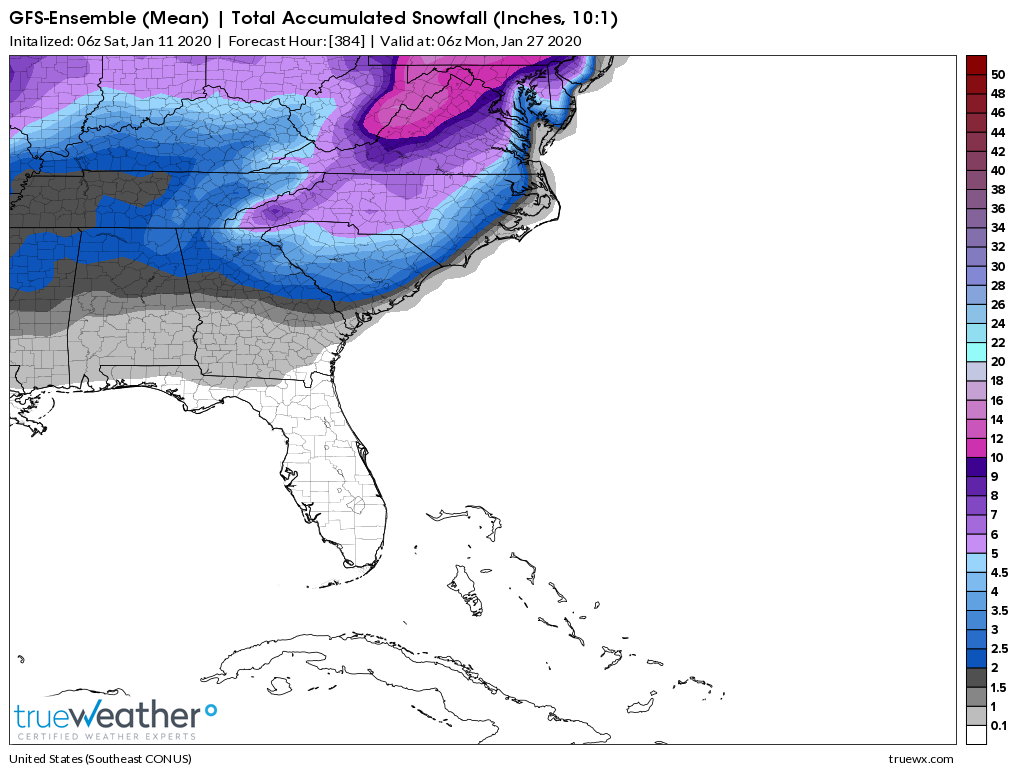
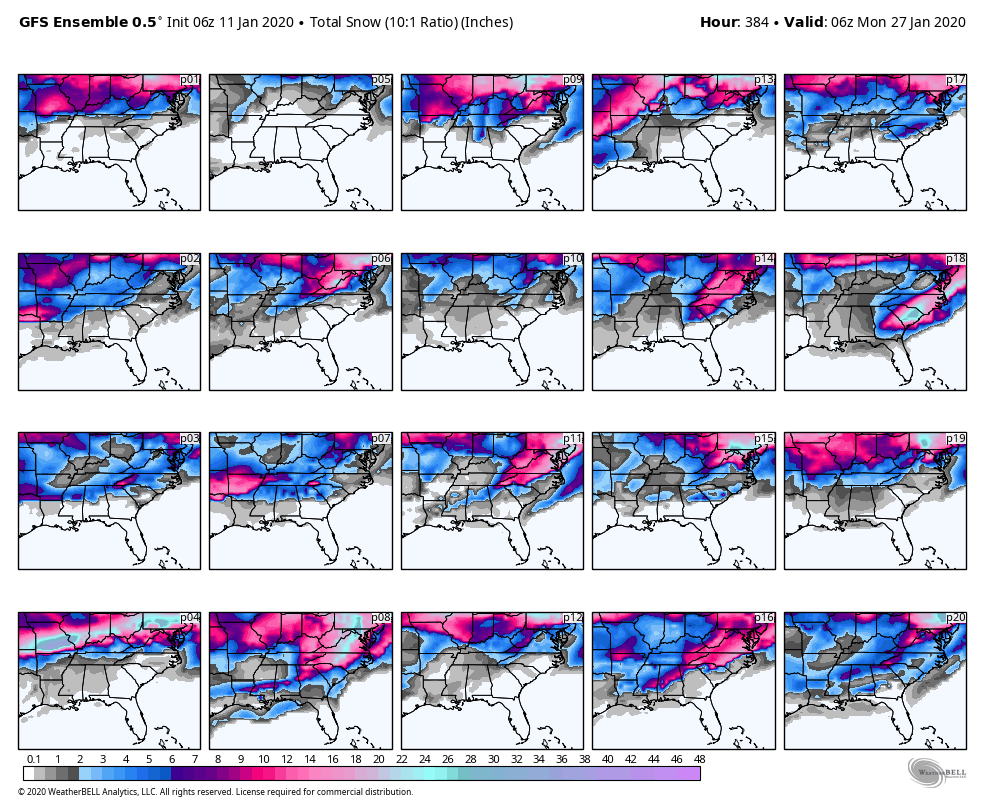
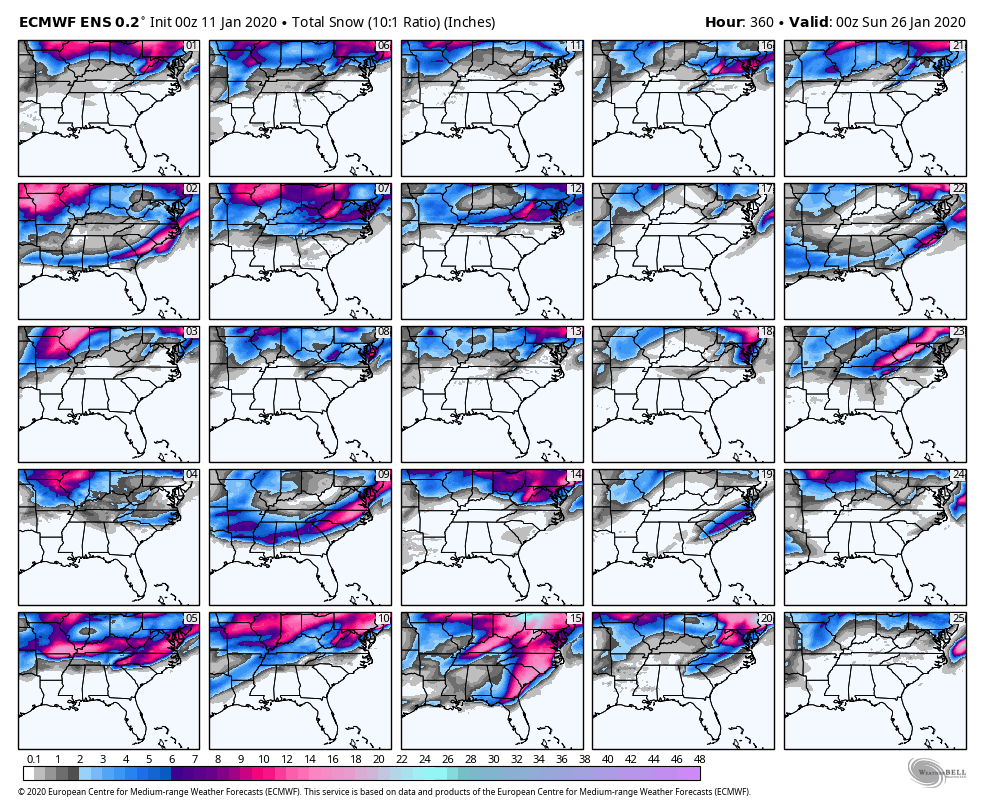
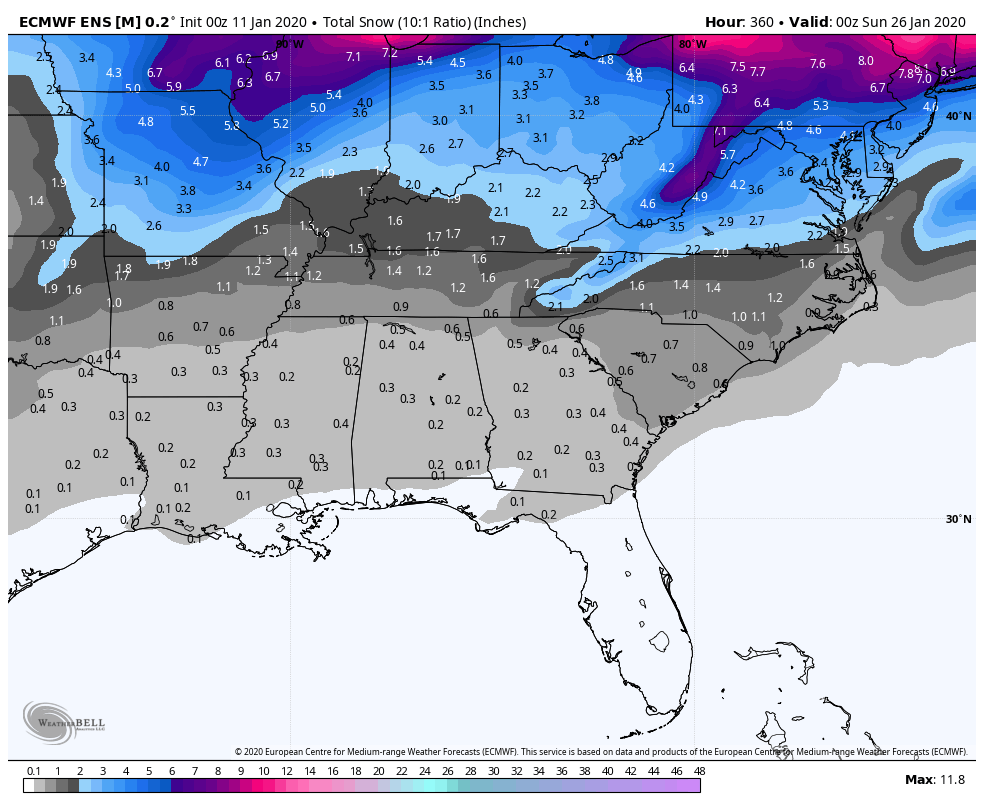
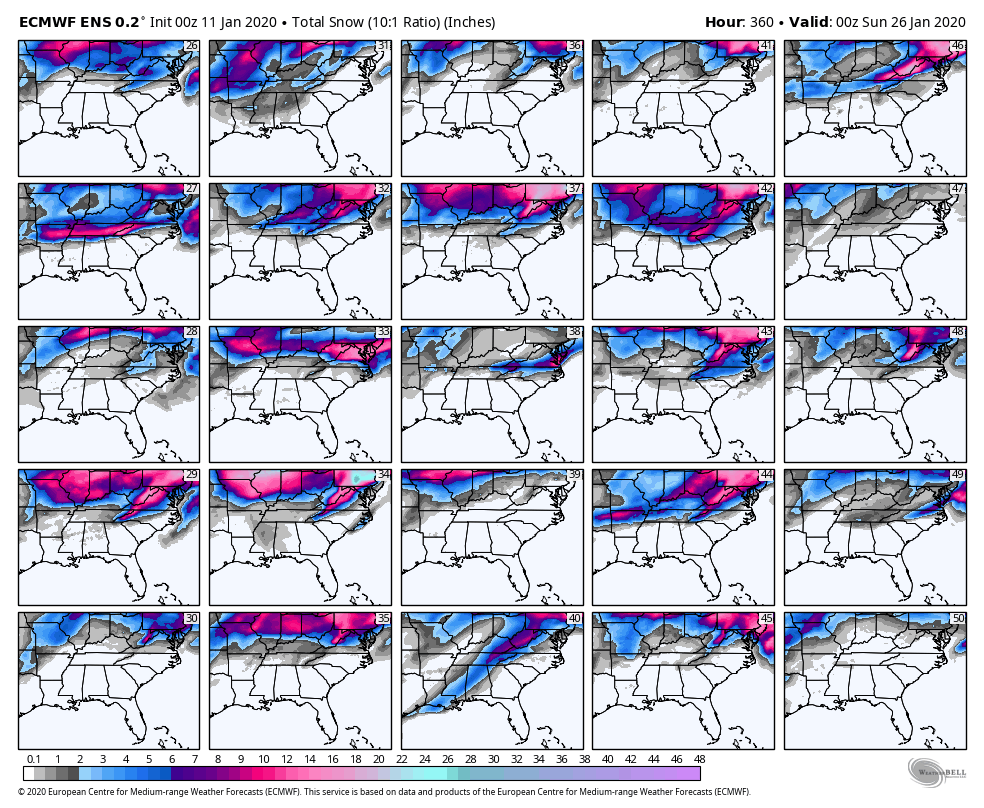
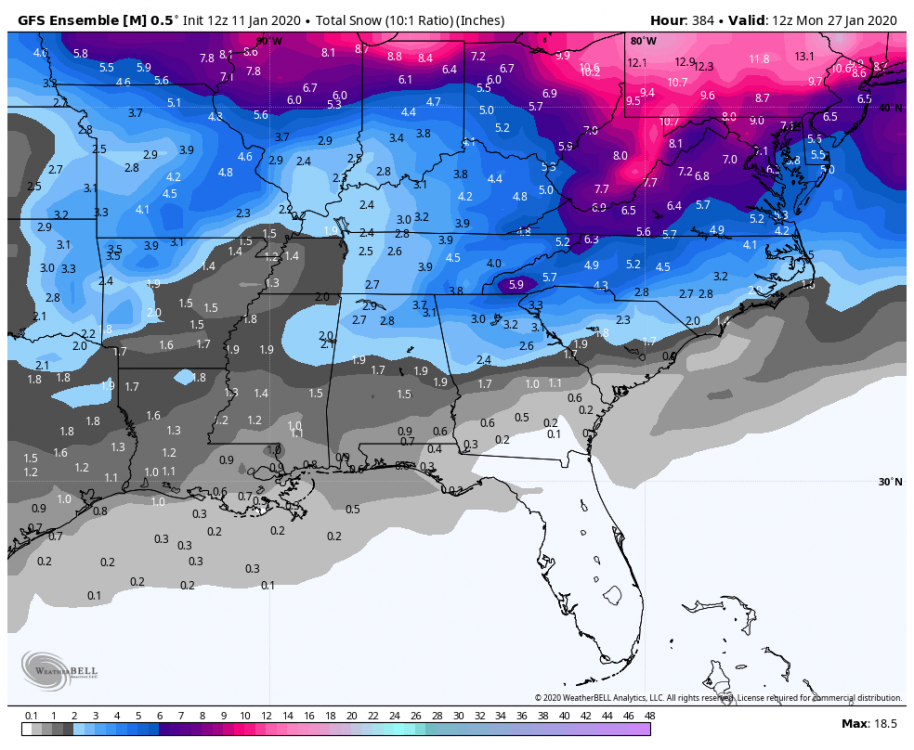
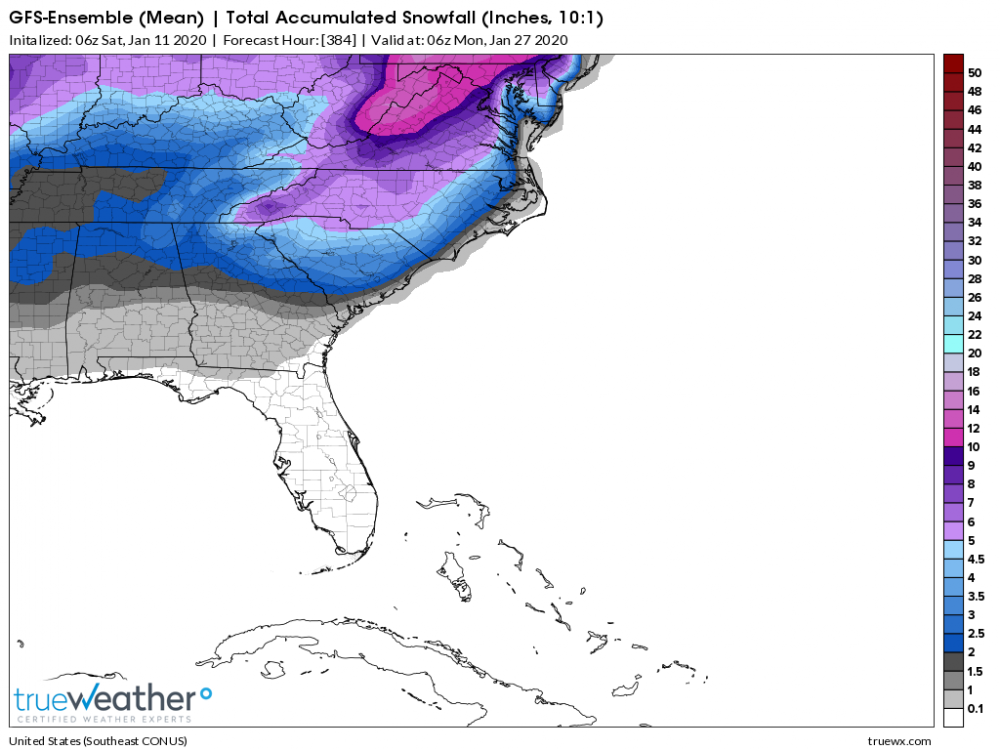
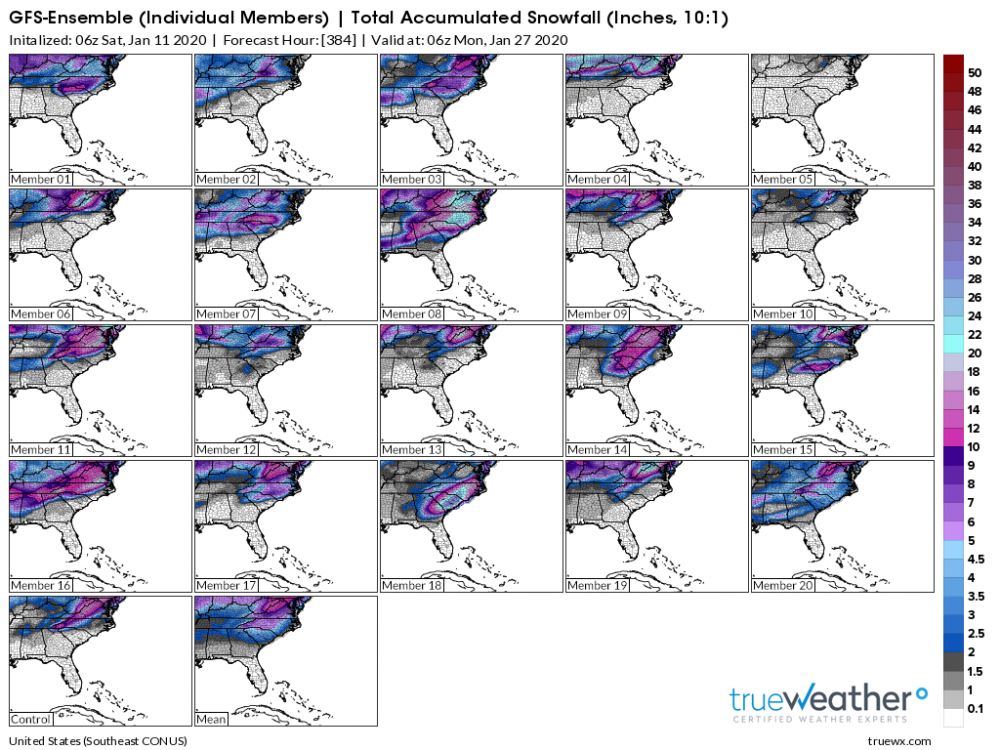
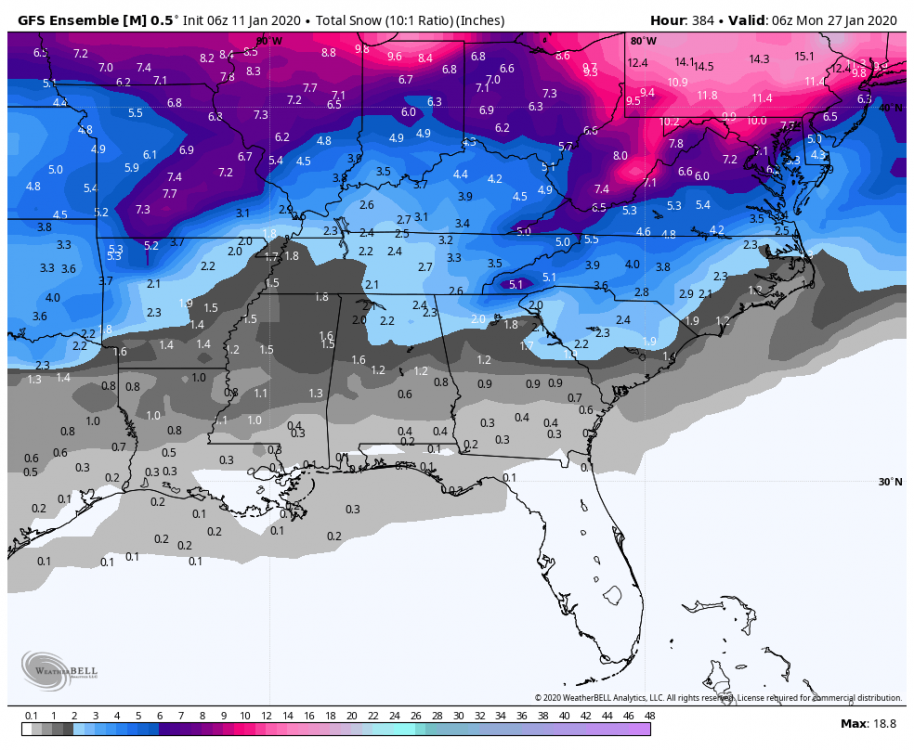
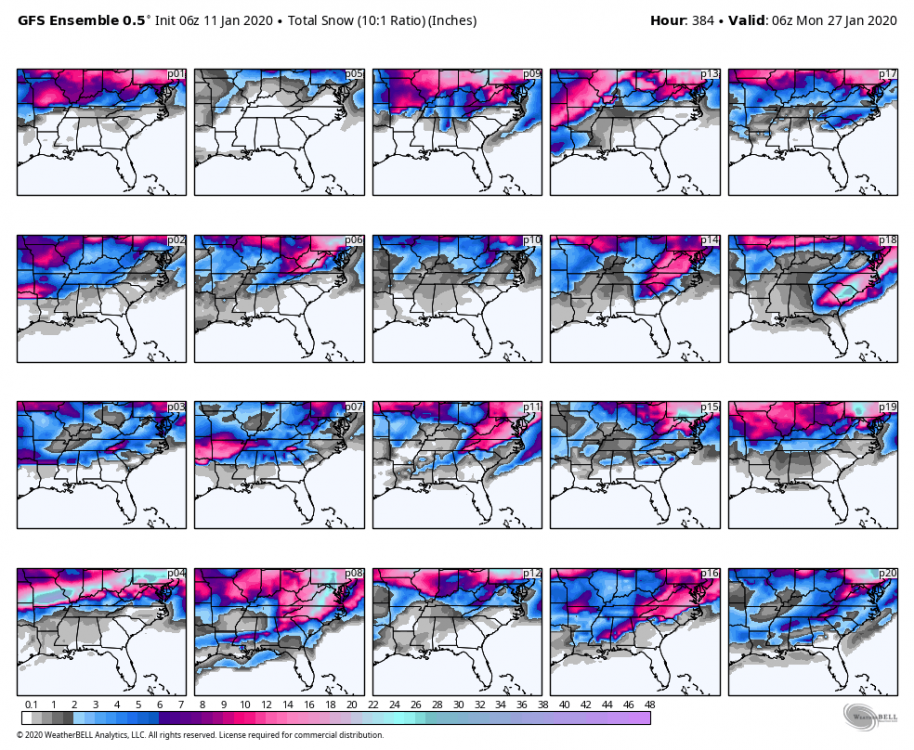
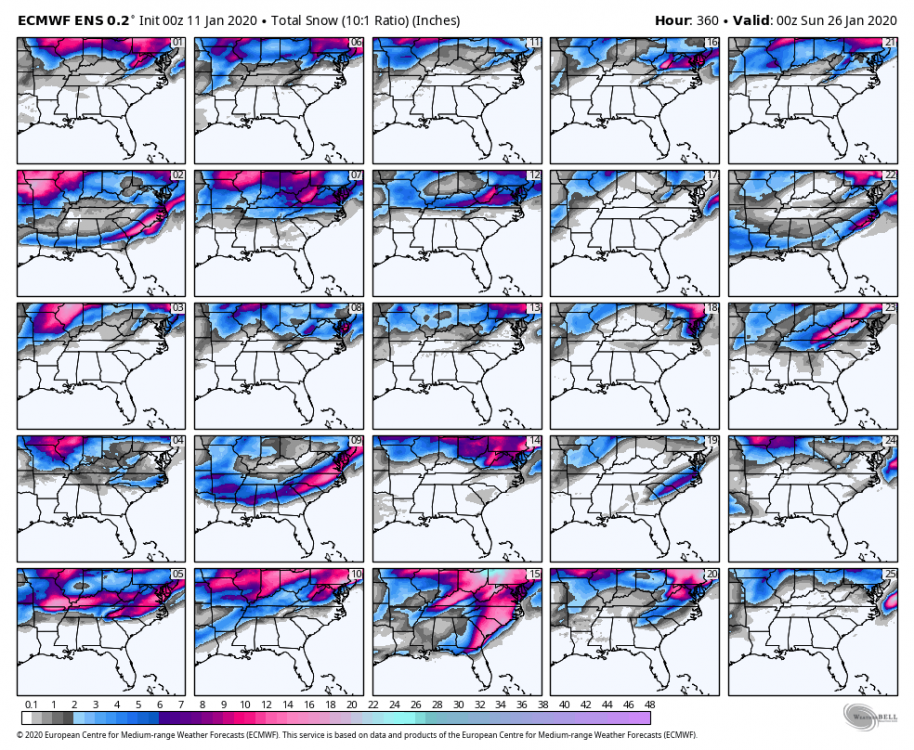
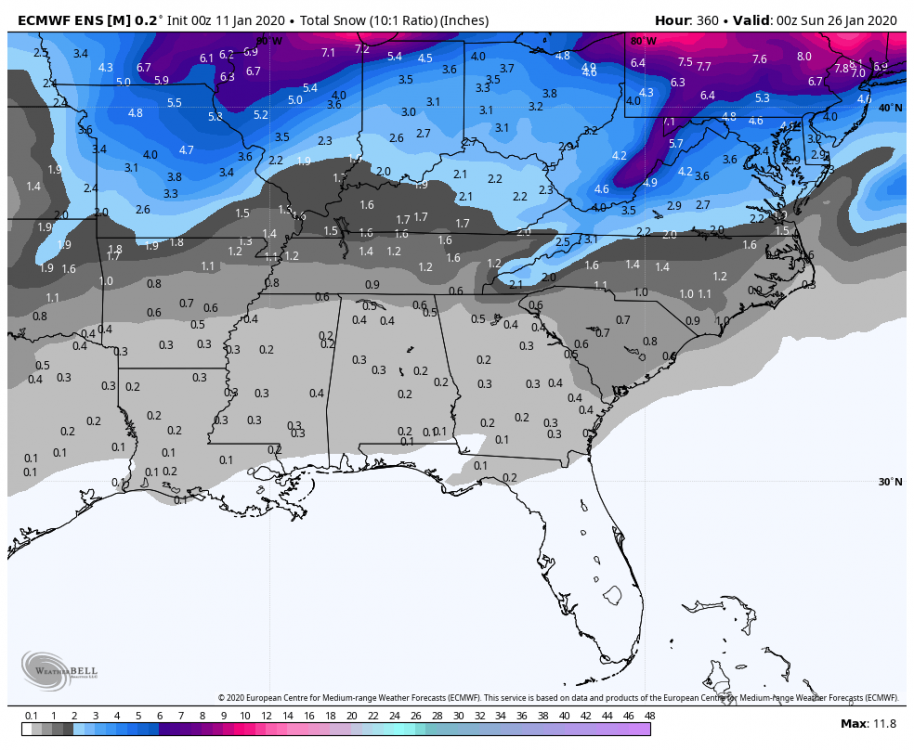
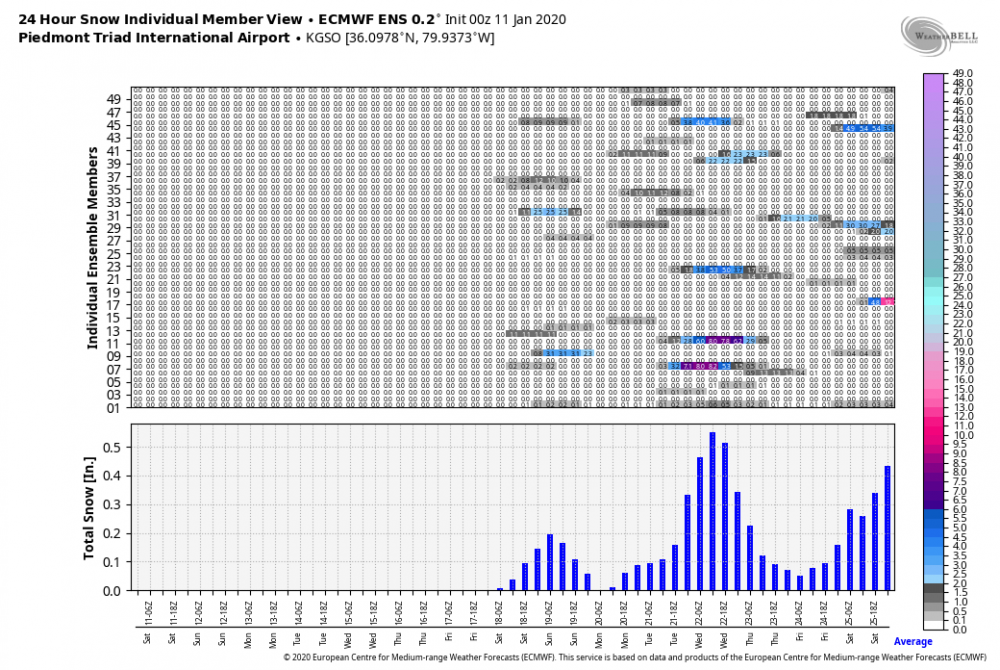
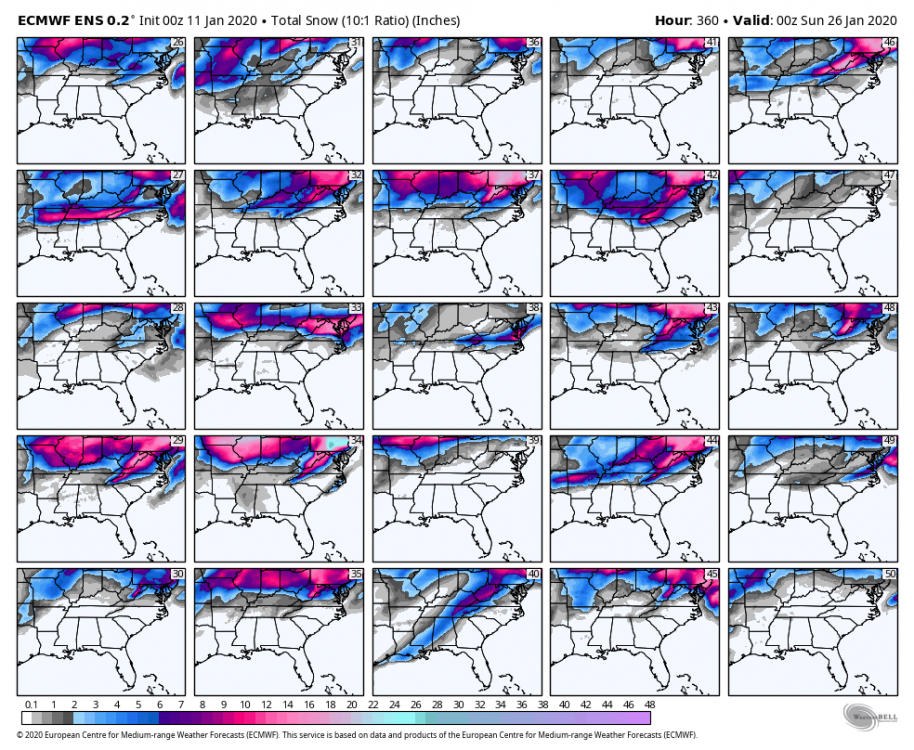
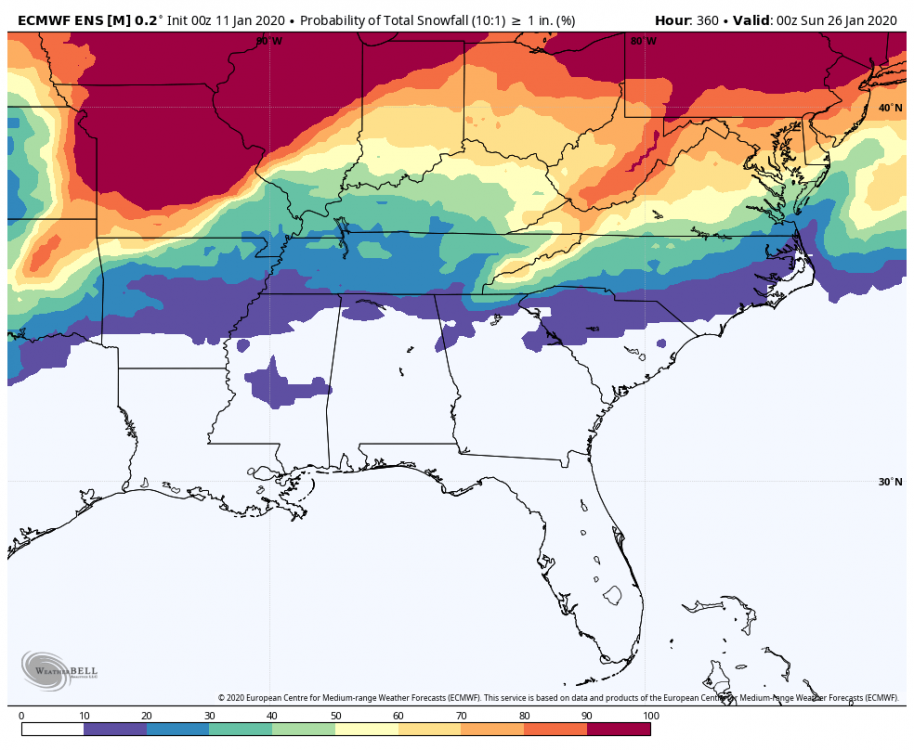
Maps: 1. GEFS mean w/ sleet (Largest since 06z yesterday) 2. GEFS members w/ sleet 3. GEFS Mean without sleet 4. GEFS members without sleet 5. EPS Mean (Highest run I’ve seen the entire year) 6. EPS Members 1-25 7. EPS Members 26-50 8. EPS percentages for over an inch 9. 24hrs snow Meteogram For GSO
-
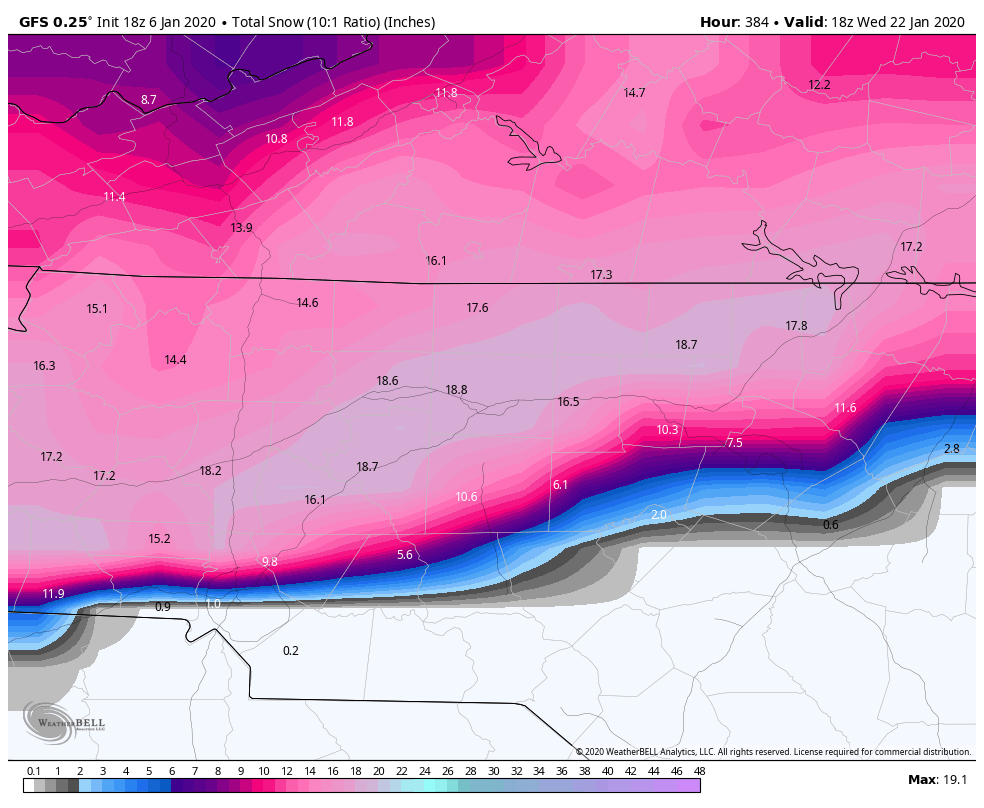
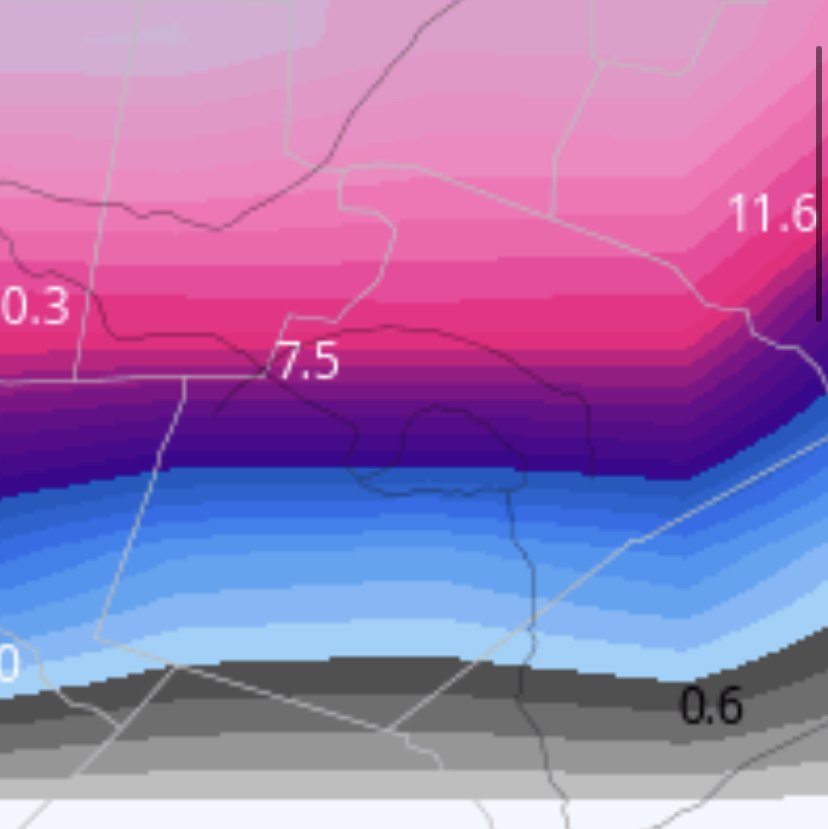
The 18z GFS based on the Weatherbell maps, is the most classic case of the Wake county gradient.