

WidreMann
-
Posts
7,874 -
Joined
-
Last visited
Content Type
Profiles
Blogs
Forums
American Weather
Media Demo
Store
Gallery
Everything posted by WidreMann
-
MFW we are talking about the German model.
-
How many weirdly placed shortwaves does it take to remove all chances of snow for central NC? We're about to find out!
-
Garbage storm in Durham. At the height of the storm, we had some slush. No accumulation at all today.
-

The December to Remember 7th-8th blue turd winter threat thread.
WidreMann replied to lilj4425's topic in Southeastern States
This was always a long shot. But I expect things to trend a bit NW by the time we get to Friday. Whether it'll be cold enough is quite another question. -
The December to Remember 7th-8th blue turd winter threat thread.
WidreMann replied to lilj4425's topic in Southeastern States
It's much better than 12z, which is what I usually look for. -
In this case, the concern is ice freezing and snowpack. The warmer temps could also be correlated with warmer SSTs, though which drives which (if not both) is a question I am not qualified to answer. In any case, we did see last year how extreme warmth slowed down and at times reversed the sea ice extent trajectory, so I am hesitant to say that the temperatures don't matter.
-
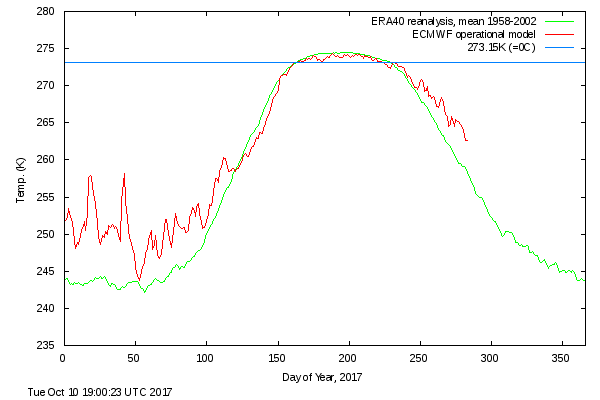
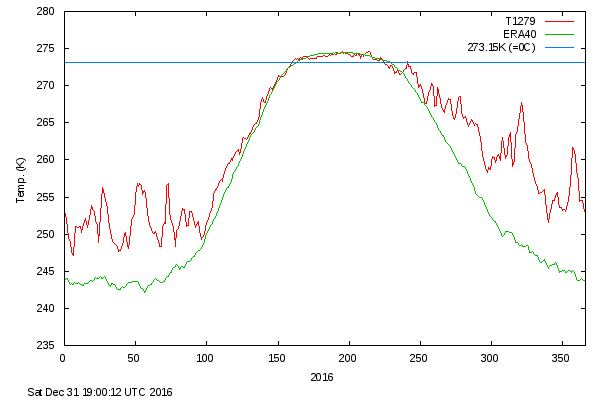
Arctic ocean temps remain fairly well above normal, though not quite as bad as last year. I suspect we'll see a slowdown in the refreeze. Not calling for catastrophe, but certainly unlikely to be a big rebound. vs
-
Yeah, what the hell is going on? We're having a more summerlike pattern now in mid-late September than we did in mid-late August, and temperatures are almost as warm for it. I've never seen such a large area of anomalously high heights across the midlatitudes and polar regions. It looks like the 2015-2017 pattern is continuing, and at this rate, we might get another warmest year out of 2017, which I was not expecting a few months ago.
-
To be fair, the median ice extent (15% concentration) this time of year is quite a ways away from Barrow. You have to go back to the early parts of the 20th century before you'd generally see ice in Barrow at this time of year.
-
Temperatures are now averaging above normal 80 north and neither the GFS nor Euro look great for continued cold temps. At least we don't have big storms messing things up. That's the saving grace. I bet we'll see a drop in the next two weeks, but it seems majorly unlikely to beat 2012, or even last year, I think.
-
That's where I used to go all the time, I just didn't know that was the acronym you were using. I do miss it as well. Much more detail and good anomaly charts as well.
-
What's the CT data?
-
I would trust the dynamical more than the statistical, because we are in uncharted territory here. Even so, it looks like the median of those models would still be above 2012.
-
Just to make sure I understand, when it says -320K, for example, it means 2007 had 320K less than 2017, or the other way around?
-
The sea levels get really high and then level off for a year and you are saying they are falling? That graph shows a very noticeable and consistent upward trend for decades. Who cares if one year is more variable? We had a super-nino. Everything is a little messed up right now. I don't know what "Arctic flip" you are talking about, but it was in sorry shape last summer and remains in sorry shape now. All that happened was that we had a slightly below normal May and June, so the degree of ice melt was less than we might have expected given the awful shape the Arctic ice is in. It's still way below normal and has been the whole season. Nothing changed drastically last November after the election, nor after Trump took office. If you are going to have a real debate, at least use actual facts.
-
I did it in 1 minute in Paint.NET, so it's going to be ****ty (and I did mean for it to be from '10-'17, but wasn't being careful). Also, that period is very tumultuous, so I don't think a linear trend from 2010-2017 is meaningful. We'll have to see how it looks after a few more years, especially after we recover from the super-Nino.
-
-
It looks like there was a slow rate until the early 2000s and then we are basically level since 2010.
-
Yes, this one: https://forum.arctic-sea-ice.net/index.php?board=3.0 I had seen csnavywx post there, so I figured there was at least some legitimacy. But there's definitely an unnecessary amount of doom and gloom.
-
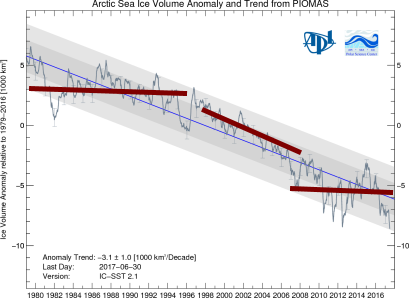
It's funny y'all are saying this, because on the Arctic sea ice forums, they seem to be convinced that we're going to have some ridiculously low year because the ice is in an unprecedented poor state. And yet the AMSR data does look considerably better than 2012, no doubt. I think the concern comes from PIOMAS being near or below 2012 and potentially overstated. We'll see. I'm moving into the camp that we won't beat 2012, but it won't exactly be pretty either.
-
Given the state of the ice, very thin and broken up, I don't see how we don't beat 2012 by a decent margin. While the pattern isn't terrible, it's not great either. We certainly will beat it on volume.
-
And yet snowcover has been very high this year. Perhaps that argues for a positive feedback cycle that might offset some of the losses expected due to warming. It'll be interesting to see how that affects the proposed changes in Siberia and in the general circulation. Either that or this year truly is an anomaly.
-
It is an anomaly chart, so what you are really asking is why doesn't the anomaly just get worse and worse. My guess would be that the sun angle starts to lower at the end of June and southerly parts of the arctic begin to have night, so heating effects lessen as the summer goes on. That means there's a sort of upper limit to how much warming will happen.
-
I still don't see how we don't beat 2012. The pattern doesn't look great for the foreseeable future and the ice is in terrible shape. Extent may be better than 2012, but thickness is downright awful. I could see us falling off a cliff in July.
-
I went through a skeptic phase too. I was in high school and I was naturally skeptical about all sorts of stuff, if only to be contrarian. I also didn't like the idea of winter going away. But the evidence became overwhelming and I jumped ship.

