ORH_wxman
-
Posts
91,688 -
Joined
-
Last visited
Content Type
Profiles
Blogs
Forums
American Weather
Media Demo
Store
Gallery
Everything posted by ORH_wxman
-
MJO is screaming along way faster than guidance keeps progging. I think it’s going to be hard to lock in a pattern until we get one of those standing waves. Remember when it was stalling it in phase 7 until well after Xmas? Now it’s going to into phase 3 on or just after new years. They are trying to drag it in phase 3 for like 10 days right now but my guess it is does not do that and moves right along. The weird thing is that despite model guidance showing a prolonged phase 3, it’s still trying to dig that trough in the west which is the opposite of phase 3 during January El Niño. Esp for higher amplitude waves…wonder if we’ll see guidance try to correct a bit as we get closer if that wave stays strong like all the previous ones have.
-
Might be 37F and mist by tomorrow morning…keep hope alive.
-
Jan 58 had a large event on the 7th/8th. Hopefully we get the same this winter during that first 10 days.
-
That was a crazy comeback that winter. We just missed out on some additional big snow in ORH late that winter but still managed to pull close to 50” despite having 5” entering 2/1….still the lowest on record at the end of January. It really wasn’t that far off from getting to climo if that April event worked out and we got just a bit less mixing during Vday.
-
Scott and I used to preach all the time on how awful the 2m verification was. Also, there’s different flavors of “warm source region”….if it’s warm up there and also warm to our south, we’re usually screwed. But anytime I see like NYC-southward normal to BN then I immediately think “ok that’s not a torchy pattern per say, maybe no arctic cold so we’re not getting 0F nights, but easily should support some snow threats in New England in January.” Like getting stuck in that -5C to -8C band at 850….you’re gonna pop highs into the 30s a lot when it’s not precipitating under that but any storm would typically be snow assuming no cutter track (which that H5 profile doesn’t favor). We have a lot of example of this type of pattern working for us. Patterns like Jan ‘87 come to mind or even Jan 2001 and into early Feb 2001 was another great one…absolutely torched into Canada and a bit AN into New England but not to the south….and we got dumped on during that stretch.
-
In the interior up here 2000-01 was one of the best. After the 12/17 cutter, it snowed a few inches on 12/20, then 12/22 and we never saw the ground again until April….funny part was that winter wasn’t super cold. It just lacked any real torching cutters or prolonged warm spells…but I think overall it was like a -1 to -1.5 departure winter. ‘02-03 was pretty solid too…again, eps over interior where they got whacked by 12/25 and 1/3. Snow didn’t go aby where after that until well into March. That winter, unlike 00-01, was very cold. Something like -5ish.
-
Retention is huge for sledding and skiing up north. Hopefully we can lay down a few synoptic events at least for NNE over the next 10-12 days and get things restarted. That arctic shot on the euro today would be kind of nice…get those water bars frozen up.
-
The 1980s El Niños were a lot more prolific in the interior…I think especially for BOS to NYC. Down in DC area they were pretty solid. But up here you had near normal or slightly subpar in the ‘82-83, ‘86-87, and ‘87-88 Ninos along the coast with much better amounts relative to average in the interior. Exception might be the Cape in ‘86-87. Problem with that decade was there weren’t any super prolific snow winters near the coast and several bottom 10% type winters. The old “not much upside but lots of downside” rule which is going to make for a rough decade.
-
I wouldn’t call forecasting a huge snowstorm for the Mid-Atlantic in a potent El Niño sometime in late January or early February complete luck. That is basically their most climatologically favorable window and favorable ENSO state to get one. You’d have to know that type of climo and ENSO background to do it. But overall I agree with the difficulty in pinning down favorable windows. There’s so much chaos that can throw things off that we aren’t able to comprehend.
-
The last thing you want models doing is heuristic output. You want them to obey physics as much as possible or their solutions will be even more error-prone. The reason sometimes analog forecasting can outperform a LR model is because of potential model biases in either initial conditions or their inability to weigh certain influences more heavily. For example, I don’t think models are trying to weigh the likelihood of an SSW months in advance like a long range forecaster might….someone like Ray knows that -QBO and El Niño have a much higher chance than climo of producing one. But as model guidance gets closer and can “see” that type of event, then the physics will respond and you’ll see changes. Model guidance used to be so much worse beyond day 6 than they are now. In fact, we hardly looked at any OP solutions beyond day 6 other than just for fun. Even ensembles were so-so. They still have issues but not like 15 years ago.
-
At least the pond skaters get their cold shot on the 12z Euro.
-
Unless it’s Jan 2014 I remember you’d get a cutter that month, then days of 0F with no upslope.
-
There were hardly any airmasses that warranted good LES. Only that early December shot seemed to do it.
-
OP GFS was a pretty torchy run. You’d forecast a bit colder than that based on ensemble guidance. There’s no need to get too specific on a 5-10 day forecast when you’re going to see some swings on deterministic runs.
-
Many are the same trolls who did this back in the late 2000s or early 2010s and then would mostly disappear as soon as the snowstorms were verifying only to return to troll away during the next cutter or whiff….their scorn was well-earned. I think it was 2014-15 when one of them just was relentless during first half of Jan ‘15 and then basically disappeared post-blizzard for obvious reasons. I’d have to go back and look at the January ‘15 pattern thread to refresh my memory. Ive often called them the anti-snow JBs…just like how JB will never miss a cold shot or snowstorm, these posters will never miss a warm pattern or cutter. Of course, just like JB looks silly during +5 months, they will look the same way when the worm turns just like they did in some of those other years.
-
Yeah don’t disagree there. I also don’t disagree that early January never looked brutally cold. To me it sort of looked near normal which is obviously a much colder look than the +5 December temps. But it may end up being more like +3 or something instead of near normal. We can still snow in that pattern, but it’s harder with a lower margin for error.
-
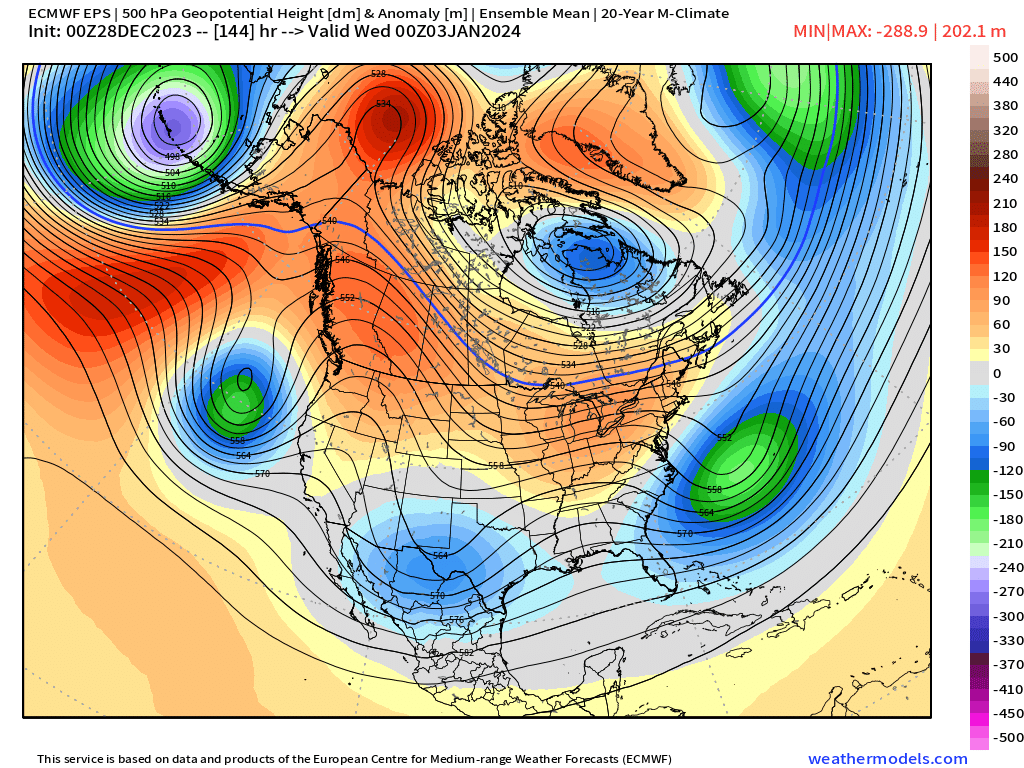
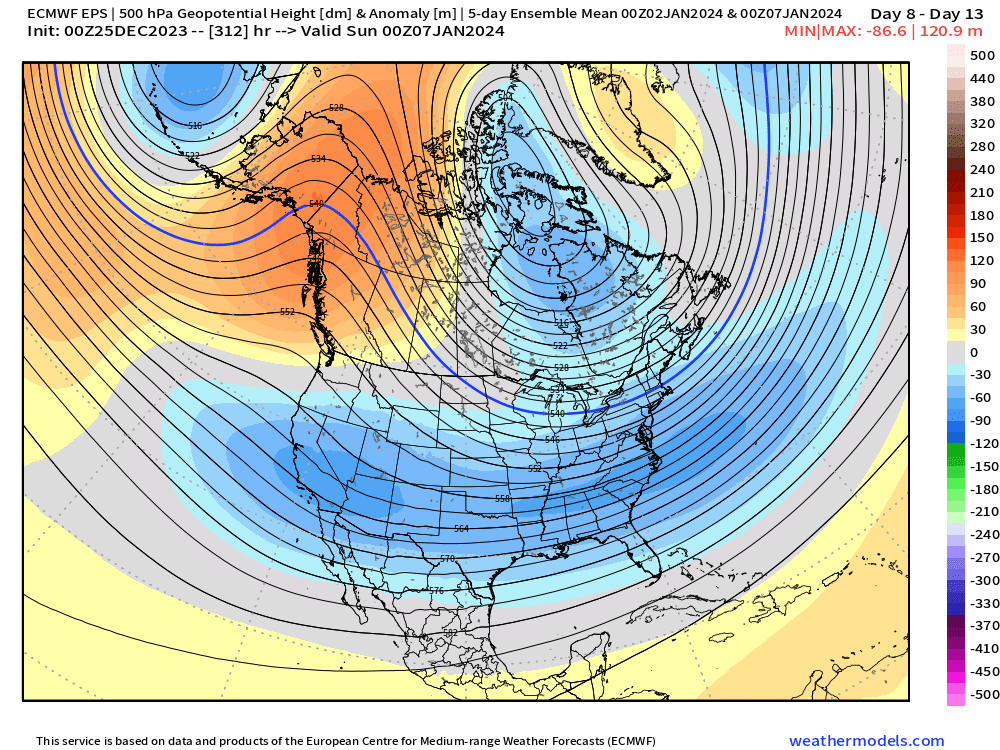
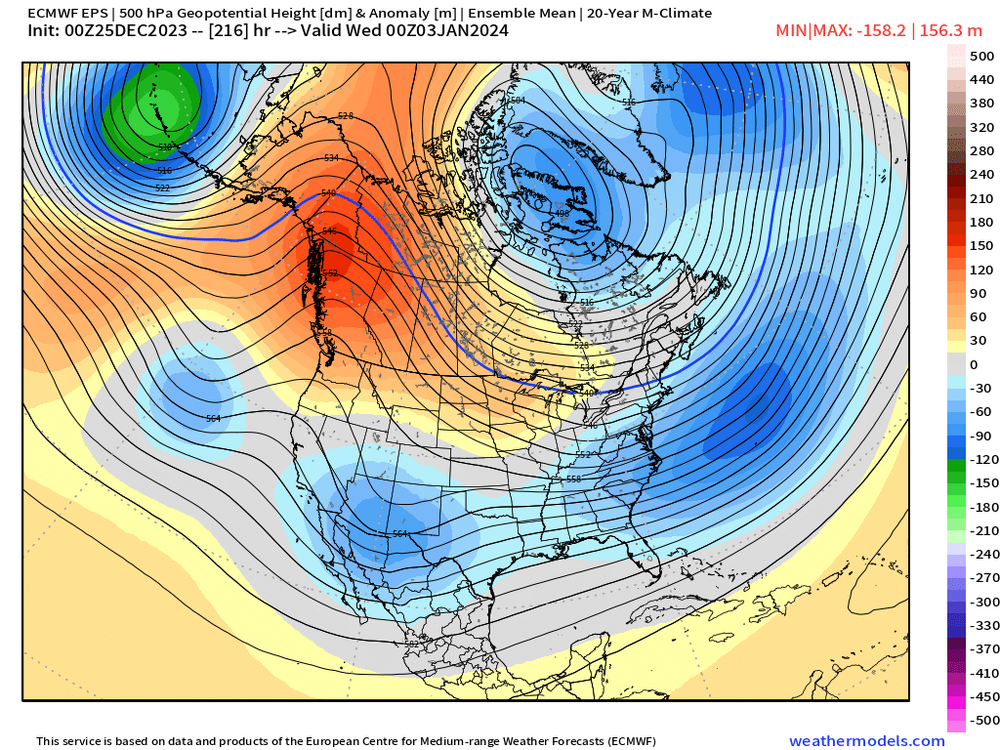
Oh I see what you’re saying…I still don’t 100% agree. We were consistently progged for N or BN heights here and that may not verify… This is the 5 day mean from the 12/25 weeklies run from 00z 1/2 to 00z 1/7
-
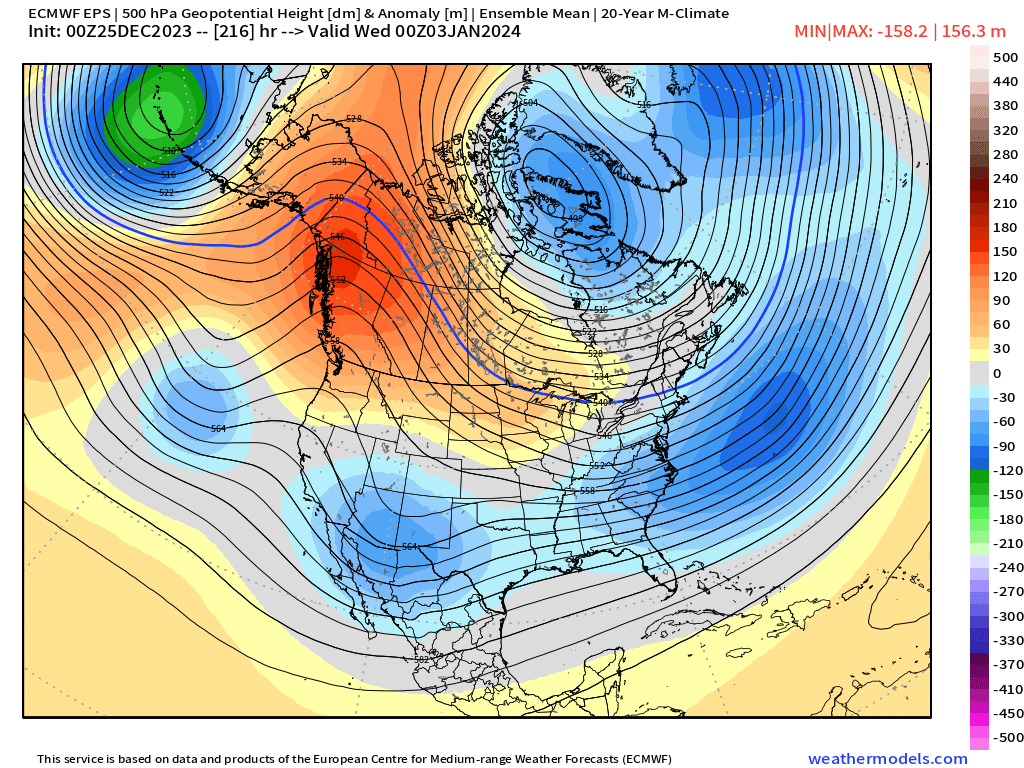
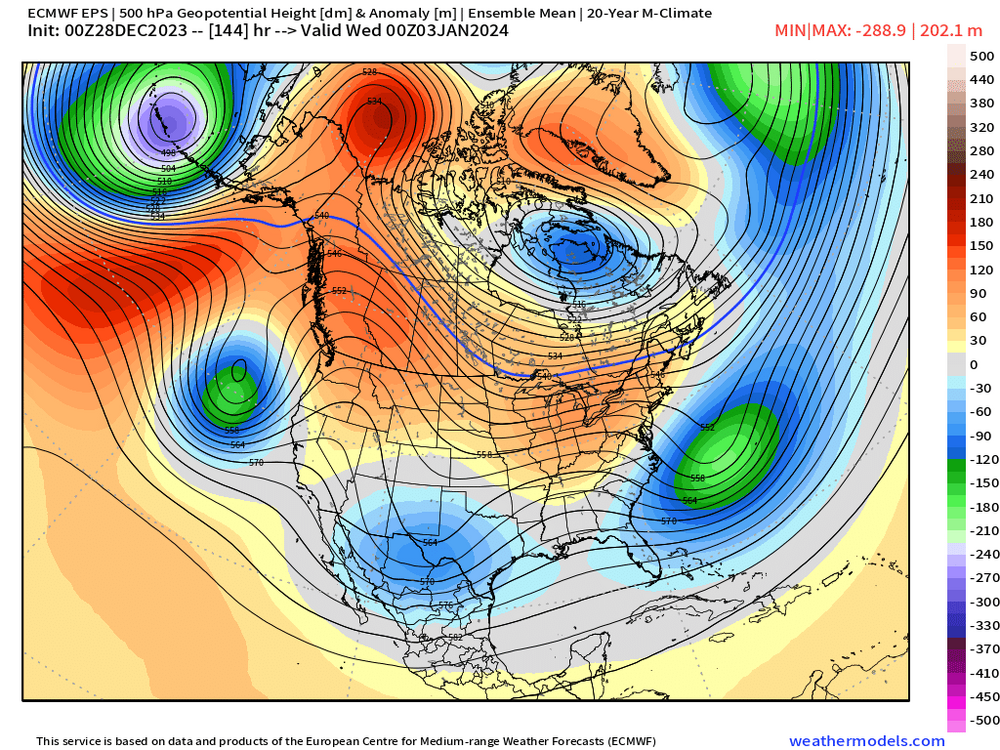
No those are both point forecasts valid 00z 1/3.
-
To be fair, early January on the H5 level looks more hostile than it did even a few days ago…look at the EPS valid 1/3 for the 00z 12/25 run versus last night. That 00z 12/25 run is definitely a colder look than last night…the flow has become more zonal near the Canadian border and the PNA ridge a bit flatter than was being advertised…it’s not a massive change hemispherically, but those subtleties can be the difference between a pretty blah AN boring outcome and a potential snowier/stormier outcome. That 12/25 look has a decent source region for Se Canada…so instead of 850 temp anomalies around -1 for SNE, we get +3
-
Anyways, I’m hoping we still follow the ‘57-58 progression…extremely wet/warm/snowless December….then got our first big snow January 7-8…then up and down pattern for rest of month with a few moderate snow events but also a big benchmark-track rainstorm (I could do without that one)…then an epic Feb/Mar. That year also had a stratosphere event with big blocking second half of winter.
-
What’s up with the MJO? Everytime I look it’s going like 10x faster than guidance thought it would. Now into phase 3 by new years.
-
You completely missed the point. Anecdotes don’t mean crap (see the Minneapolis example from above…warmest winter in record there is like 135 years ago). Yes, we’re warmer on average than decades ago but this would’ve been a shit pattern regardless of CC. Maybe we would’ve been +3 instead of +5 if it was several decades ago. Michsnowfreak was pointing how funny that random article talking about a warm Christmas in Minneapolis as if that’s the new normal…no, it’s not the “new normal”. The warm records are easier to break because of CC but an excessively warm December pattern in an El Niño doesn’t represent a new normal. These discussions are pretty dumb in a seasonal thread as it is…take it to the CC forum if you want to argue that 50s in the northern plains is a modern day normal.
-
It very well could be. 1990 was really bad though. That’s the only one off the top of my head that might compete. Maybe 1998 too. I’d have to check to see if some garbage year in the early ‘50s might have matched/exceeded it. 1989 was about as bad as it gets for snow but it had the obscene record cold in December and the moderate Tday snow event so that automatically puts it above 2023.
-
To be fair, most of those images are weeklies. We know not to trust those…esp past week 2. I do remember that fleeting time in late November (shown in the first image) when some guidance tried to make the second week of December much colder/stormier. That’s fair game, but it did flip back to showing meh pretty quick. The NAO verified but it didn’t have any staying power…so we only got a few days of BN temps, and the shouts shore did get that one snow event during that time.
-
Yes it is a decent pattern on average for New England. Also seen at times in the 2008-09 winter to name another. I think the excessive warmth last winter and so far this winter has made many forget that we don’t need the PV on top of us to have decent snow chances. But it will probably take a few events actually verifying for many to realize it.