Holston_River_Rambler
-
Posts
6,206 -
Joined
-
Last visited
Content Type
Profiles
Blogs
Forums
American Weather
Media Demo
Store
Gallery
Posts posted by Holston_River_Rambler
-
-
This Easter Sunday outbreak looks like it could be ugly to me on the Euro. I don't know very much about severe parameters or exactly how ugly, but as Webb's cyclone map that Windspeed posted says, one look at that is all I need. I am not a fan of storms moving SW -> NE with a strong upper low moving over the bootheel of Missouri, since that can send them right up the river valleys in East TN with a lot of shear. Most damaging storms I can remember have that motion.
Looking at Pivotal soundings, still looks like most of the worst is S and SE of east TN, but all I'm going on is the "threat box" if that is what it is called, where it tells you the possible wx threats. Most soundings over middle E TN give a "Marginal Severe" result, with "Marginal Tornado" nearer Nashville, but near Chatt it is giving a tornado result, with storms moving up the TN river valley near the mts. Euro suggests that there could be a bigger line/ clusters of cells moving through first, and then more with a secondary line of discrete cells as the front moves through.
What do y'all who know a lot more about severe weather think?
-
1 hour ago, Carvers Gap said:
Sounds like you are in the market for a quiet generator.
Indeed. The people who owned my house before had one and there is still an electrical hook up for it, but alas, I didn't foresee our current situation so spent building a fence instead. I may check out home depot tomorrow (weekly run into town).
More of an observation, but the air quality is night and day here in Morgan county when compared to my old place just under I40 in Knoxville!
-
 1
1
-
-
Yeah, if the N steam energy ends up verifying a bit faster and the southern bit across the SW slower, they could play together.
As Windspeed's quote above says, I guess it's not out of realm of possibility that the northern might be quicker and the southern one gets hung up a bit.
Beautiful pattern on the EPS too. Will be interesting to see if any EPS members get it done.
Normally by this time of year I'm out of the snow zone, but would be kind of fun to have something besides COVID to chase on the interwebs. I'm fortunate enough to be able to work from home, so I say bring it on.
That is until power goes out and all the food we have ferreted away have spoils...
But I guess it would be fitting to finally get a good SE interior snowstorm, when it's harder to enjoy it.
-
2
-
-
-
 1
1
-
-
For those who imbibe and are interested, Burial Beer in Asheville is now shipping to TN. The shipping cost isn't too bad ($14 for 70 bucks worth, cheaper than gas to drive there for me).
-
Just saw the sun. It still exists.
-
1 hour ago, Calderon said:
Umm, those are smoke plumes from prescribed burns.
Ok, thanks for letting me know. There was definitely some colder air moving in and I had seen something similar over KY Lake so wasn't sure.
-
Some long rolling thunder with these showers as they roll through the plateau this morning.
-
And of course the rain pipeline just won't abate either. Sunshine might at least let us get out in our backyards a bit. Only speaking for myself, it would cheer me up too.
-
Also, check out the lake effect clouds all over the Missouri and Arkansas today:

-
Took a drive to Calf Killer Brewery today over the plateau. Plateau microclimates in full swing. 40 at my place and down to 35 near Crossville. Some graupnel/ flurries early on, but that was about it. Temp shot up to 45 by the time I was off the plateau just east of Sparta.


Obviously there are other ways to support tornado relief, but Calf Killer is currently donating $1 from every pint they sell to it and they make good beer, so if you're into that sort of thing (like me) and you are nearby, give em a try.
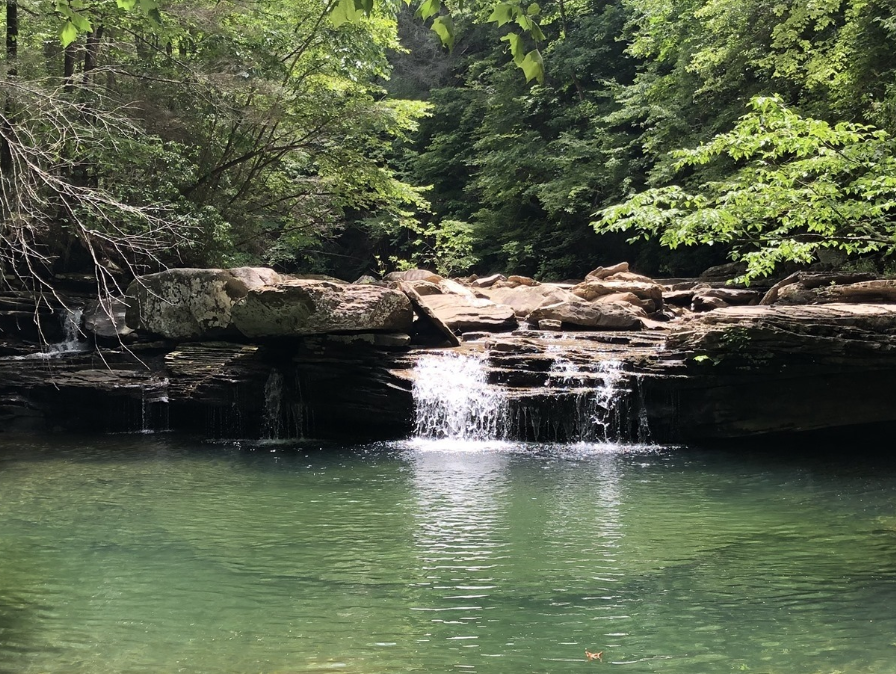
Beautiful view on 70E just above Calf Killer (looking towards Cookeville)

The western plateau reminded me a little of Mesa Verde today.
Near the Obed on Genesis road, I was able to see where the EF0 hit. Pretty much a straight line through and across the Obed gorge as far as I could tell.

-
2
-
-
Morgan county sheriff is reporting that the NWS has confirmed an EF0 in western parts of the county. I'm guessing it was what was left of the same cell when it got here.
-
1
-
-
3 hours ago, John1122 said:
Heading straight for Holston's backyard now.
Yeah I woke up about 2 to some critter scratching in my attic and decided that maybe I should check out the radar. I saw what was going on just east of Nashville and then logged on here and saw what y'all were saying and tried to stay awake until it got closer, but fell asleep until 5 AM. By then the main storm had moved just north of me and the smaller ones were rolling through. Freaked my dogs out pretty good (and me until I saw that the worst on was east of me), but thankfully no major problems in my neighborhood this AM.
-
1
-
-
6 hours ago, PowellVolz said:
Big hail might be legit.
Def. looks like a healthy cell right now in S. Illinois
-
I need to find this. What is it called, lol. Surprised facebook hasn't "recommended" it to me yet.
-
GFS has my happy little storm back:
-
Whutttt? Euro has the weird (well a slightly less weird and warmer version of the) GFS 6z storm. AND no flooding. Feels like winning:
-
This was such a wild look, I thought it was worth being the beginning of a new banter thread for spring
GFS really out did itself at 6z:
Before we've had storms cut from New Orleans to Chicago, it decided to do the opposite this time.
-
Thanks @weathertree4u @nrgjeff and @Windspeed for the thoughts on that guy. I saw that Masiello followed him when he created his account, so thought at that time that maybe he had some good info. I suspected he was trying to sell the low solar = better winters or hurricane seasons, but he was pretty obfuscate about how he did it and I just couldn't make heads or tails of it.
-
2
-
-
2 minutes ago, PowellVolz said:

.Same here, lol.
-
1
-
-
Anyone want to take a stab at deciphering this guy?
-
Overnight Euro OP looks pretty good for y'all in terms of its pattern. As is my custom, here is some random map that I don't quite understand, but since I'm still paying these people for access to their stuff, might as well use it for something.
-
1
-
 1
1
-
-
I don't think it is off topic at all @Save the itchy algae!. Good questions and a fair point. I think it definitely is, as raindancewx states and you suggest, "relative" given the major recent losses in sea ice up there. I had actually not looked at it and just from hearing what people had been saying, assumed the ++++AO and +++EPO had to rebuild quite a bit. However, sho nuff, you're right.
https://nsidc.org/arcticseaicenews/charctic-interactive-sea-ice-graph/
Since it was in banter and raindancewx didn't cite sources, it could be that this article: https://link.springer.com/article/10.1007/s00382-017-3618-9#Sec15 was the one he was using for the claim (conclusions from that study):
The spatial pattern of those CI persistent anomalies that lead the NAO by 1 year is quasi-annular about the Arctic-high latitudes coast, extending over the West Baffin Bay-Davis Strait-Labrador coast and the North-East Okhotsk sea (with positive anomalies leading the NAO positive phase). The maximal phase of this co-variability is triggered when a high pressure anomaly develops 1 year before the NAO+ (low pressure for NAO-) over the Central Arctic extending over North Greenland-Canadian Archipelago-Baffin Bay with centres also over the Laptev Sea and North Barents Sea. This “Arctic bridge” appears as a pre-conditioning feature of the maximal NAO phase, being systematic under transient climates. Its role is linked to cold advection over both: the North-Western Atlantic and North-Western Pacific with evaporative ocean cooling, low pressure formation and persistent latent heat advection over the mid-latitudes land. So a persistent, annular, negative meridional thermal gradient is achieved about the Arctic coast, leading positive vorticity over Central Arctic the following year (when leading NAO+). A mode of CI variability captures this pattern and is leading the NAO index by 1 year, having similar spectral properties to the NAO index. The highest leading correlation of this mode is obtained over ([35°N–90°N]), domain that couples the Arctic with the high-latitudes.
Another thing to consider is that the NAO is measured at sea level, not higher up where we usually want it for blocking and I'm guessing most researchers, even if they like snow like us, have to go by how the measurement is taken to get their results published.
While he may be on shakier ground concerning the sea ice, there has also been talk of the lag after the solar minimum producing an NAO, so I thought I'd look at that too.
Probably the most famous once of these is 2009 - 10:

and here is the solar plot:

That hypothesis also checks out in 1998 or so:
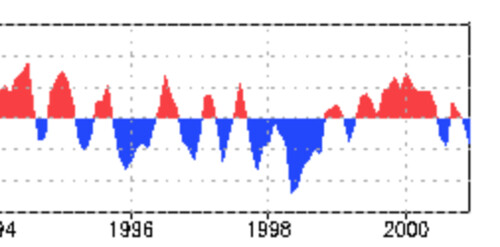

It gets less evident in the late 80s though:


As you go further back there is a correlation again, but that was also with an favorable AMO, so that could have had a say too.
-
2
-
-
You severe folks can correct me, but this looks to me like it has severe potential written all over it:
-
2
-
Tn Valley Severe Weather
in Tennessee Valley
Posted
Thanks Jeff and Calderon for the replies. McMinn, sorry about the outbreak word, I was probably too loose with that as far off as things are now. It is 2020 after all though, so my mind just went to worst case right away, lol.
Yeah, hopefully something kills this threat Sunday AM, no one needs power outages and other major infrastructure problems right now.