
KoalaBeer
-
Posts
606 -
Joined
-
Last visited
Content Type
Profiles
Blogs
Forums
American Weather
Media Demo
Store
Gallery
Posts posted by KoalaBeer
-
-
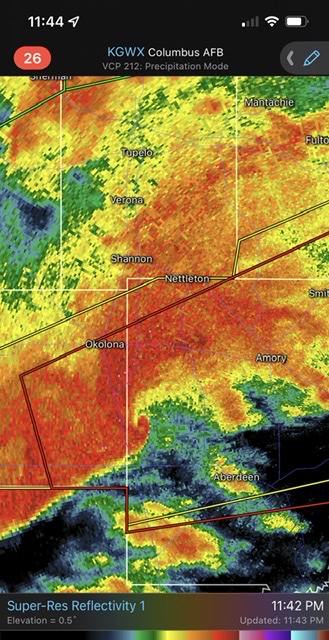
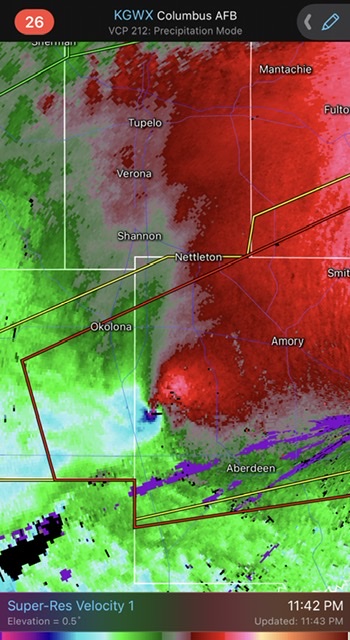
Man hopefully it avoids Smithville, don’t need to relive that horror. Terrible situation unfolding, maybe it just barely went north of Amory? Looking at google maps it looks less developed on the north side of town.
-
Holy crap that wrapped up again really quick just now.
-
1 minute ago, andyhb said:
Large wedge tornado in progress near Rolling Fork, MS.
Reed has it.
-
4 hours ago, WinterWolf said:
It’s gotten worse, and the others have improved too. It’s erratic now, and jumpy. Not as good as it was.
Everyone shitting on the Euro but I’ve yet to see any data to back up it’s so called donkey ballz performance. Not saying that I have it…I’ve looked but model verification is hard to come by. Seems like there might be a little selective memory/recency bias when evaluating the models. Humans are inherently bad at correctly noting stuff like this IMO and it’s tough to trust what people ‘feel’ like they are seeing with the models without data to confirm it.
To stay on topic somewhat more, glad we have a little something to track over the next week and tomorrow’s severe wx could be pretty nasty in the southeast. New MD graphics from SPC are clean.
-
13 minutes ago, MegaMike said:
People trash a model if snowfall doesn't produce in their back yard. If someone says 'x' model sucks, I want them to cite an evaluation (post-hoc or operational) of meteorological forcing fields related to heat and moisture both at the surface and aloft. Those fields contributes significantly to the accuracy of NWP... Not snowfall at one location (which is typically calculated from a private website, excluding a couple NWP models).
If someone were to run an evaluation of this event, you'll likely find that temperature performed well (sfc + aloft), moisture performed okay (Td or specific humidity at the sfc and aloft), and wind speed performed okay (directional and magnitudinal at the sfc and aloft - worse as you approach the surface). All NWP models struggle with QPF (for a number of reasons) so it's not solely used to determine a model's overall performance. Through my experience, it usually performs reasonable as a bulk statistic.
IMO, ensembles should always be used for QPF forecasting. Diagnostic models should be used to determine trends.
Thanks for this post. It definitely irks me when people trash a model without data to back it up. Admittedly I wish that data was easier to find…I’ve had this bookmarked for a while, and I think CSU used to have a good page… https://www.wpc.ncep.noaa.gov/html/modeldiag.html#verification
Seems like it didn’t matter how many times with this event pro mets told everyone to toss the clown maps in the trash, people were still treating them like the gospel.
-
 1
1
-
-
Bold call by BOX but I can see it happening.
-
6 minutes ago, MuddyWx said:
yea it's been wrong. every run after that was also snowier around boston. never sniffed out the patchy precip and extent of the dryslot.
6 minutes ago, BombsAway1288 said:It was mostly right that run but that’s because it showed a low amount of snow EMA.
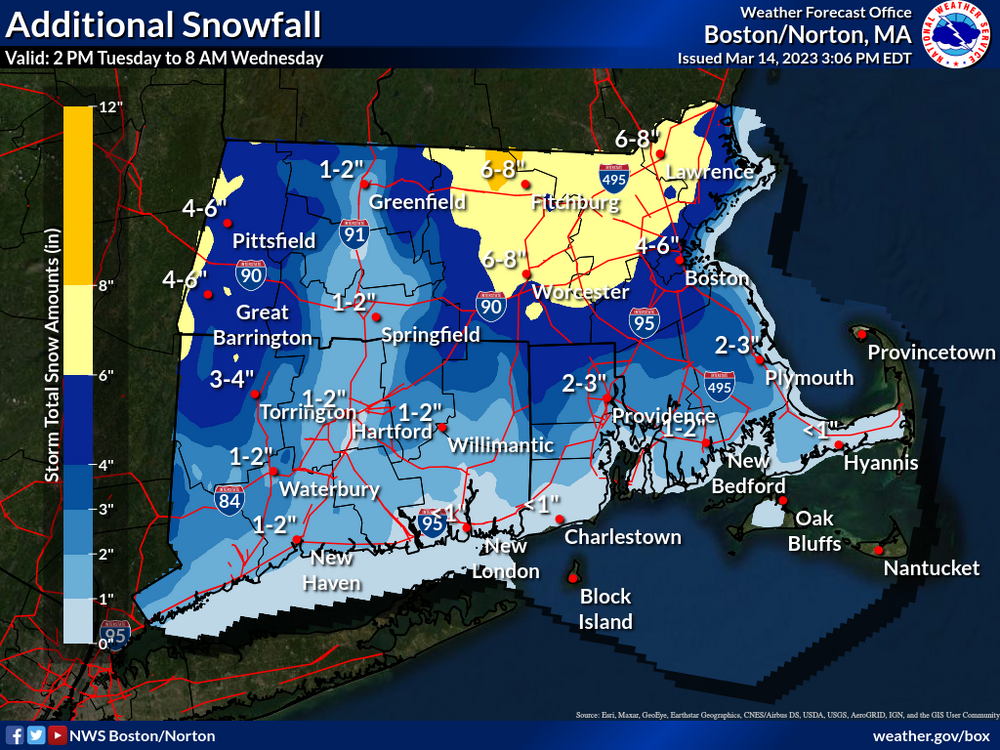
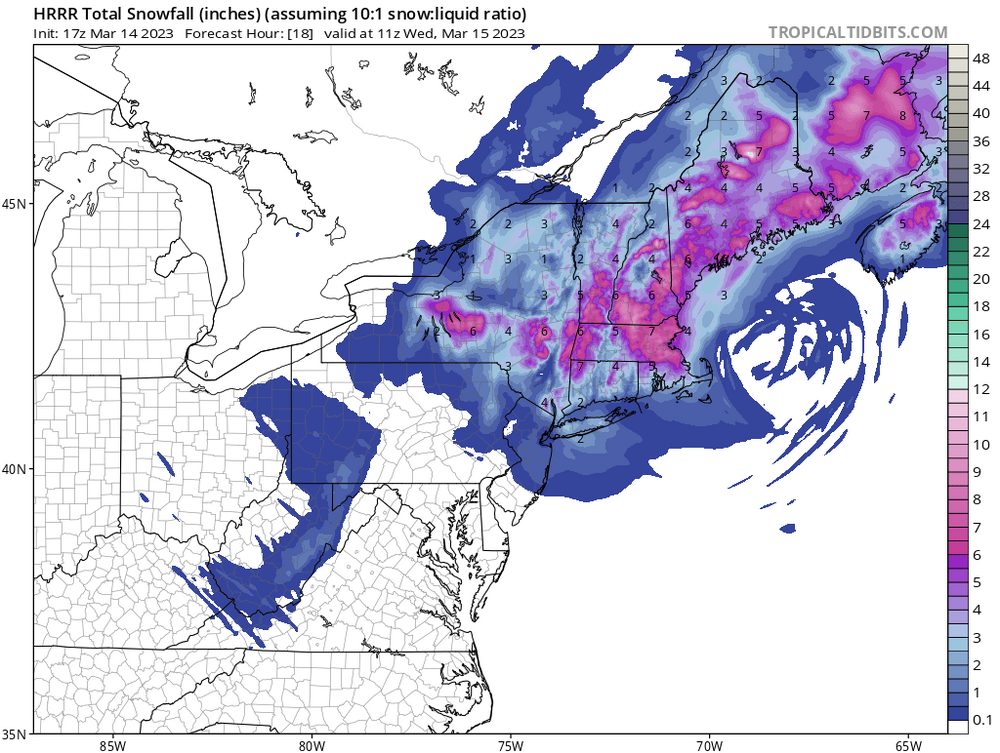
You know damn well now that it shows 6”+ over the same area it will be wrong. Winter 22-2315z and 16z images below for 21z show 2-3” max - again with 10:1 ratios and temps around 34/35, it was obvious to toss the clown map.
Sucks you guys are getting screwed down there but listen to the pros. BOX put out 4-6 this morning and I expect that to verify most likely on the low end.

-
12 minutes ago, Ed, snow and hurricane fan said:
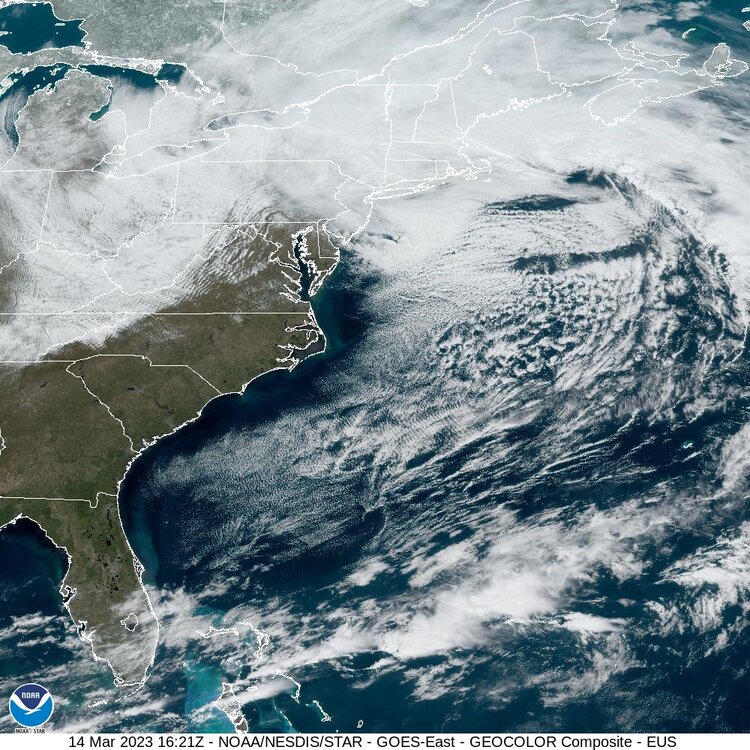
I want to see if eye like feature heading NW towards Central Maine actually turns SW as depicted. https://weather.cod.edu/satrad/?parms=regional-northeast-02-24-1-50-1&checked=map&colorbar=undefined
Buoy watching.
-
1
-
-
12 minutes ago, MuddyWx said:
it's been wrong all day in this area :/
Has it really been that bad though? Honestly I haven’t paid a ton of attention but this is the 12z run from this morning valid 21z today showing 1-2 inches max for Boston at 10:1 which we knew to toss those ratios anyways…
-
6 minutes ago, weathafella said:
Over/under on BOS getting measurable?
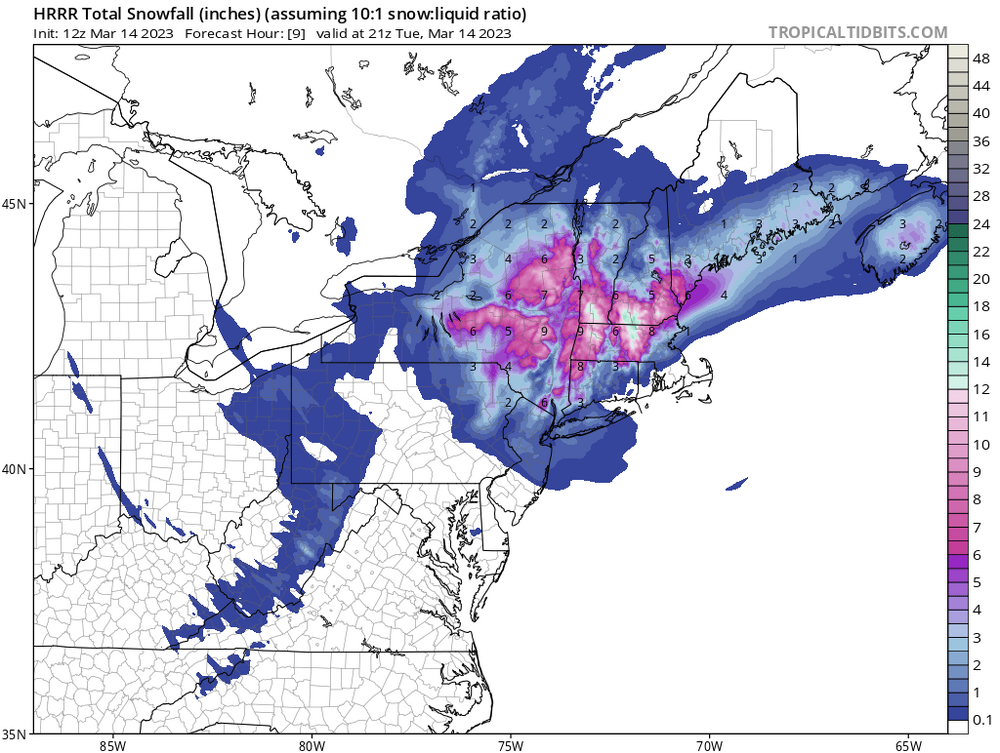
HRRR gets going down there for a while later today through this evening. Willing to bet they get 4-6.
-
2
-
-
7 minutes ago, Ed, snow and hurricane fan said:
You going to the beach this afternoon for surf pictures? High tide soon.
Unfortunately I don’t think I’ll make it. My sister had a kid last night and I’m watching her dog for a few days. My dogs not so happy with the visitor so I have my hands full.
-
1
-
-
2-3”hr type stuff in Hampton, NH. Whether it starts stacking up that quick is a different story.
-
6
-
-
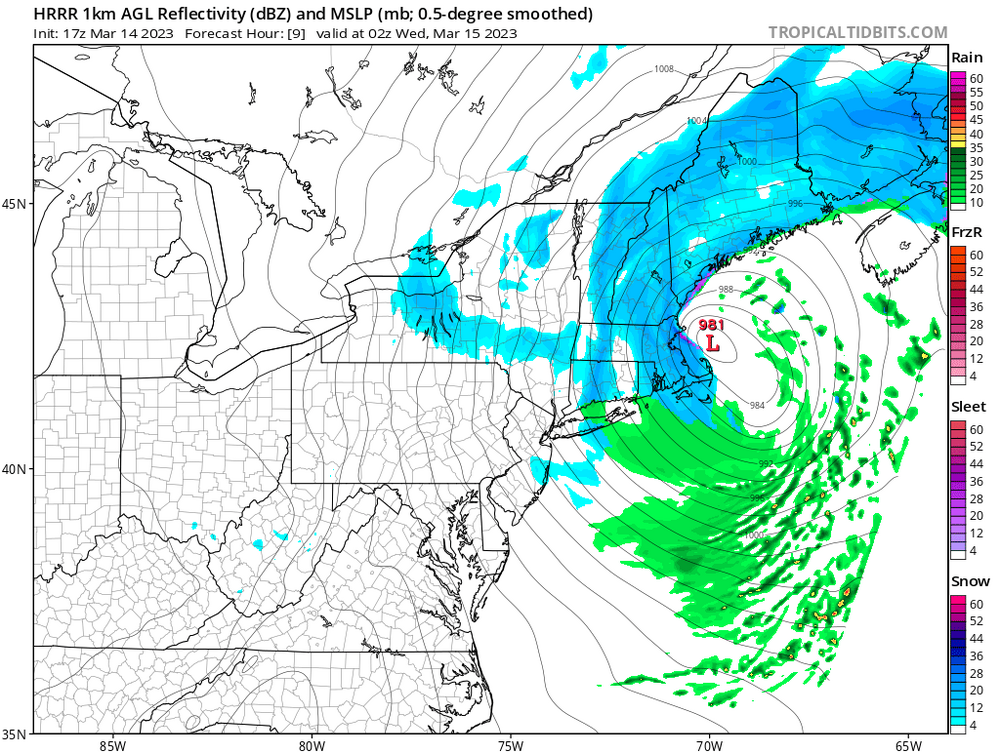
Pounding here on the seacoast of NH. Vis satellite is impressive as the capture has commenced. Almost looks like a sting jet type feature on the southern flank.
-
4
-
-
-
10 minutes ago, Ed, snow and hurricane fan said:
Small font I can't read well reply... >40 year old ties to NYC and New England subforums. There is no place outside the desert with less interesting weather than Houston. Unless floods and droughts are the thing. Although Euro is dropping a trace of snow in part of the HGX CWA next Monday... If we could get more snow at IAH than @MJO812gets at Central Park that would rock.
Thanks that certainly clears things up…
Anyways would love to hear some mets take on that BOX map. Can’t imagine that holds especially if we are putting some more weight towards the EPS. What a nightmare forecast scenario.
-
1
-
-
5 minutes ago, monadnocks said:

That was issued at 4am. Curious to see what there afternoon update is. I have low expectations here in Hampton NH but at least the waves and wind should rip.
-
 1
1
-
-
10 minutes ago, Ed, snow and hurricane fan said:
My Mom was Class of '52 at North Quincy High School, maybe 10 miles from BOS. I see 12.4" at 10:1 on Euro there, which is more likely half that, or 6 inches of slop, which might not normally cancel school, but w/ unused budgeted snow days. I just wonder how the Euro has heavy snow in BOS with the low well NW of there. OT- it was at a Texas Tech at UT game in 1993 I found out N. Quincy was the Red Raiders, like Tech is. I never figured that out in the total of many months I was visiting her house at 18 Hunt Street.
Feel terrible for school kids of St. Martin of Tours in Amityville.
With all due respect what the hell are you talking about with this St Martin of Tours you keep mentioning?
On another note I have no idea what to make of that BOX map. Curious to see what GYX update looks like.
-
 2
2
-
-
15 minutes ago, BombsAway1288 said:
Looks like somebody went waaaay over their head last night with definite statements like “severe storm” and “big one” for EMass. Not even close lol
Kind of like you making a definitive statement that the possibility of that outcome is “not even close” when it’s still clearly on the table?
On a different note that precip onset time is one of the grossest things I’ve seen put out by a WFO. Has to be computer generated.
-
4 minutes ago, STILL N OF PIKE said:
They are obviously very gun shy with the idea of a a Strong CCB thru 8pm Thursday .
one of the more consistent features (if there has been one ) is the N stream heavy precip over Catskills and Berks and to a lesser degree the monads and they are keying in on that .
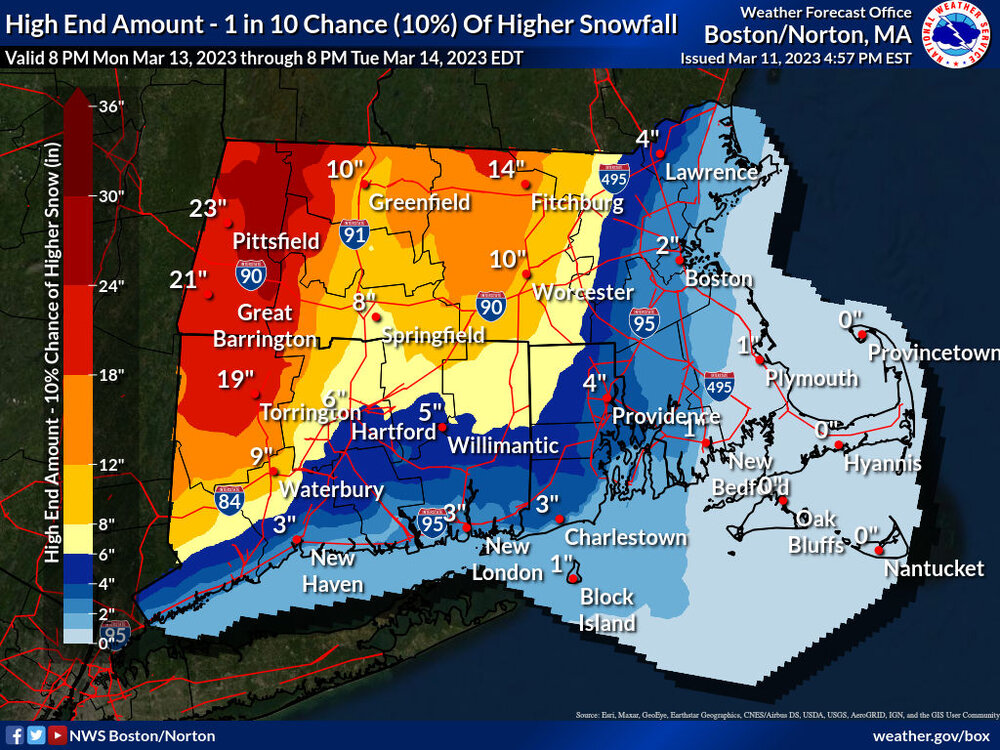
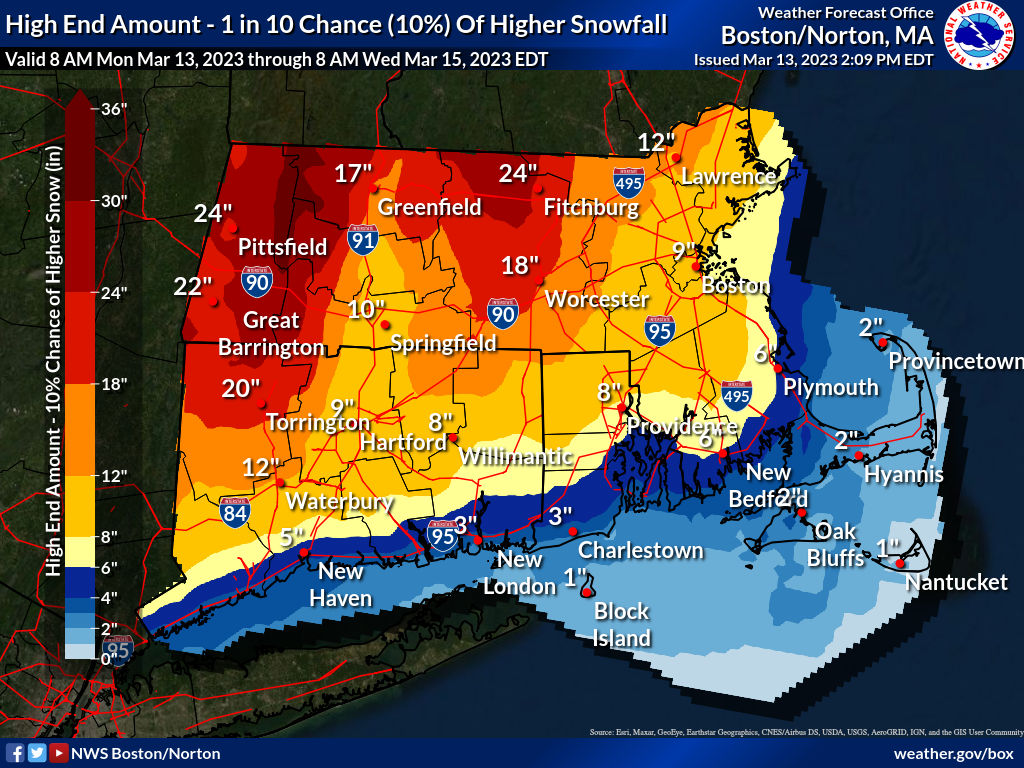
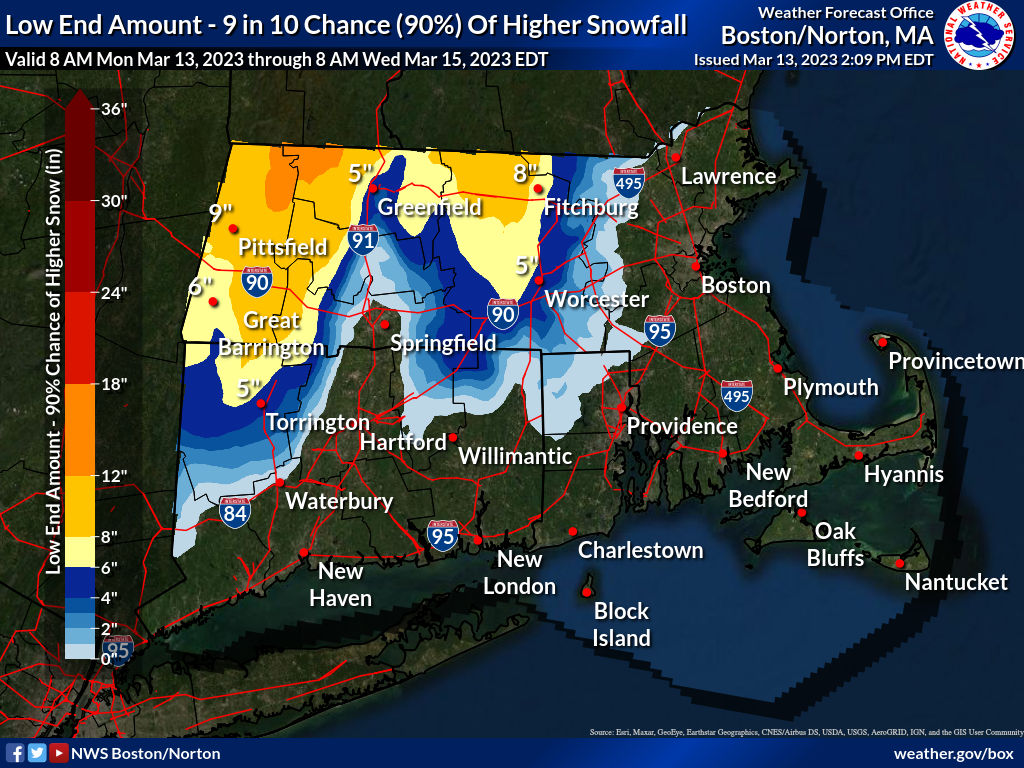
Also they probably have a good bit of continuity in their forecast and I think they would probably up elevations in NE CT and I would guess that if the CCB works out you can tack on 6-9” to that map? Where that hits
Id like to see their 10% or maximum map to see their confidence level which I assume is low
-
1
-
-
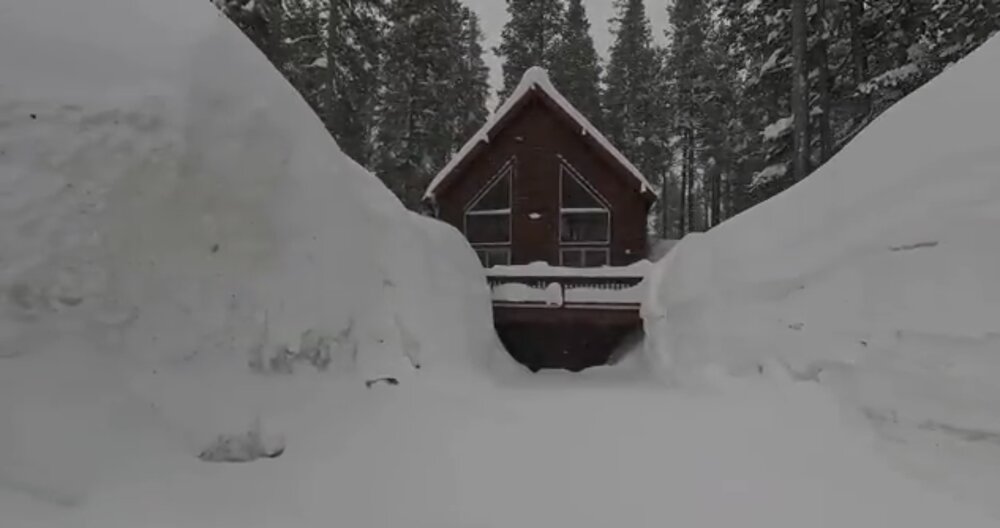
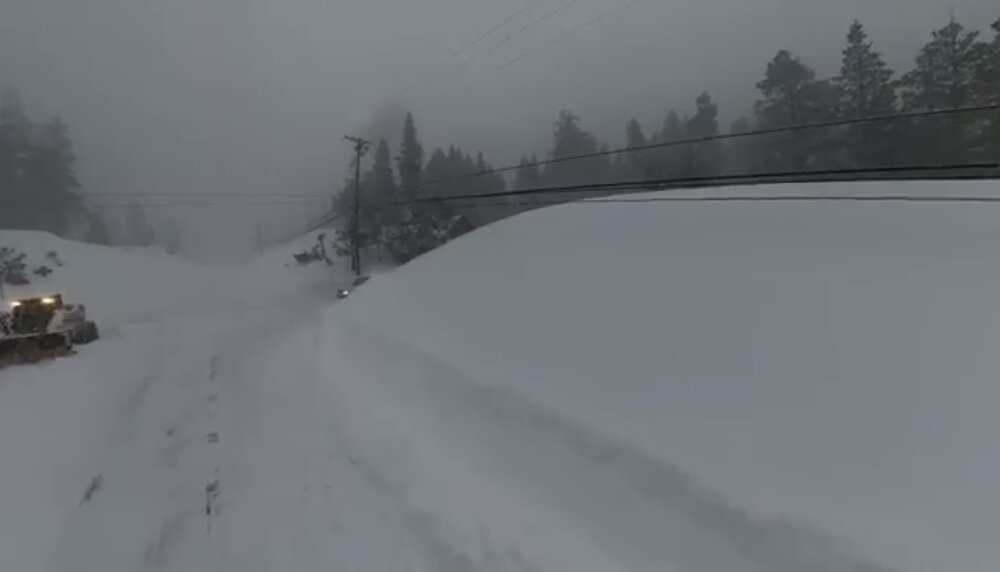
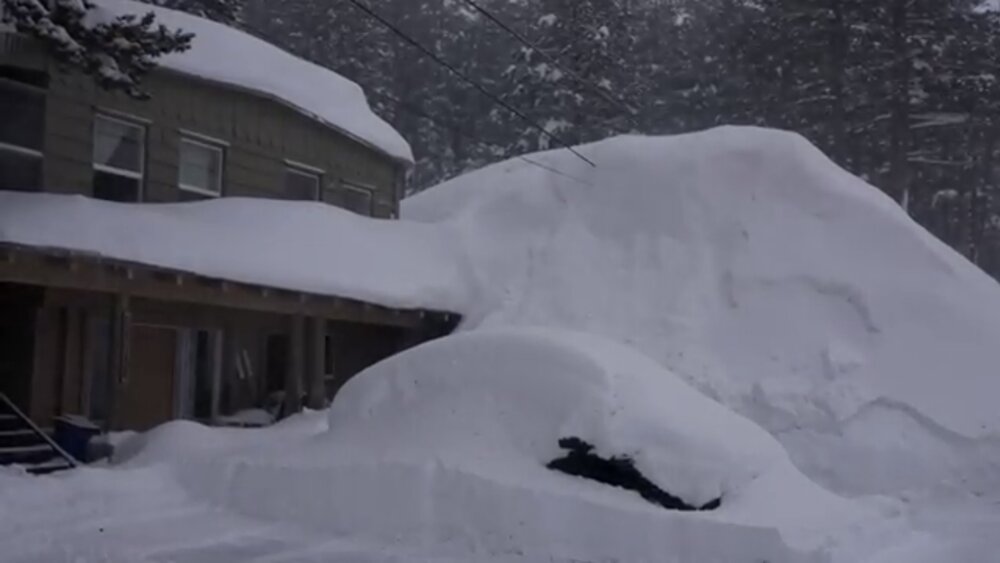
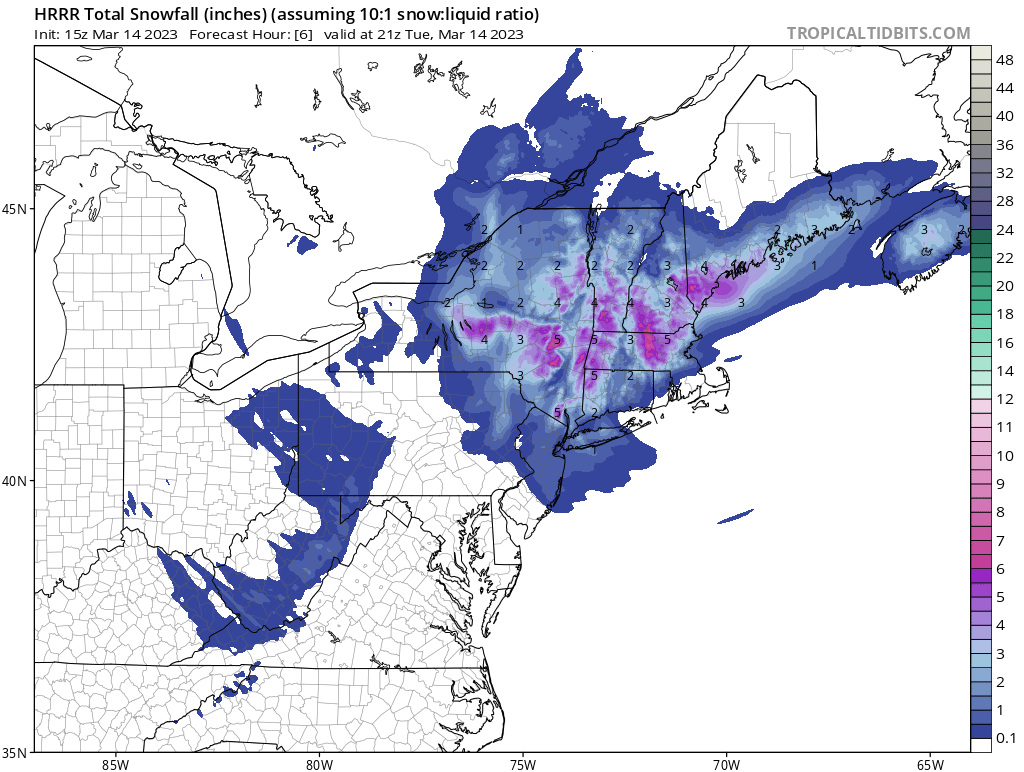
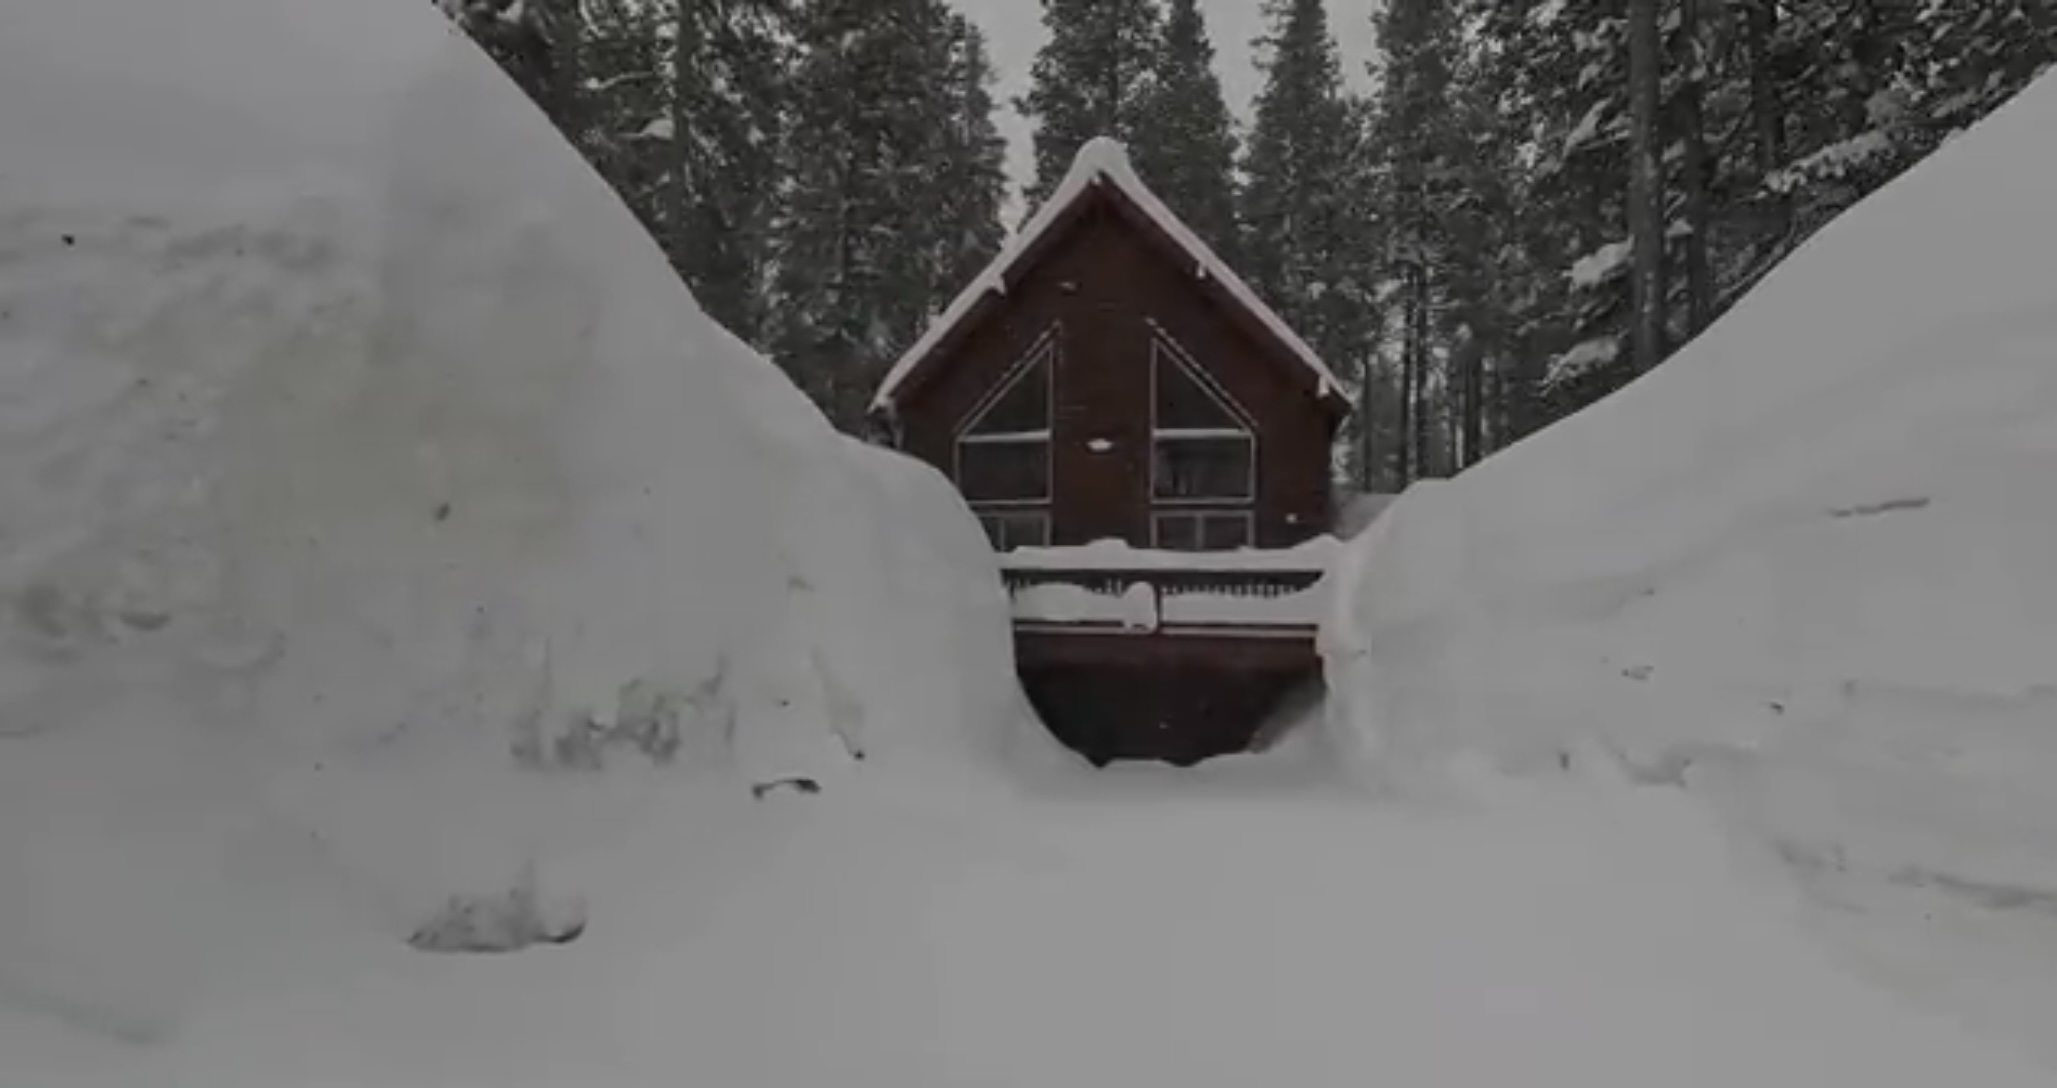
1 hour ago, ORH_wxman said:
539" at 8k Alpine Meadows in Tahoe. 92" in the last 3 days there.
Just watched this video. Never seen anything like it outside of Japan. Power lines are getting buried at this point.
-
1
-
-
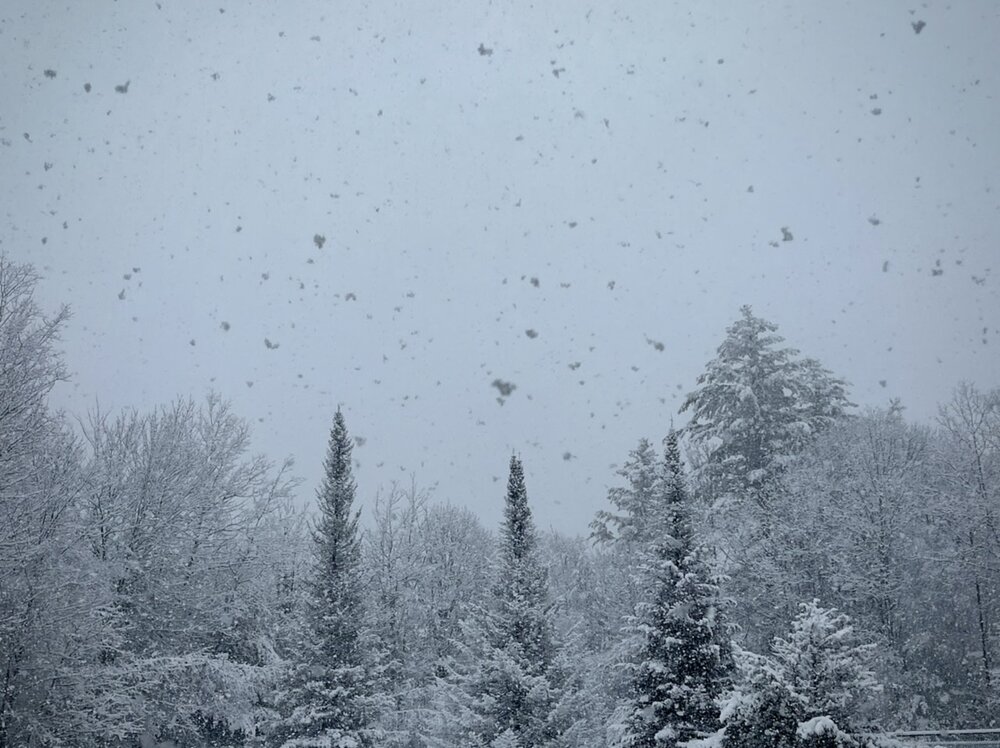
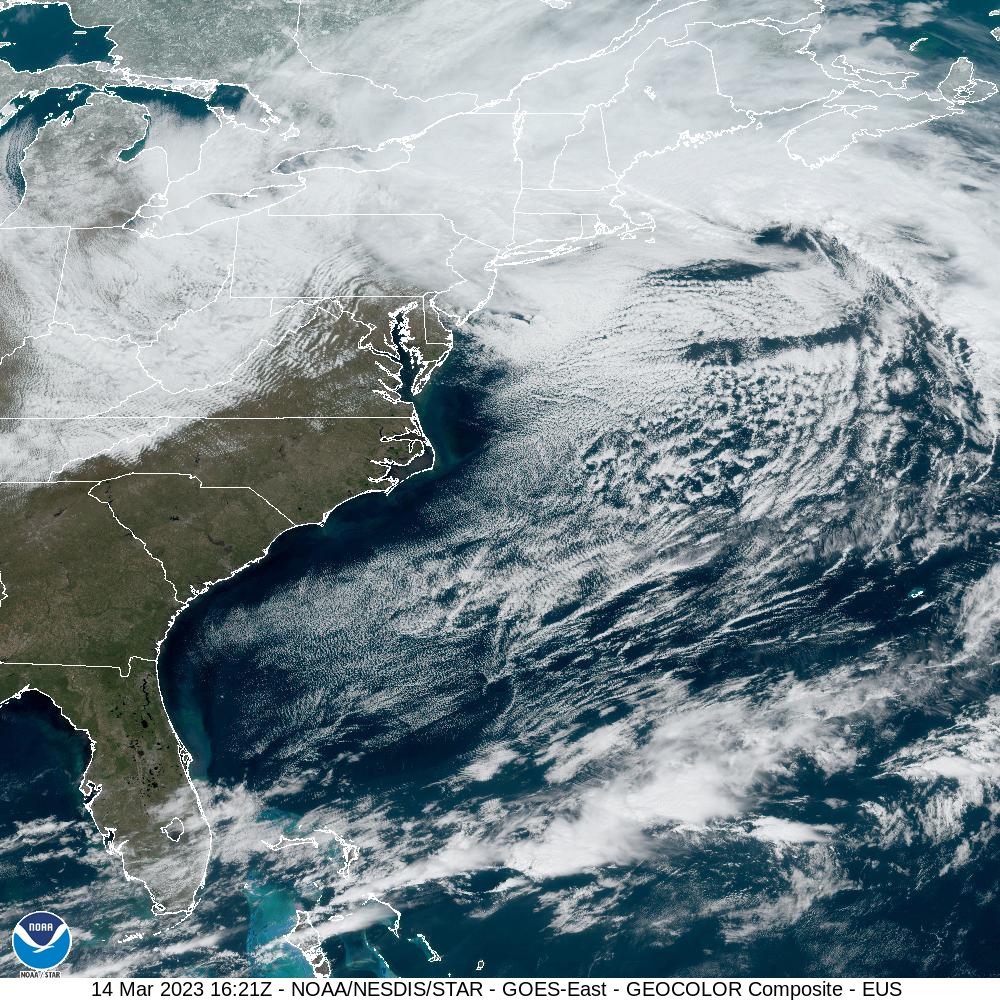
16 minutes ago, CoastalWx said:
That area by Conway getting smoked.
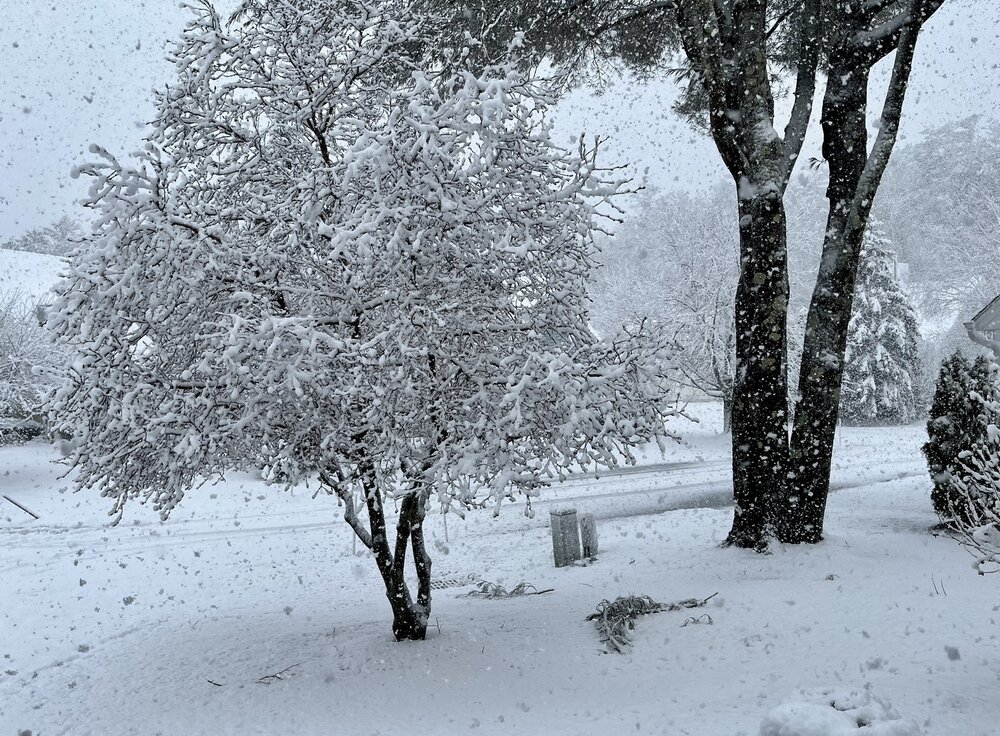
Yup, heavy snow here in Conway. Huge flakes. Next week on the slopes will be great. Can’t wait to get a few days off to get out.
-
6
-
-
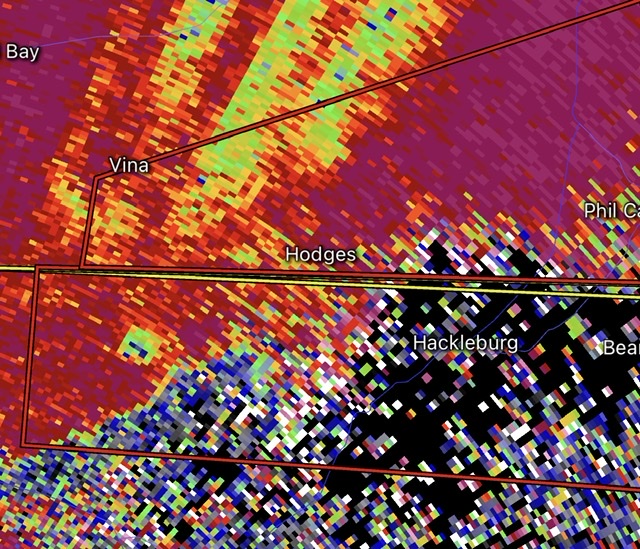
11 minutes ago, Wmsptwx said:
Sooo no Huntsville tornado talk
CC drop west of Hackelburg as well.
-
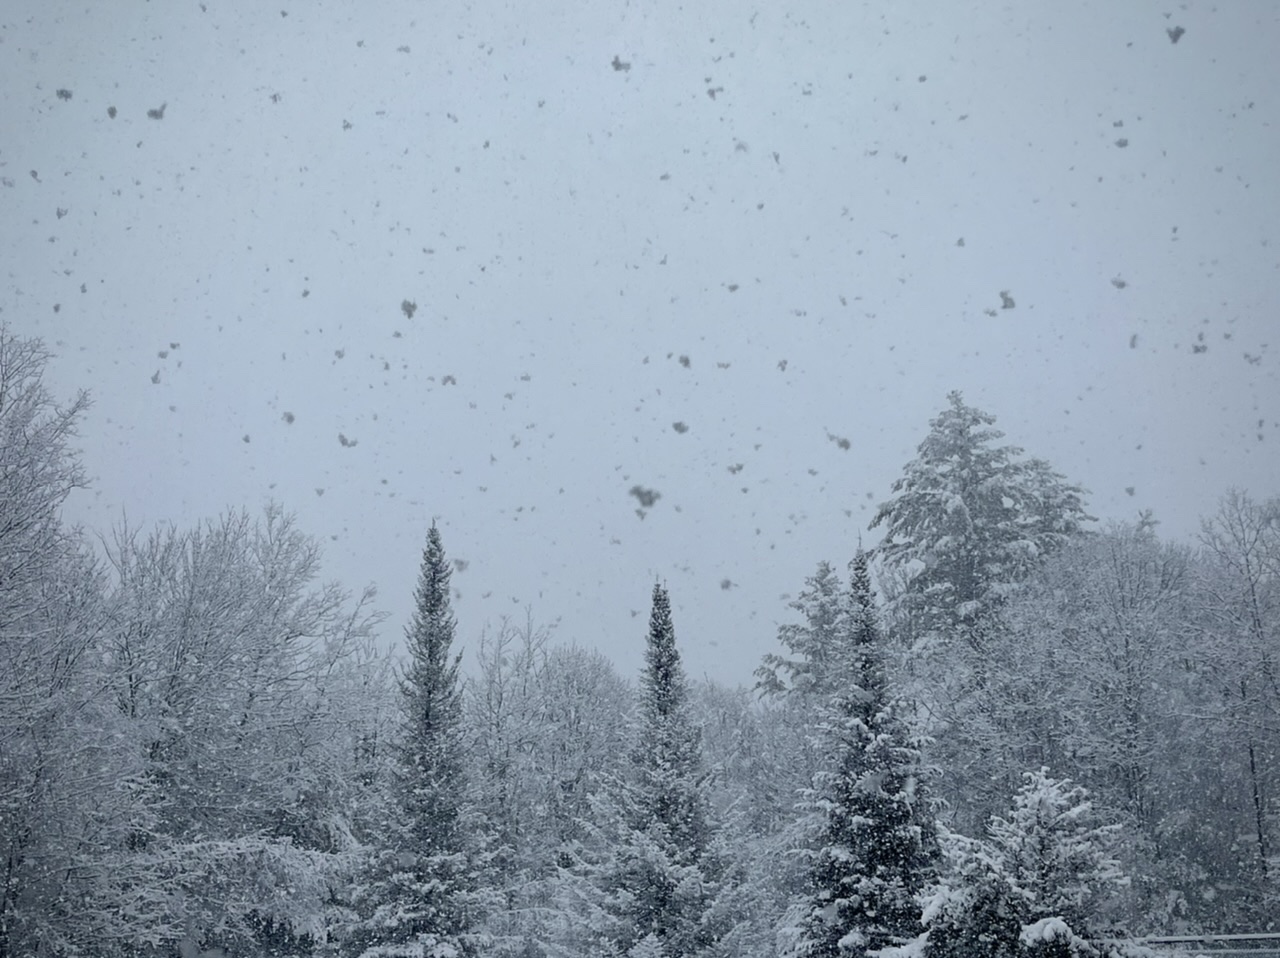
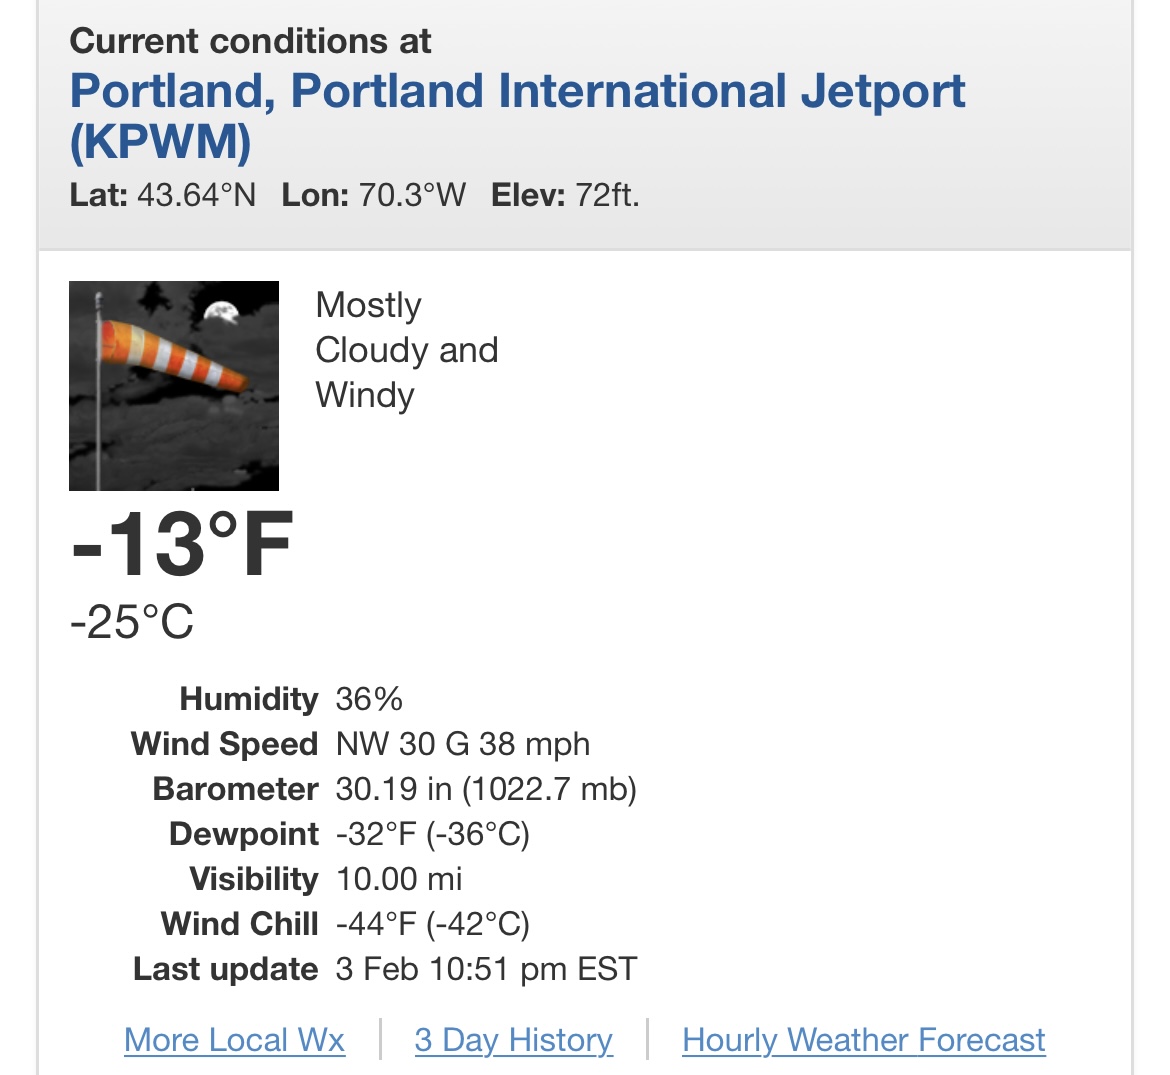
Haven’t posted in a while, hope everyone is staying safe. Up in North Conway for a week of snowboarding, currently -16 with winds still cranking.
Looks like Portland just broke there all time wind chill record for what it’s worth. From the GYX discussion earlier..
After sifting through
our old paper book records, a -43 degree wind chill from 1971
appears to be the record to beat in Portland, at least since
1948.

-
1
-
-
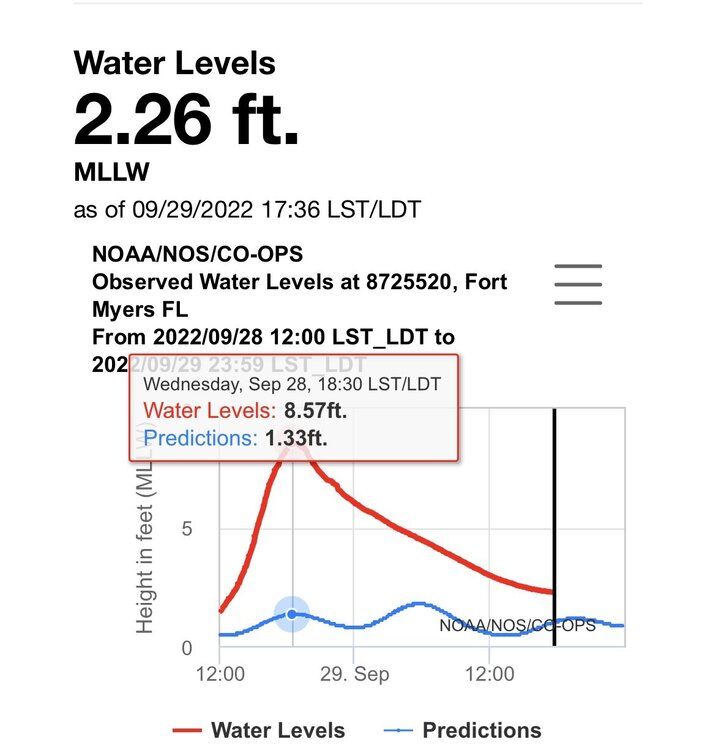
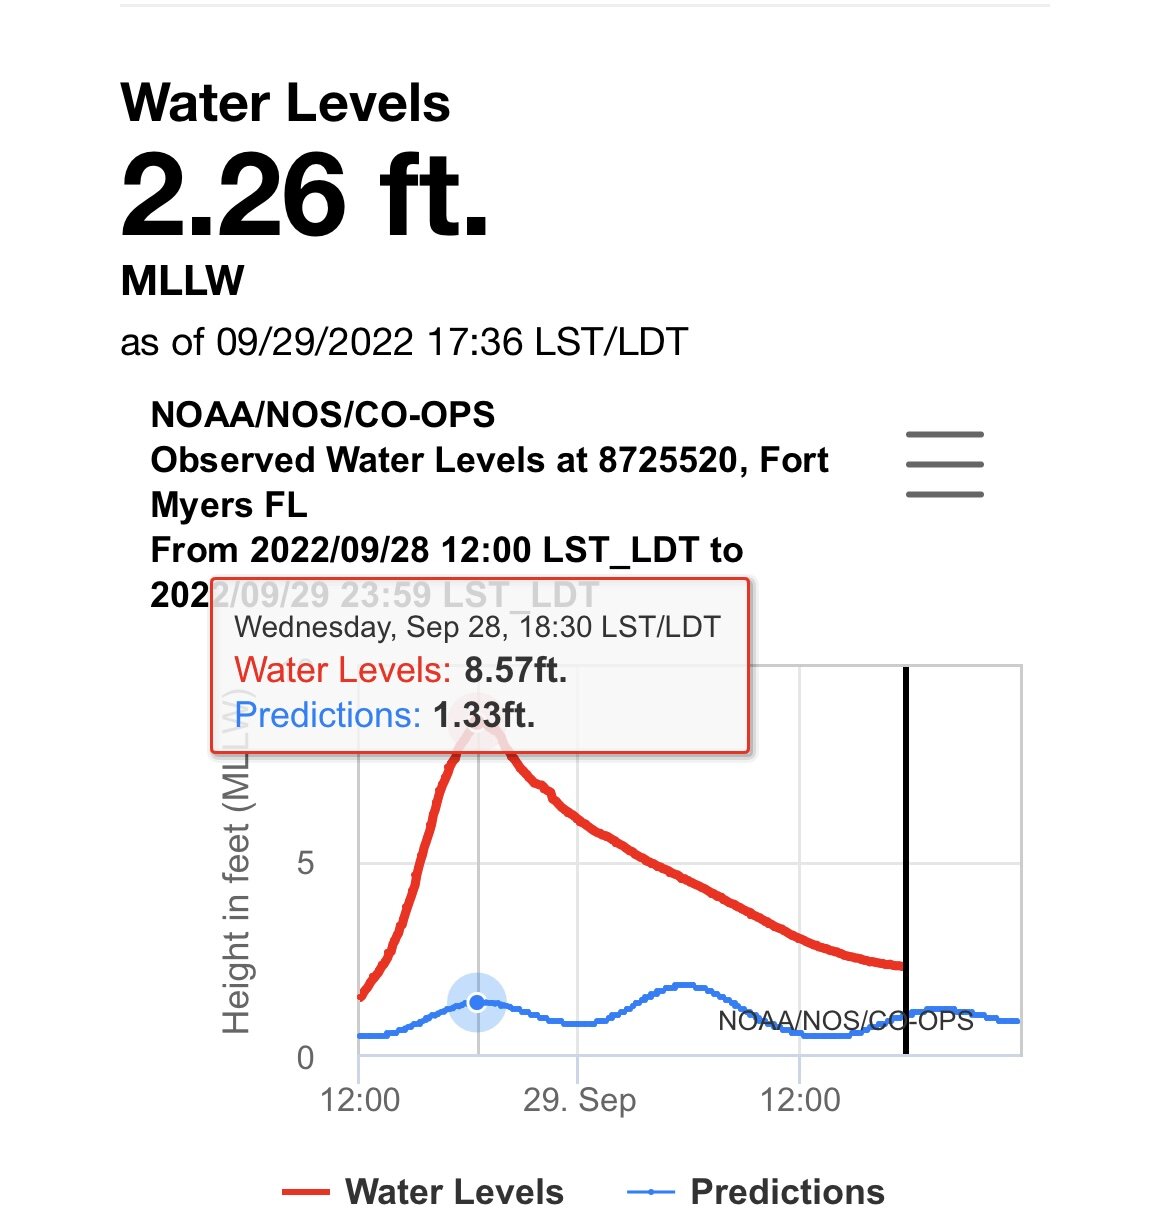
2 hours ago, dryslot said:
From what i saw this morning Ian was #1 on surge and second wasn't even close, I might be off a bit on this but i think 3.4' was the highest until Ian at 7.6' or so.
Ya Ian more then doubled it. Think I saw it get to 7.84 at one point. That gauge is up the river some ways as well. Wouldn’t be surprised if the surge was quite a bit higher right on Fort Meyers beach looking at the damage.
Its early but dare I say this might become the third costliest hurricane in US history behind Katrina and Harvey once all is said and done?
Such a sad situation. I love experiencing some extreme weather but man is it nice living in New England where we are pretty immune to catastrophic events…
edit: looks like 8.57 was the unofficial peak
-
2
-


March 2023 Obs/Disco
in New England
Posted
Absolutely terrible situation unfolding in MS tonight. Smithville about to get clobbered, they got hit by an EF-5 in the 2011 outbreak.