

MountainGeek
-
Posts
518 -
Joined
-
Last visited
Content Type
Profiles
Blogs
Forums
American Weather
Media Demo
Store
Gallery
Posts posted by MountainGeek
-
-
2 minutes ago, EastCoast NPZ said:
Light rain. 36F. Lol
Should switch over for you soon -- are you at -500ft elevation inside the active volcano?
-
 1
1
-
-
Nevermind - now mod snow, but mostly still tiny flakes
-
 1
1
-
-
34/32 light snow
-
This low level inversion is legit -- still hanging at 35/32 at 810ft, half a mile away 500' lower on the river is 32. On up the top ridge it's 38 at 1600ft.
-
1 minute ago, mitchnick said:
Nam has the low and precip at 39hrs vs nothing at 45 on 12z
On schedule for tomorrow's full NAMing
-
1
-
 2
2
-
-
2 minutes ago, clskinsfan said:
They are pretty bullish for us. Must be disregarding the drier Euro solution.
18Z HRRR tracks the low through the Shenandoah Valley into central MD. Glad that model is utter garbage.
")

It's fine -- HRRR isn't in range until 47hrs
-
22 minutes ago, clskinsfan said:
Yall to the east have some nice snow cells heading your way. Pouring dime sized perfect flakes out here. Enjoy!
Solid coating here already, will easily get to 1/2" soon - snow on snow FTW!
-
2
-
-
2 minutes ago, stormtracker said:
Relative to the other models, it's ugly. I'm not counting Willy Wonka time frames. Comparing to others regarding our two chances.
-
5 minutes ago, psuhoffman said:
It was even worse for my area and Baltimore. We didn’t even get close. The last year most of our area actually hit snow climo was 2016! We’ve had some years since where’s a localized area within our sub got lucky with one storm and got close.
Didn't you calculate at some point how much snow we'd need to get just to break even on keeping climo from declining over the 20-year average? I think the N/W areas probably need something like 150" this year just to get back to even.....
-
1/2" here -- hoping we can break 1"
-
1
-
-
Same - snow has begun here. 26/14
-
11 minutes ago, Terpeast said:
For the first time today, precip has stopped. If @clskinsfan is still seeing pixie dust, it may start again soon here too
Yup it's still dusting here -- you should get it soon!
-
Yup can confirm it's legit - mod snow with decent flake size
-
4
-
-
5 minutes ago, J.Mike said:
Question: I've seen at least two references to dry slot. Where/when does this happen? Thx.
https://lukemweather.blogspot.com/2011/02/dry-slot-blizzard-killer.html
https://www.theweatherprediction.com/weatherpapers/108/index.html
-
1
-
 1
1
-
-
3 minutes ago, psuhoffman said:
You might be seeing the giant tomato worms because of the wrong drugs
I think we've gone from the Sistine Chapel pattern to the Tomato Hornworm Pattern
-
 1
1
-
-
5 minutes ago, psuhoffman said:
Is it a good sign when our February 2024 pattern discussion is mostly about tropical, winter 2026, maple sugaring and ski conditions in northern new england?
I suppose it is better than drugs and giant tomato worms.....
-
1
-
-
31 minutes ago, clskinsfan said:
This bad boy has the classic region wide 4-6 with 8 inch lolli's written all over it. Old school snowstorm coming.
Don't stop drinking until Sat AM.....
-
5
-
-
5 minutes ago, stormtracker said:
Let's get on with that NAM show
Per PSU, in these setups we get to double the NAM QPF output whatever it shows.....
-
13 minutes ago, Scraff said:
Every storm this year has had a bit more juice as we closed in on game time. Shouldn’t be any different here. My bar is 4-5 for the Hoco crew.
")
Atmospheric juice is at all-time highs -- we got lots of icy purple clouds everywhere to prove it.
-
2
-
-
40 minutes ago, clskinsfan said:
That is unbelievable. I am like 10 miles NW of you have double that amount so far this winter. You shouldnt have moved back
This one was a bit crazy -- I'm between Round Hill and Charles Town, but ended up with 3.7" --- being on the mountain with a little over 800' elevation made a huge difference.
-
34 minutes ago, stormtracker said:
I've been looking for that one too...and there's a parody of DT's maps I made too.
-
8
-
-
2 minutes ago, stormtracker said:
Ha..one of my better creations. I've been looking for that
Wasn't easy to find, that's for sure -- second IMO only to your video of the Hitler rant about no snow.
-
2
-
1
-
2
-
-
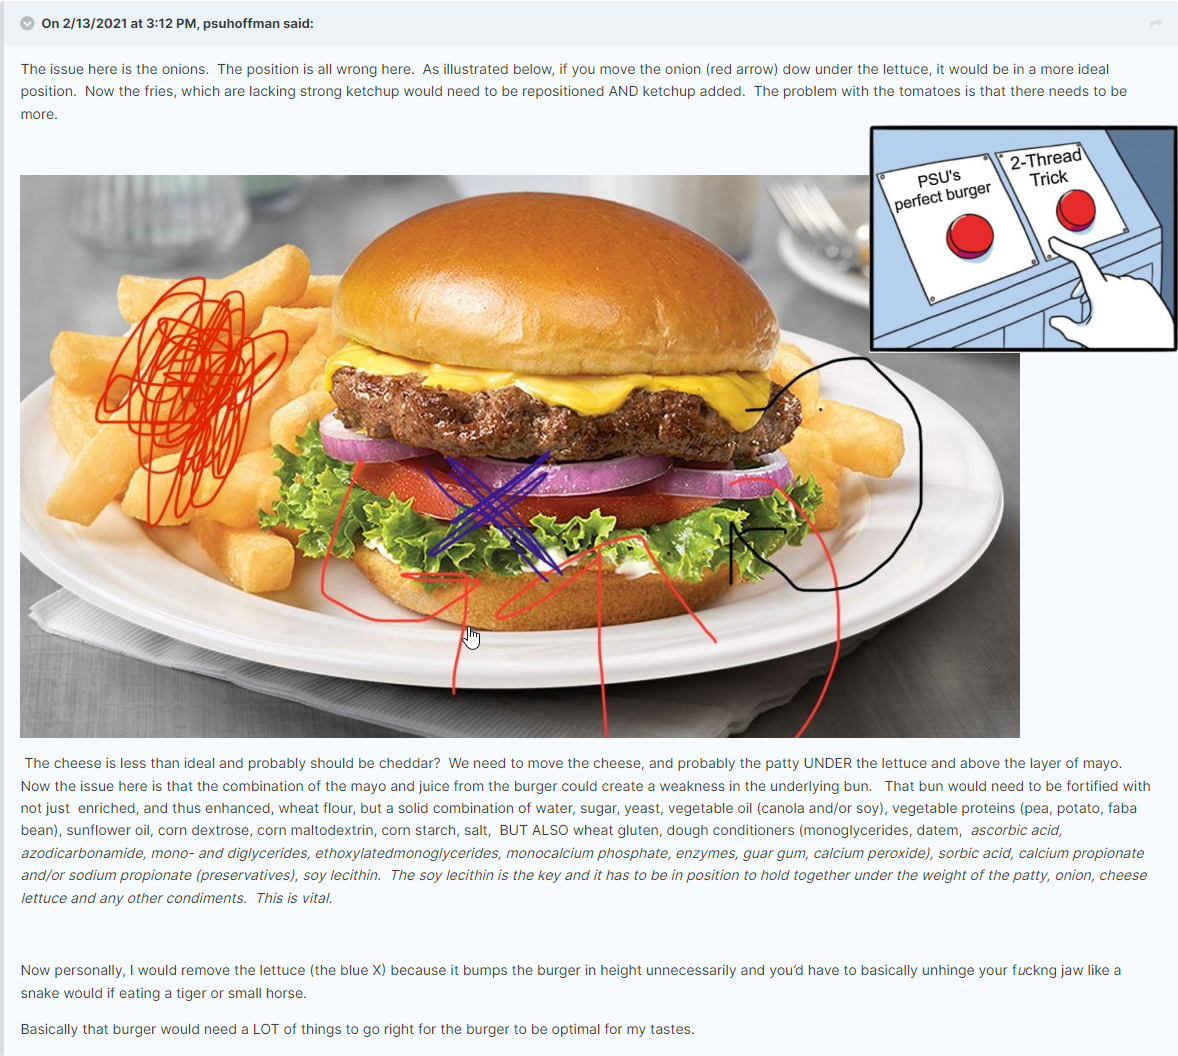
25 minutes ago, psuhoffman said:
What if we cracked the code!
So we've been reading your dissertations and chasing the perfect burger all this time, and you're telling us all we had to do was just start a second thread?

-
13
-
-
31 minutes ago, MacChump said:
Look, we know it isn't going to snow this weekend...
Euro, GFS, NAM, whatever...
The model doesn't matter...
Some think one is better than the other
Go look at the HRRRRRRRR they say...
On the ICON there's some blue they say...
But let's be honest...
In reality, they all suck...
Really, really suck...
Doesn't matter what model you look at...
Snow isn't happening this weekend
How much for Philly? NOTHING!

-
2
-
1/19 - The Roulette Wheel 29 Black Storm - OBS
in Mid Atlantic
Posted
Larger flakes starting to mix in 33/32