raindancewx
-
Posts
3,944 -
Joined
-
Last visited
Content Type
Profiles
Blogs
Forums
American Weather
Media Demo
Store
Gallery
Everything posted by raindancewx
-
Pretty sure it will be warm in Louisiana for the winter, but a lot cooler than last winter. None of that +6F to +8F garbage like last year. Maybe +1 to +3F? I have to re-do my simulations with the heavy rain we've gotten in TX/NM lately. The soil moisture does seem to impact the placement of the highs some. I think effectively there is something of a wake in zone where the sub tropical high will be because of Harvey, Irma, Jose, Katia, and Maria beating the day lights out of it and upwelling some colder ocean temperatures. My area is colder (not actually, you know cold) in La Nina winters that follow relatively long duration periods of heat. We've had (at least) 96 days 87F or higher, that tends to lead to near normal temperatures here. My area is colder (not actually cold) in La Nina winters when the Atlantic is cooler. My area also has exceptionally variable winters near the solar minimum - record heat / record cold are all near the minimum. Barring a complete bust over the next two days for highs, these years were the objective analogs that popped up for winter based on my Summer conditions - its heavily weighted to temps and preicp with low weight to ENSO. This is one method I use to look at winter - I'll give it some weight, but it isn't my forecast. The big big wild card for the winter especially late is if Mount Agung or one of these other suddenly active Ring of Fire volcanoes is going to erupt in a big way soon enough to screw up the Earth's heat intake.
-
I've had at least 0.64" rain today, one of the biggest precipitation days of the year here. Basically 48-50F from 6 pm to 9 pm with steady rain. Feels great actually. I had a wet September in my Summer outlook (from mid-May). Looks pretty good now if the NAM is right about the city getting another 0.6"-1.2" rain by Sept 30. I think I had 1.25", and we're at 0.74" right now. The link has the newest NAM outlook through 9/30/17. https://pbs.twimg.com/media/DKx3ktNU8AE9-V2.jpg:large Will be issuing my winter outlook (snow and DJF temps) sometime between Oct 7 - 15. I'll link it on here if anyone is curious.
-
1938-39 was cold in TX (La Nina), same for 1983-84, and 1984-85, 2000-01 1974-75 wasn't bad 1988-89 wasn't bad 2010-11 wasn't bad Some of the near La Ninas (cold-Neutrals) seem pretty cold in TX actually (1932, 1937, 1944, 1947, 1948, 1962, 1967, 1985, 1996, 2012, 2013)
-
WPC on board too
-
What kind of recovery would see in the ice if Agung erupts at a similar magnitude to 1963? It was a VEI 5 eruption at around 8 degrees away from the equator. I know my coldest winter in 120+ years was 1963-64. Lots of evacuations in Bali right now.
-
Am I crazy for thinking we might be entering a Dustbowl redux? Last winter (2016-17) was very similar to 1931-32 by temperature anomalies nationally. This (2017) Hurricane season is the only one since 1850, other than 1932 - to have a category four hurricane hit Florida, Texas and Puerto Rico in the same season. The PDO, Nino 3.4 (raw) temperatures, AMO (raw) temperatures, and solar activity are all almost identical to 1932 right now. To me, the Dustbowl started after how dry / warm the 1932-33 winter was for much of the Midwest. PDO: Aug 1932: -0.1. Aug 2017: +0.1 AMO: Aug 1932: 23.51C, Aug 2017: 23.66C Sunspots July-June: 1932-33: 14.5 July-June 2017-18: 18.0? Other: Both years two years after Super (Modoki) El Ninos: 1930/2015 Look at how close Nino 3.4 is for August 2017 & August 1932 too - https://pbs.twimg.com/media/DKS8WhyVAAAb3KN.jpg:large
-
Seems like in addition to the snow on the highest peaks, Eastern New Mexico will be dealing with severe weather and a big rain event later in the week. I'm expecting around 0.3" here by next week.
-
As mentioned earlier in this topic, its interesting seeing the ice extent coming back a bit with the AMO dropping a lot from last year. Came in at 0.314 in Sept 2017, down from 0.461(!) last September. We've caught 2008, and are running ahead of 2007, 2012, 2015, 2016 for sea ice extent on 9.11. We may catch 2010 or another year for lowest extent if there aren't more big losses soon. https://pbs.twimg.com/media/DJkbUBAU8AAmg72.jpg:large
-
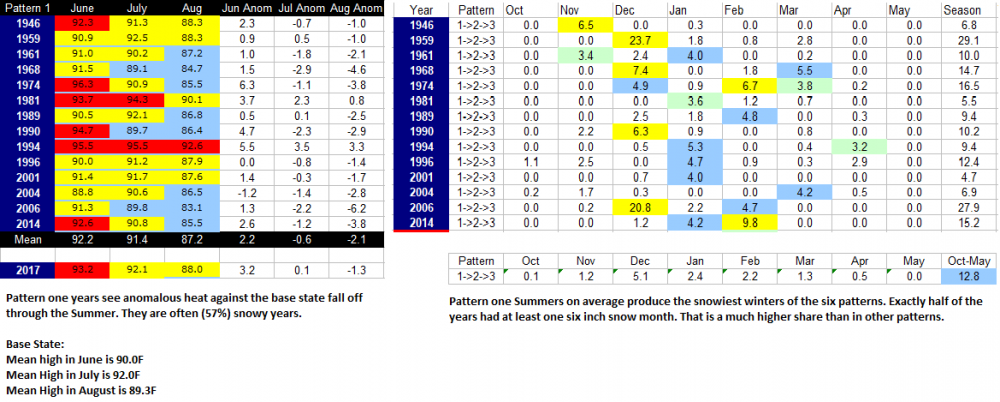
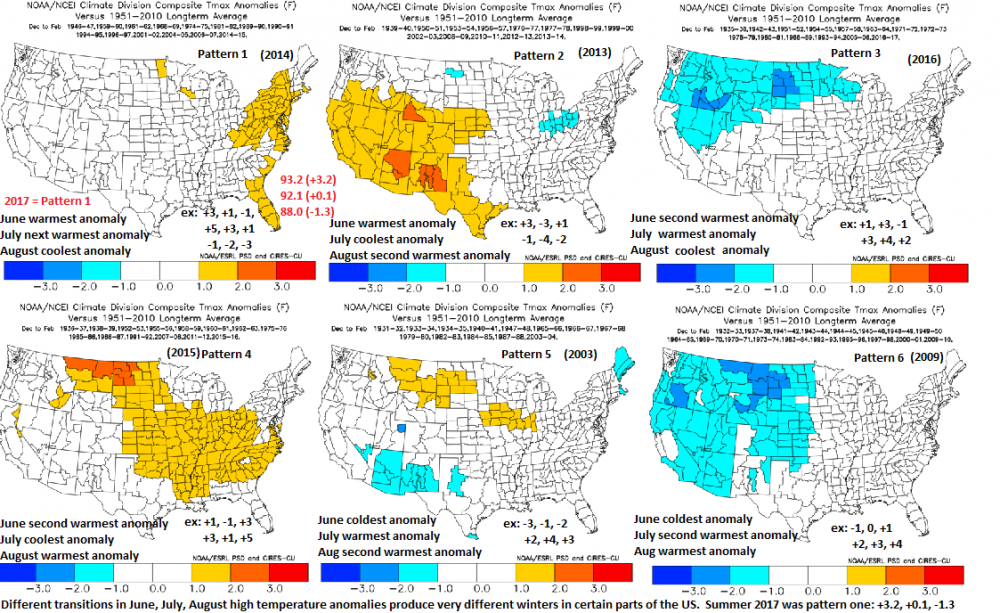
The transition in mean highs in Jun->Jul->Aug is a pretty decent indicator of snow in ABQ. We had pattern one this Summer. Against 1931-2016 mean highs, June was +3.2, July was +0.1, and August was -1.3F. Historically, going from warmer to cooler anomalies from June to July to August tends to come before a snowy winter in Albuquerque. It isn't particularly biased by El Nino either, only 35% of the years that fit the pattern are El Nino. Most are actually Neutrals (58%), which is what I expect this year to be. Pattern one Summers also tend to have slightly warmer than normal winter highs in the Northeast, even with 2014-15 in there as a striking counter-example.
-
NSIDC has sea ice extent on 8/29/17 higher than 2007, 2011, 2012, 2015, 2016. Outside chance the lowest extent date ends up above 2008 too?
-
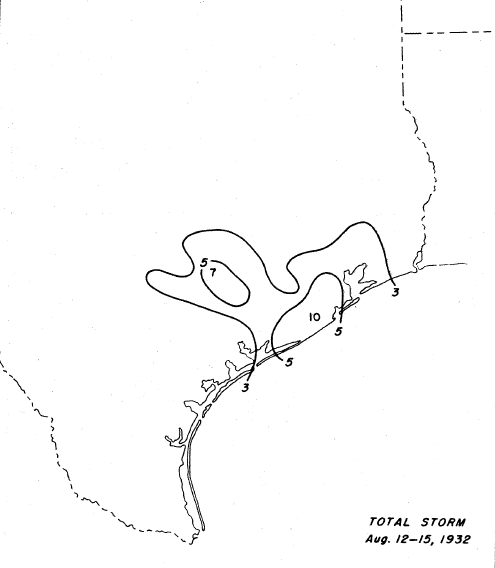
This is what I found for the 1932 Freeport Hurricane rain totals, which happened on a similar path, and with somewhat slow movement. It was a cat four though, don't think Harvey will be. Probably less wind, more rain as a result.
-
As I noted - this year is kind of like 1932 in a background sense (PDO, AMO, Solar, ENSO, ENSO sequence, Modoki status, etc). Here was hurricane two in 1932: https://en.wikipedia.org/wiki/1932_Freeport_hurricane
-
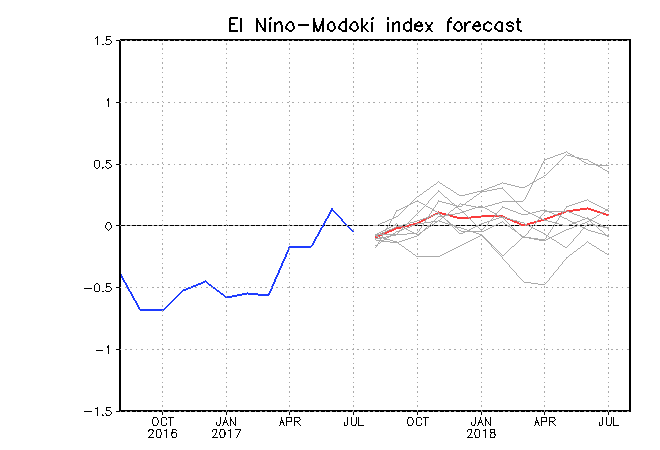
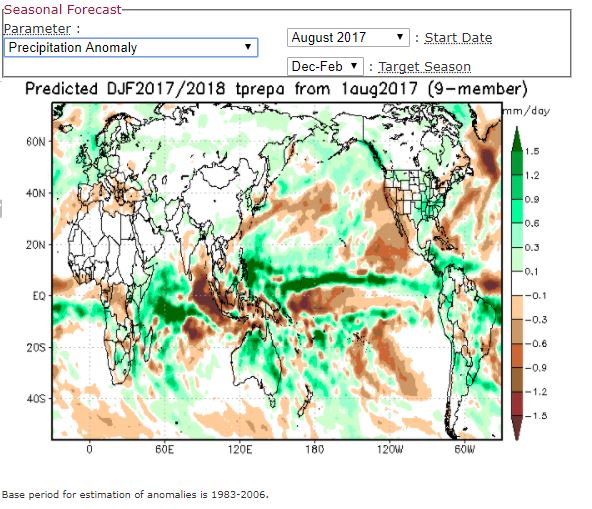
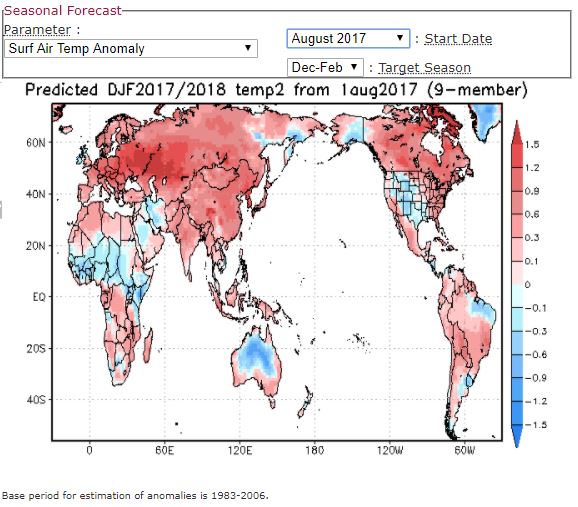
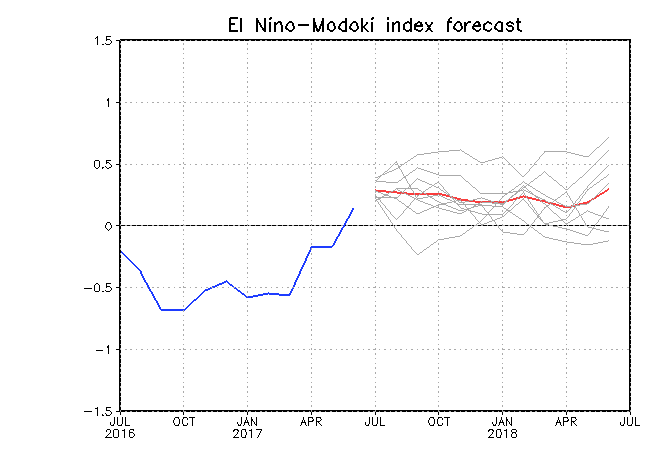
Had a lovely cloudy/cool day yesterday here, 76F for the high 60F at night. 78F or 79F today? https://t.co/on5O30hu92 Fall Outlook Anyway - Jamstec August update is in. Still likes a Neutral winter (but it uses a weird base period 1983-2006), and it has the West pretty cold now. Modoki values in winter are correlated somewhat with low solar, so I think its on the right track in dropping the Modoki value to 0, maybe to below 0 next month. >0 means Central Tropical Pacific is warmer than East/West Tropical Pacific. <0 means the opposite. So high Modoki values (>0 ) are a La Nina Traditional or El Nino Modoki signature (2009), while low values (<0) are a La Nina Modoki or El Nino Traditional signature. It does get weird, because just about La Ninas are -Modoki values, so -0.3 might be a better indicator. The +/-0 works well for El Ninos though. Last winter (DJF) was a La Nina Modoki, with -0.4C officially in DJF (after several -0.8C and -0.7C periods), with a -0.5 Modoki reading. I'm rooting for a -0.0 to -0.2 Modoki reading and a cold Neutral (-0.2 to -0.4C) ONI at this point. JAMSTEC had -0.2C in Aug 2016 for DJF 2016-17, but ended up at -0.4C. It shows +0.1C for DJF 17-18. So hopefully we stay in the negative Neutral zone. I like -0.3C or so for winter, maybe -0.5C in the Fall for one period.
-
I'll put my Fall Outlook on here tomorrow - it's fairly short, only 14 slides, 8 pictures. Generally, expecting a cooler Fall in New Mexico. We had a warm (+2.2), wet (+20%) Fall last year against 1931-2016 means. This year, expecting a cooler (-0.8F), wet (+30%) Fall against 1931-2016 means. Main differences for NM that I expect are: - Cooler/ Wetter Sept v. 2016 - Much Cooler (-6F, 69.9F instead of 75.9F) / Wetter Oct v. 2016 - Slightly Cooler / Much Drier Nov v 2016 - we had near record precip last November.
-
I've been playing with a Fall outlook by matching weather conditions in my area w/ ocean/solar conditions globally, and even though Texas looks somewhat warm (+1F to +3F) in Fall, it does look wetter than average, with maybe a hurricane or two late Aug - late Sept? Don't think it'd be more than 1-2 though, the two clusters seem to be Central Gulf of Mexico landfalls and SC landfalls in the analogs. 1932 was the only year with a couple TX landfalls. Selfishly, I'd like TX to fry, we tend to be wet here when you have big highs over you - haven't had a wet August (>1.2* mean of 1.45") in the city since 2006.
-
The AMO really does seem to have tremendous influence on the ice extent on Aug 1, or it is an amazing coincidence, I got an r-squared of 0.44 for annualized AMO to Aug 1 sea ice extent. The sun is a weak predictor of sea ice extent change for Aug 1 - Peak extent, but the AMO was still correlated at 0.22 r-squared. The AMO has been trending much lower than last year since June, so that coincides well with relatively little ice lost from the peak date (which varies) to Aug 1. Peak to Aug 1 losses are the lowest since 2006. Sunspots & AMO, when annualized correlate at 0.06 for 1979-2016, so that's kind of weird in its own right. The AMO seems to have been hot (>=0.2) on an annual basis 11 times in the prior warm cycle (~1926-1963), so would suspect we're almost done with these super warm years, there are probably two more shots in an AMO sense at breaking the 2012 record, assuming it doesn't happen in 2017, before 2020-2030 when the cold AMO sets in and slows/reverses the trend in declining ice. Super Warm Years (>=0.2) 1926-1963: 1932, 1933, 1937, 1938, 1944, 1945, 1951, 1952, 1953, 1958, 1960 Super Warm Years (>=0.2) since 1994: 1998, 2003, 2004, 2005, 2006, 2010, 2012, 2016, 2017* (probably) The AMO years under -0.10 average 8.786 million km^2 sea ice extent on Aug 1, the AMO years over +0.10 average 7.397 million km^2 sea ice extent on Aug 1, so some kind of slow down seems possible even with the Earth is warmer in the 2020s, back to maybe the late 1990s / early 2000s level?
-
Solar activity (Jan-Dec sunspots via SILSO) is actually correlated pretty strongly with sea ice extent on August 1 in the Arctic going by http://nsidc.org/arcticseaicenews/charctic-interactive-sea-ice-graph/ but I think it is because the Sun & AMO flipped phases at similar times, i.e. the sun has weakened fairly consistently since the big solar years in the 1930s-1990s, and the 70s/80s/early 90s is when the AMO was cool, now it is warm.
v.SunspotsJan-Dec.PNG.3e1ee3fb16c787bfb6caae8e1bd57e56.PNG)
-
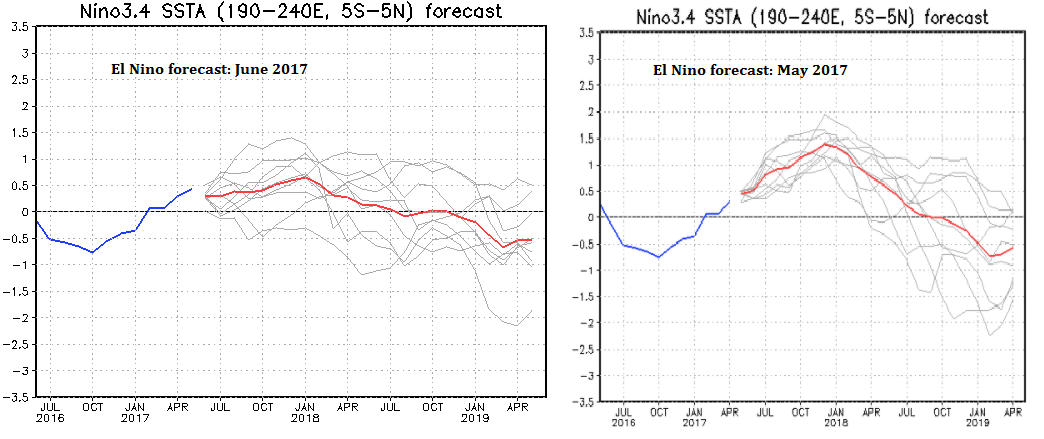
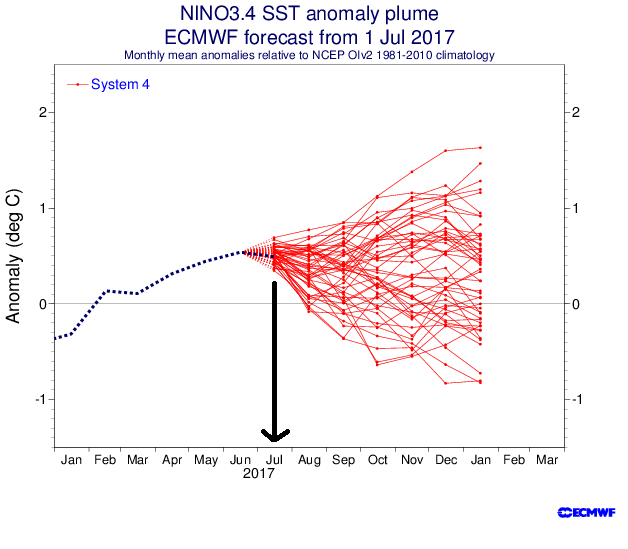
The European (public) page updated, had Nino 3.4 at +0.5C in July, down from +0.6C in June. This is despite the substantial cooling in Nino 3.4 since July 24th or so. We have yet to return to +0.5C or higher since than cooling, which followed a big positive SOI burst.
-
I'm still kind of conflicted on the winter. Historically, +0.5C ONI in AMJ usually leads to an El Nino, of some strength. But it occasionally leads to cold Neutral too. Can eliminate a La Nina though. Unless coming off an El Nino ('41->'42, '82->'83, '97->'98, '04-'05, '15->'16 ) La Nina hasn't formed after a +0.4C or greater ONI in AMJ, at least back to 1930. Options seem to be: Moderate Modoki El Nino, w/ low solar, a warm Atlantic, a warm or neutral-ish PDO, following a Modoki La Nina, after a wet monsoon. That would be a cold winter with relatively average precipitation and fairly high snow totals for me. OR a Cold Neutral, w/ low solar, a warm Atlantic, a cool or netural-ish PDO, following a Modoki La Nina, after a dry monsoon. That would be a cold winter with low precipitation and average snow totals for me. Neutrals can be very cold in the West if the AMO is high, the PDO is low, and solar is low, but they're not as wet as El Ninos. 2012-13 was cool in my area with a somewhat warm Atlantic, a cold Pacific, and high solar, after a hot, dry Summer.
-
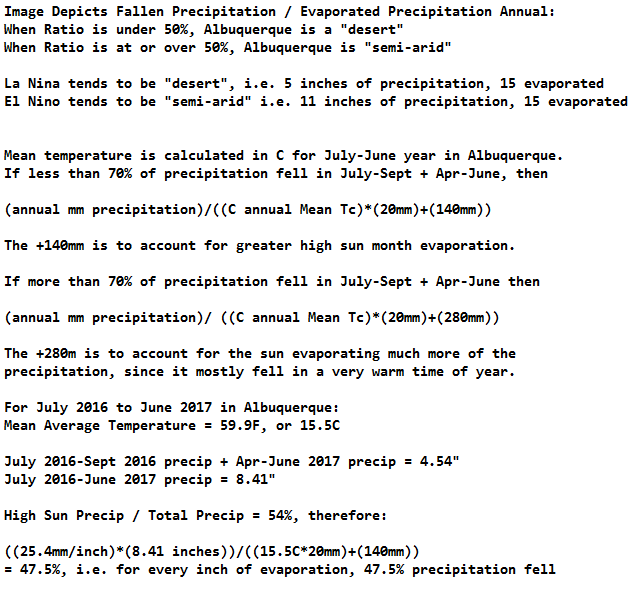
For a La Nina-ish year, Albuquerque did pretty well in terms of the traditional precip/evaporation measures in July 2016-June 2017. For every inch of water evaporated during the year, we got about 47.5% back as precipitation. That's really not bad given it was a pretty warm year overall. Traditionally, La Nina years only get ~40%, but some do get more.

-
6/24-6/25 big bands of precip have set up over the Gila in New Mexico, then drifted east. So far they have missed Albuquerque, but the band today might get here. Gonna be close.
-
Time to wake up Texans!
-
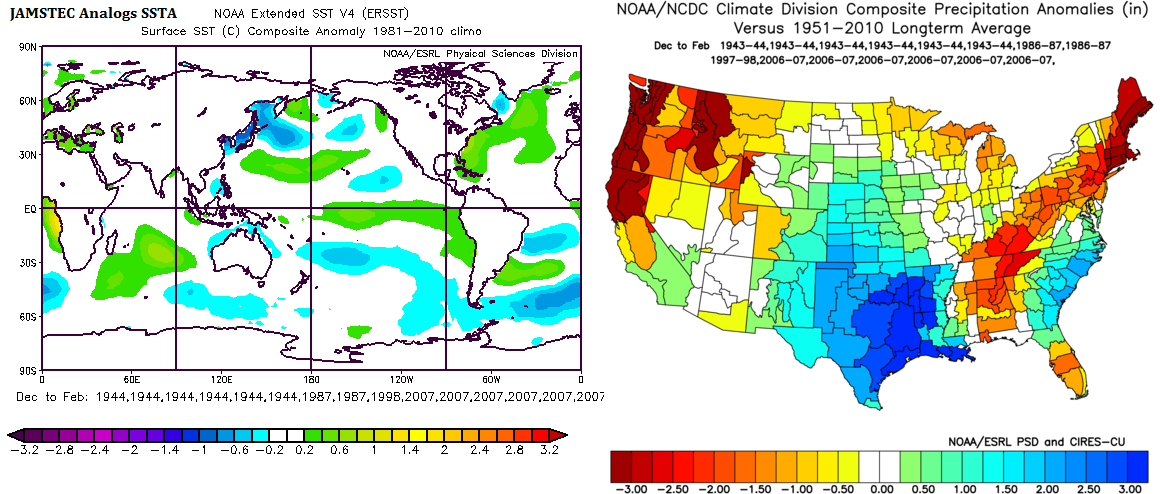
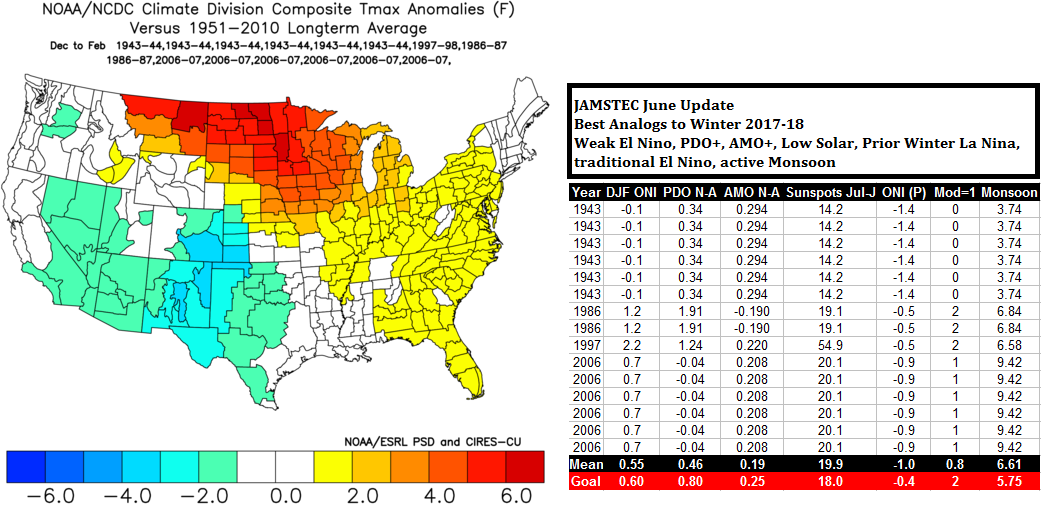
The JAMSTEC update for June looks like it has borderline El Nino conditions for mid-Oct to mid-Feb, with the rest of the forecast period merely "warm neutral". Whatever you'd call it, the trend is way down since April when the Jamstec had a super El Nino, and May when it had a pretty healthy 2009-like El Nino. The good news for the West, is that the Jamstec has also corrected away from forecasting an El Nino Modoki to showing a relatively traditional (if weak) El Nino. Looks like a low solar, weak, traditional, warm AMO, warm PDO, post ~La Nina, post wet monsoon Summer, El Nino-ish winter for the West. Blend of 1943 (x6), 1986 (x2), 1997 (x1), 2006 (x6) seems like a pretty good match to what the Jamstec shows.


-
CPC has this feature called "constructed analogs" - it recreates ocean conditions forecast from historical conditions from 1948-2017. I was paying with it earlier, was able to match (relatively) well with what their most recent update has for Dec-Feb by using 1976-77 (x2), 2004-05 (x2), 2006-07 (x4), 2009-10, 2014-15. Would be kind of a legendary winter here if it verified: cold, consistently wet, snowy. My analogs were based off of AMO/PDO values for Nov-Apr, ONI values Dec-Feb in Nino 3.4, the ONI value the prior DJF in Nino 3.4, Modoki status, sunspots July-June, Monsoon rains in Albuquerque. Close years get points. The weights were tricky, but I settled on a system of 15 points, where the AMO (3), Sun (3), and ONI (3) count most, followed by Modoki status (2), prior ONI (2), and then the PDO (1) and Monsoon rains (1). Any year that has at least 8 points gets weighted at ((weight)-(7)). Values I used were: Winter ONI DJF PDO N-A AMO N-A Sunspots ONI (P) Modoki=1 Monsoon 2009 1.6 0.43 0.200 13.2 -0.8 1 4.0 2006 0.7 -0.04 0.208 20.1 -0.9 1 9.4 1976 0.6 1.04 -0.315 23.2 -1.5 1 3.1 2004 0.6 0.47 0.222 55.3 0.3 1 4.1 2014 0.6 2.07 0.005 90.7 -0.6 1 5.7 1976 0.6 1.04 -0.315 23.2 -1.5 1 3.1 2004 0.6 0.47 0.222 55.3 0.3 1 4.1 2006 0.7 -0.04 0.208 20.1 -0.9 1 9.4 2006 0.7 -0.04 0.208 20.1 -0.9 1 9.4 2006 0.7 -0.04 0.208 20.1 -0.9 1 9.4 Average 0.7 0.54 0.085 34.1 -0.7 1 6.16 Expected 0.8 0.80 0.200 18.0 -0.4 1 5.75 AMO / PDO will probably be higher than I have - my system of auto-analoging was looking for the values I listed or expected, so it did a fairly good job.
-
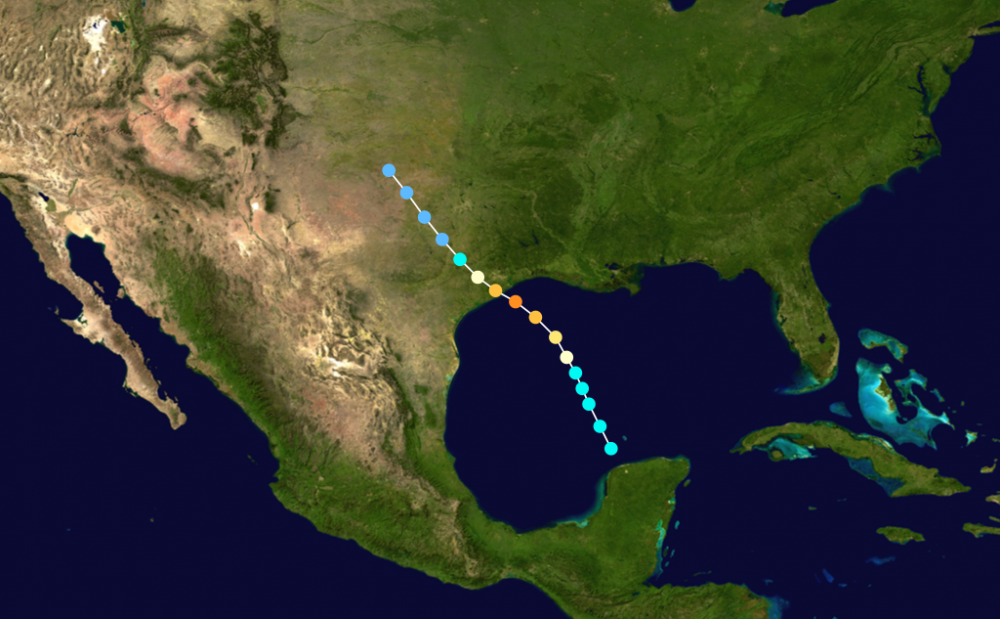
Gotta watch the possibility of a tropical system blowing up in the Gulf of Mexico and smacking Texas over the next ten days.