

snowman19
-
Posts
9,132 -
Joined
Content Type
Profiles
Blogs
Forums
American Weather
Media Demo
Store
Gallery
Posts posted by snowman19
-
-
Big news from Australia’s BoM: their model progs have just switched from 3.4 to relative 3.4 (akin to RONI)!
Relative Niño indices
Traditional Niño index values were used at the Bureau of Meteorology until September 2025. From September 2025, the Bureau uses Relative Niño indices, which measure sea surface temperature anomalies in the tropical Pacific Ocean in the Niño regions, but calculated relative to the global tropical region temperature anomaly. This is to relate the indices more closely to the localised processes associated with ENSO, rather than larger-scale tropical SST features such as global warming.
Example: The Relative Niño3.4 index calculation:
Relative Niño3.4 = S x [(Niño3.4obs – Niño3.4clim) – (Tropical Meanobs – Tropical Meanclim)]
Here’s the latest BoM relative 3.4 model prog for Relative 3.4, which has a low of -0.7C for OND:
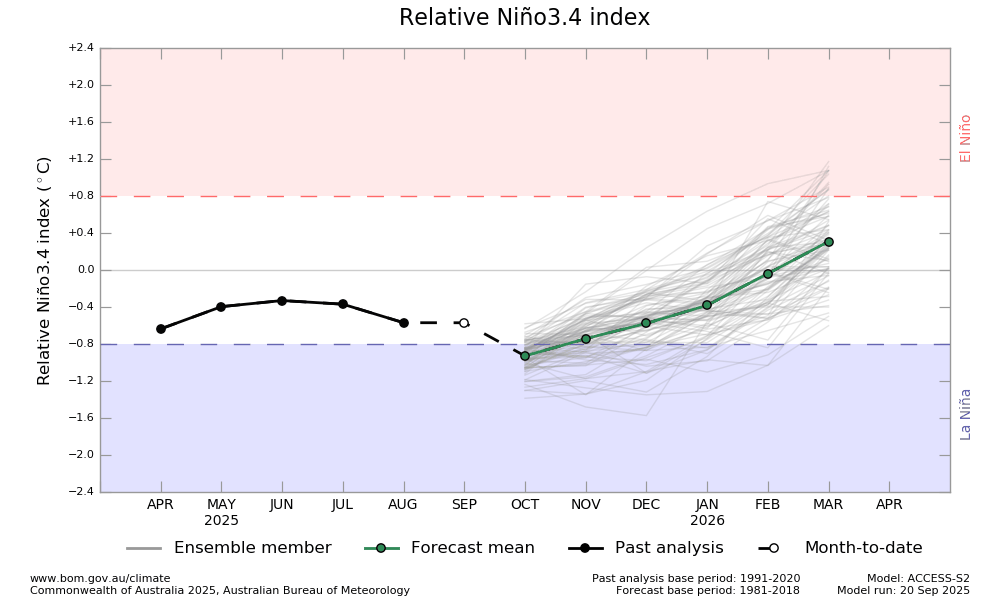
http://www.bom.gov.au/climate/ocean/outlooks/index.shtml?index=nino34#region=NINO34
[mention=13098]snowman19[/mention]
I agree with the BOM. A weak La Niña the remainder of the fall into at least early winter is inevitable-
 1
1
-
 1
1
-
-
Update:
-Season’s ACE is now up to 57.2.
-Gabrielle has exceeded earlier progs and is now on its own progged to get ACE to ~60.
-Humberto has been declared and is progged to add ACE of ~13 through Sept 30th though with lots of uncertainty, including upside to ~17-20.
-That would get ACE to ~73-80.
-But that’s not necessarily all as models are now significantly more bullish on still another TC by late this week from Invest 94L. A great level of uncertainty rests with 94L at this very early stage. The upside limit on that through Sept 30 is ~~10.
-So, current rough projections are significantly higher for ACE as of Sept 30th. In my quoted prog from 3 days ago, I had the upside at 65-70. That upside limit has since risen to ~83-90. That compares to the 1991-2020 average of 94 through Sept. 30. Thus, if this upside range of 83-90 were to verify, Sept 30th ACE could rise all the way to only a little below the active 30 year average!
-Oct-Dec 30 year avg is 28. So, if we were to get to 90 as of Sept 30th, getting to an end of season well over 100 would then be favored along with a reasonable upside of ~130-140 vs 1991-2020 avg of 122. That upside potential is extra realistic because of
1. mainly favorable MJO progged for next few weeks
2. weak La Niña on RONI basis is correlated most to above avg ACE late season
3. Euro Weeklies are active
[mention=13098]snowman19[/mention][mention=21068]PhiEaglesfan712[/mention]
My opinion has not changed. I don’t care what the models say. I still believe we finish this season below 100 ACE. If I’m wrong so be it-
1
-
 1
1
-
-
4 hours ago, Maestrobjwa said:
And what would your bias is?
My bias is not part of this conversation. I know you’re ready to start one of your 5th grade personal attacks
-
38 minutes ago, 40/70 Benchmark said:
There is also some solid evidence against another abysmal season, but some will ignore. I hear what you're saying, but feel like it's intellectually lazy. At the end of the day, we were due for extended regression.
The same can be said every year. If this board were around for the 95-96 and 97-98 winters, I’m sure you would have had people saying 95-96 was going to be a warm and snowless winter because of the Niña and on the flip side, I’m sure you would have had the weenies trying to force a cold and snowy winter for the 97-98 super El Niño. There are biases at play every year
-
1
-
-
-
@Gawx Starting to wonder if we are seeing a secondary peak in this solar cycle
-
1
-
-
3 hours ago, Stormchaserchuck1 said:
Warmer October still look likely. Long range models have +EPO, which I have stressed is a connected -PDO pattern, strongly, in October. What I mean is the PDO as an independent variable, not connected to 0-time conditions and influenced by them. It's working for the 2nd year in a row, as the PDO has been strongly negative in both of those October's.
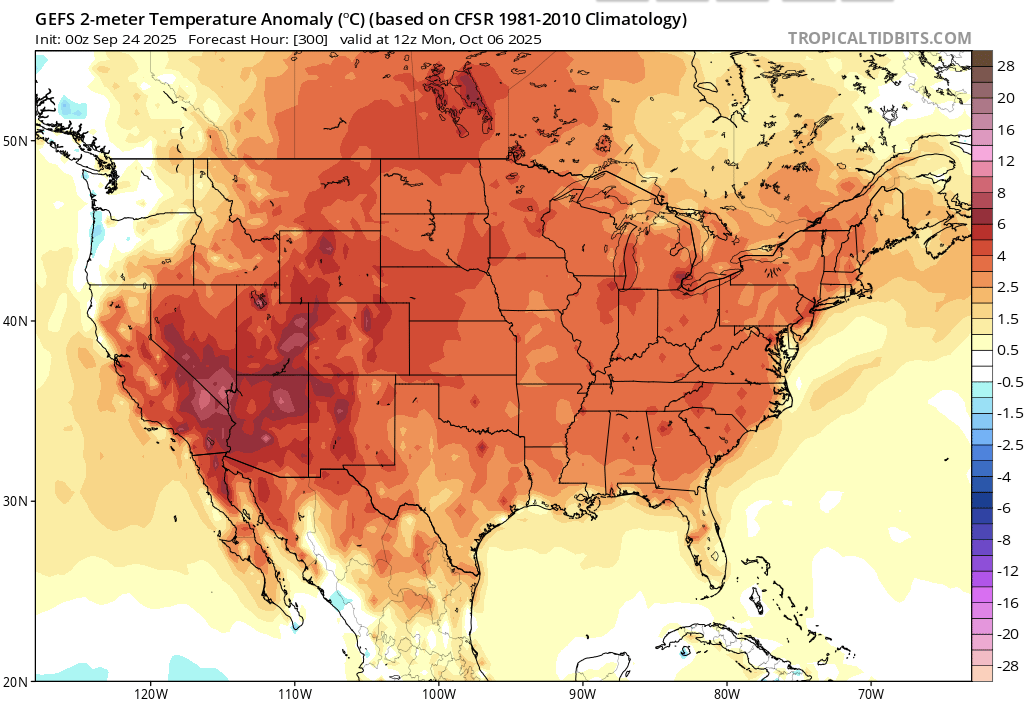
Very good call. It also looks dry as a bone which obviously is not good at all given the ongoing drought since the end of July
-
9 hours ago, BlizzardWx said:
I wonder if this will continue into winter. Any thoughts? I know a lot of our troubles the last ten years have been from too much MJO 4-6. So maybe no real MJO signal would be a plus?
In theory, a -QBO should destabilize the tropical tropopause and cause a stronger, more robust MJO and on equator forcing/convection. Maybe this erratic behavior with the westward propagations and weak, low amplitude MJO waves is only temporary and will change as we go deeper into fall? Strong -IOD/La Niña playing a role? I’m honestly not sure besides saying to take a wait and see approach
-
3
-
-
-
20 minutes ago, GaWx said:
The unusual clockwise dominated MJO rotation that started Sept 1st is continuing and progged to keep going through at least Oct 6th per the images below. So, it went from phase 5 (inside) on 8/31 back to ph 2 9/2-8. It temporarily went forward to ph 3 for 3 days but then backtracked across 2 then 1 and then 8. It’s forecasted to continue backtracking through 7, 6, 5, 4, 3, 2, 1, and 8.
I just looked at MJO diagrams for the 2nd half of each year back to 1975 and couldn’t find anything comparable: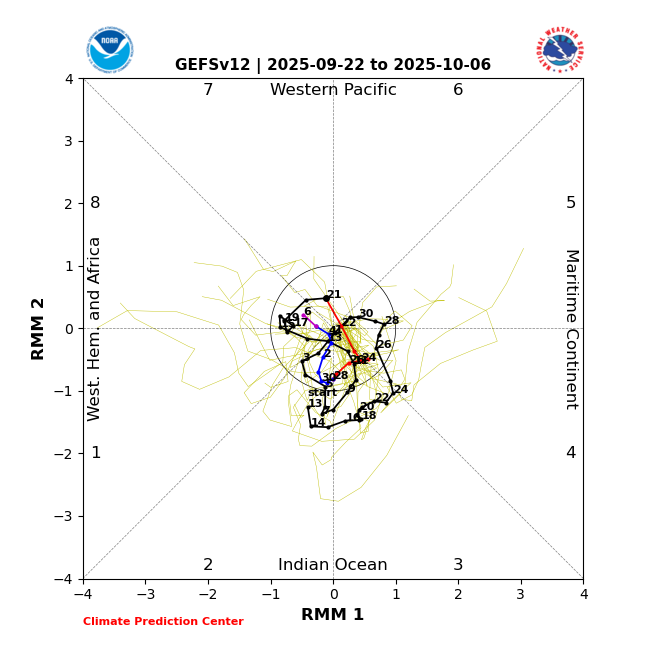
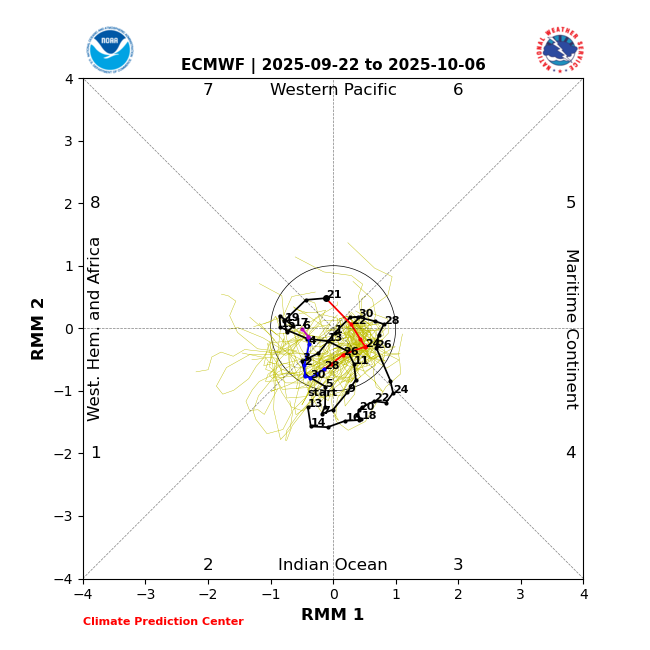
The MJO waves have also been low amplitude unlike last year at this time when we were seeing strong waves and are projected to stay that way
-
1
-
-
The unusual westward MJO propagation continues
-
1
-
-
I made this graph last year, it's a smoothed out AMO index since it went positive in 1995. It appears that we still seem to be in a rising phase, over the long term.
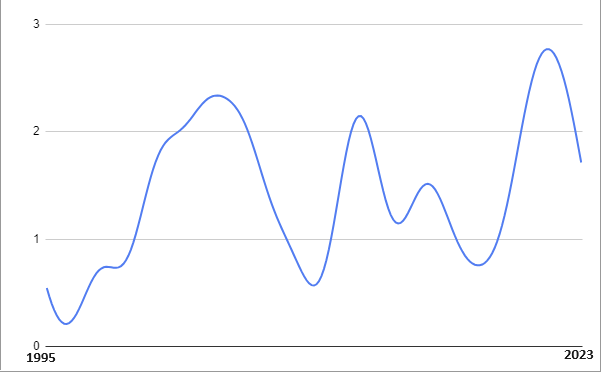
Also, the NAO has been very positive May-Aug, just like last year. Such +NAO in the warm season has a -0.3 SSTA correlation in the south-central Atlantic. A lot of the cool water this year is because of such a strong +NAO... It's been positive 8 of the last 9 months. If the NAO had been negative 8/9 months, you'd be seeing some very warm SSTAs in the Tropical Atlantic, and probably more activity this hurricane season.
And on the PAC side, this -PDO cycle has been much stronger than the last one (1940’s-1970’s). I’ve seen a few articles blaming the record low arctic sea ice on this -PDO cycle -
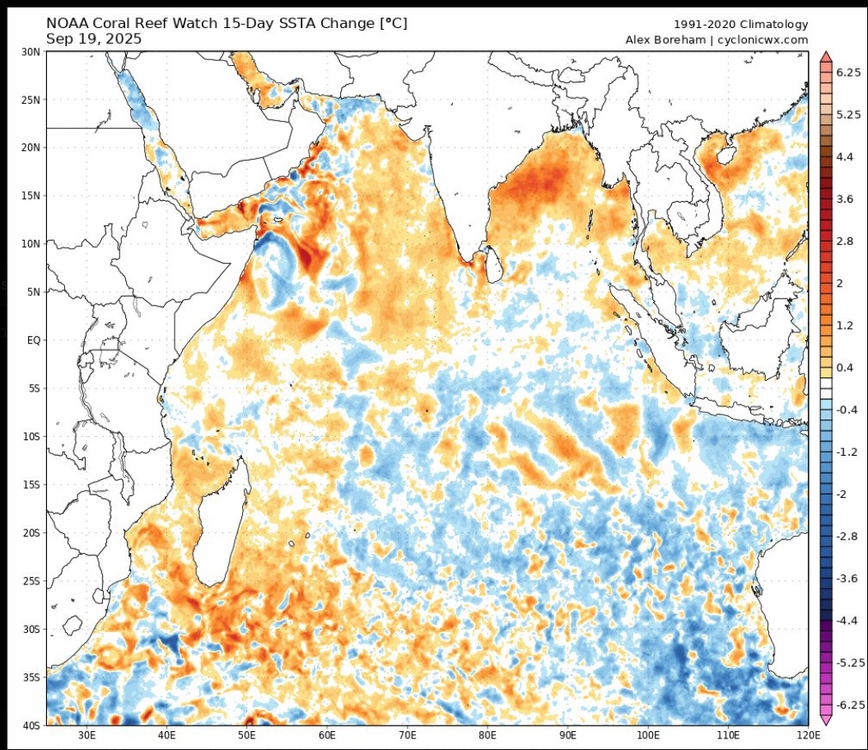
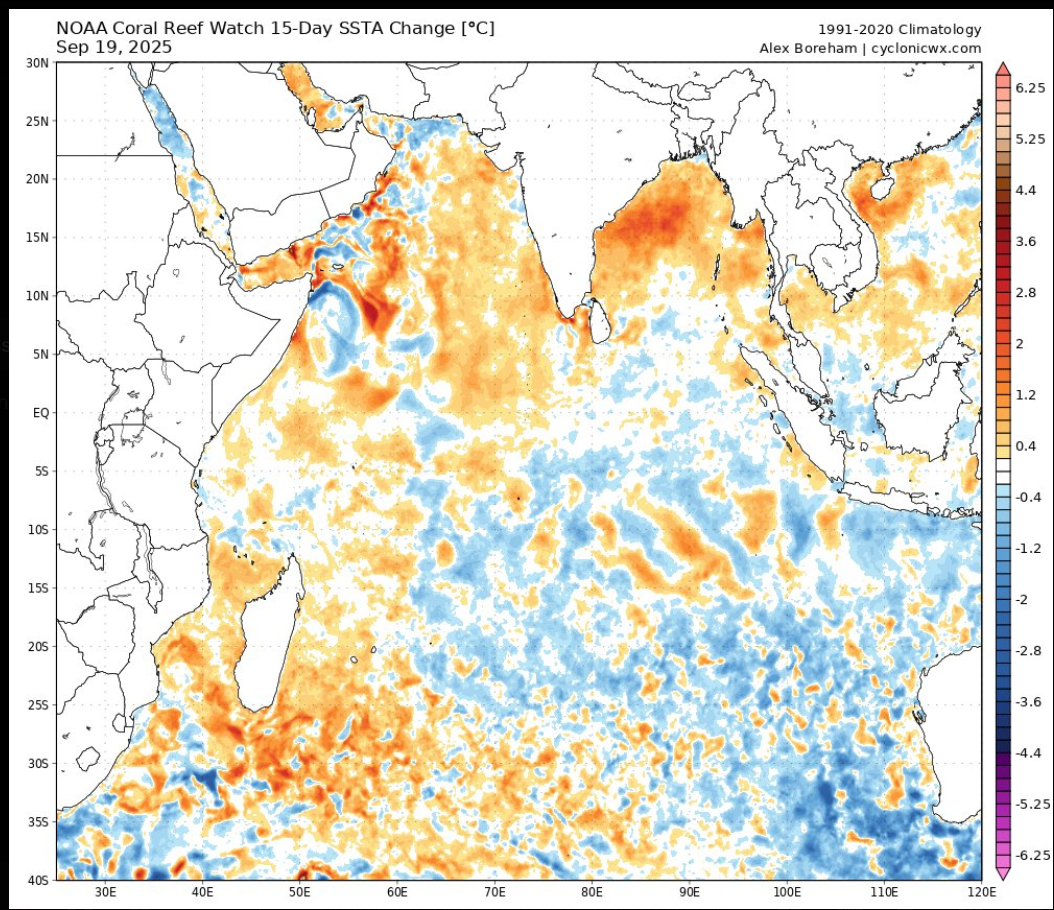
decent amount of bob warming recently
I think the question becomes when does the -IOD bottom out? Did it bottom out already or do we see another burst of strengthening in October. Either way the BOM and all models are projecting the -IOD event to continue the next few months. From the BOM: “The Indian Ocean Dipole (IOD) index has now met the negative IOD threshold (less than or equal to −0.4 °C) for 8 consecutive weeks, sufficient to be classified as a negative IOD event. The latest IOD index value for the week ending 14 September 2025 is −1.17 °C.
The Bureau's model predicts the negative IOD event to continue throughout spring, with a return to neutral in early summer. This is consistent with most international models assessed and the typical IOD life cycle.”
https://www.bom.gov.au/climate/enso/?ninoIndex=nino3.4&index=rnino34&period=weekly#tabs=Indian-Ocean-
1
-
-
12 minutes ago, GaWx said:
What do you and others think about the Nov 1950-March 1951 weak La Ninaish ENSO before warning up late as an analogue for 2025-6? A well-known met. got on that train yesterday due to an anticipated active late tropical season having the potential to be similar to Oct of 1950 based on precip anomaly progs by the longer term Euro. This met. talked about the severe effects on the NE US caused by the 11/25/1950 superstorm.
I don’t think we are going to see a big October burst in Atlantic tropical activity. This is how many months in a row now that people have been saying a big burst is coming? The finish line just keeps getting moved further and further forward in time. Now it’s October. This is becoming The Boy Who Cried Wolf. Eventually you have to acquiescence and admit defeat
-
1
-
1
-
-
@Stormchaserchuck1 IMO we are on the verge of finally going into a -AMO cycle

-
1
-
-
-
Also, a very strong -IOD signature here
-
-
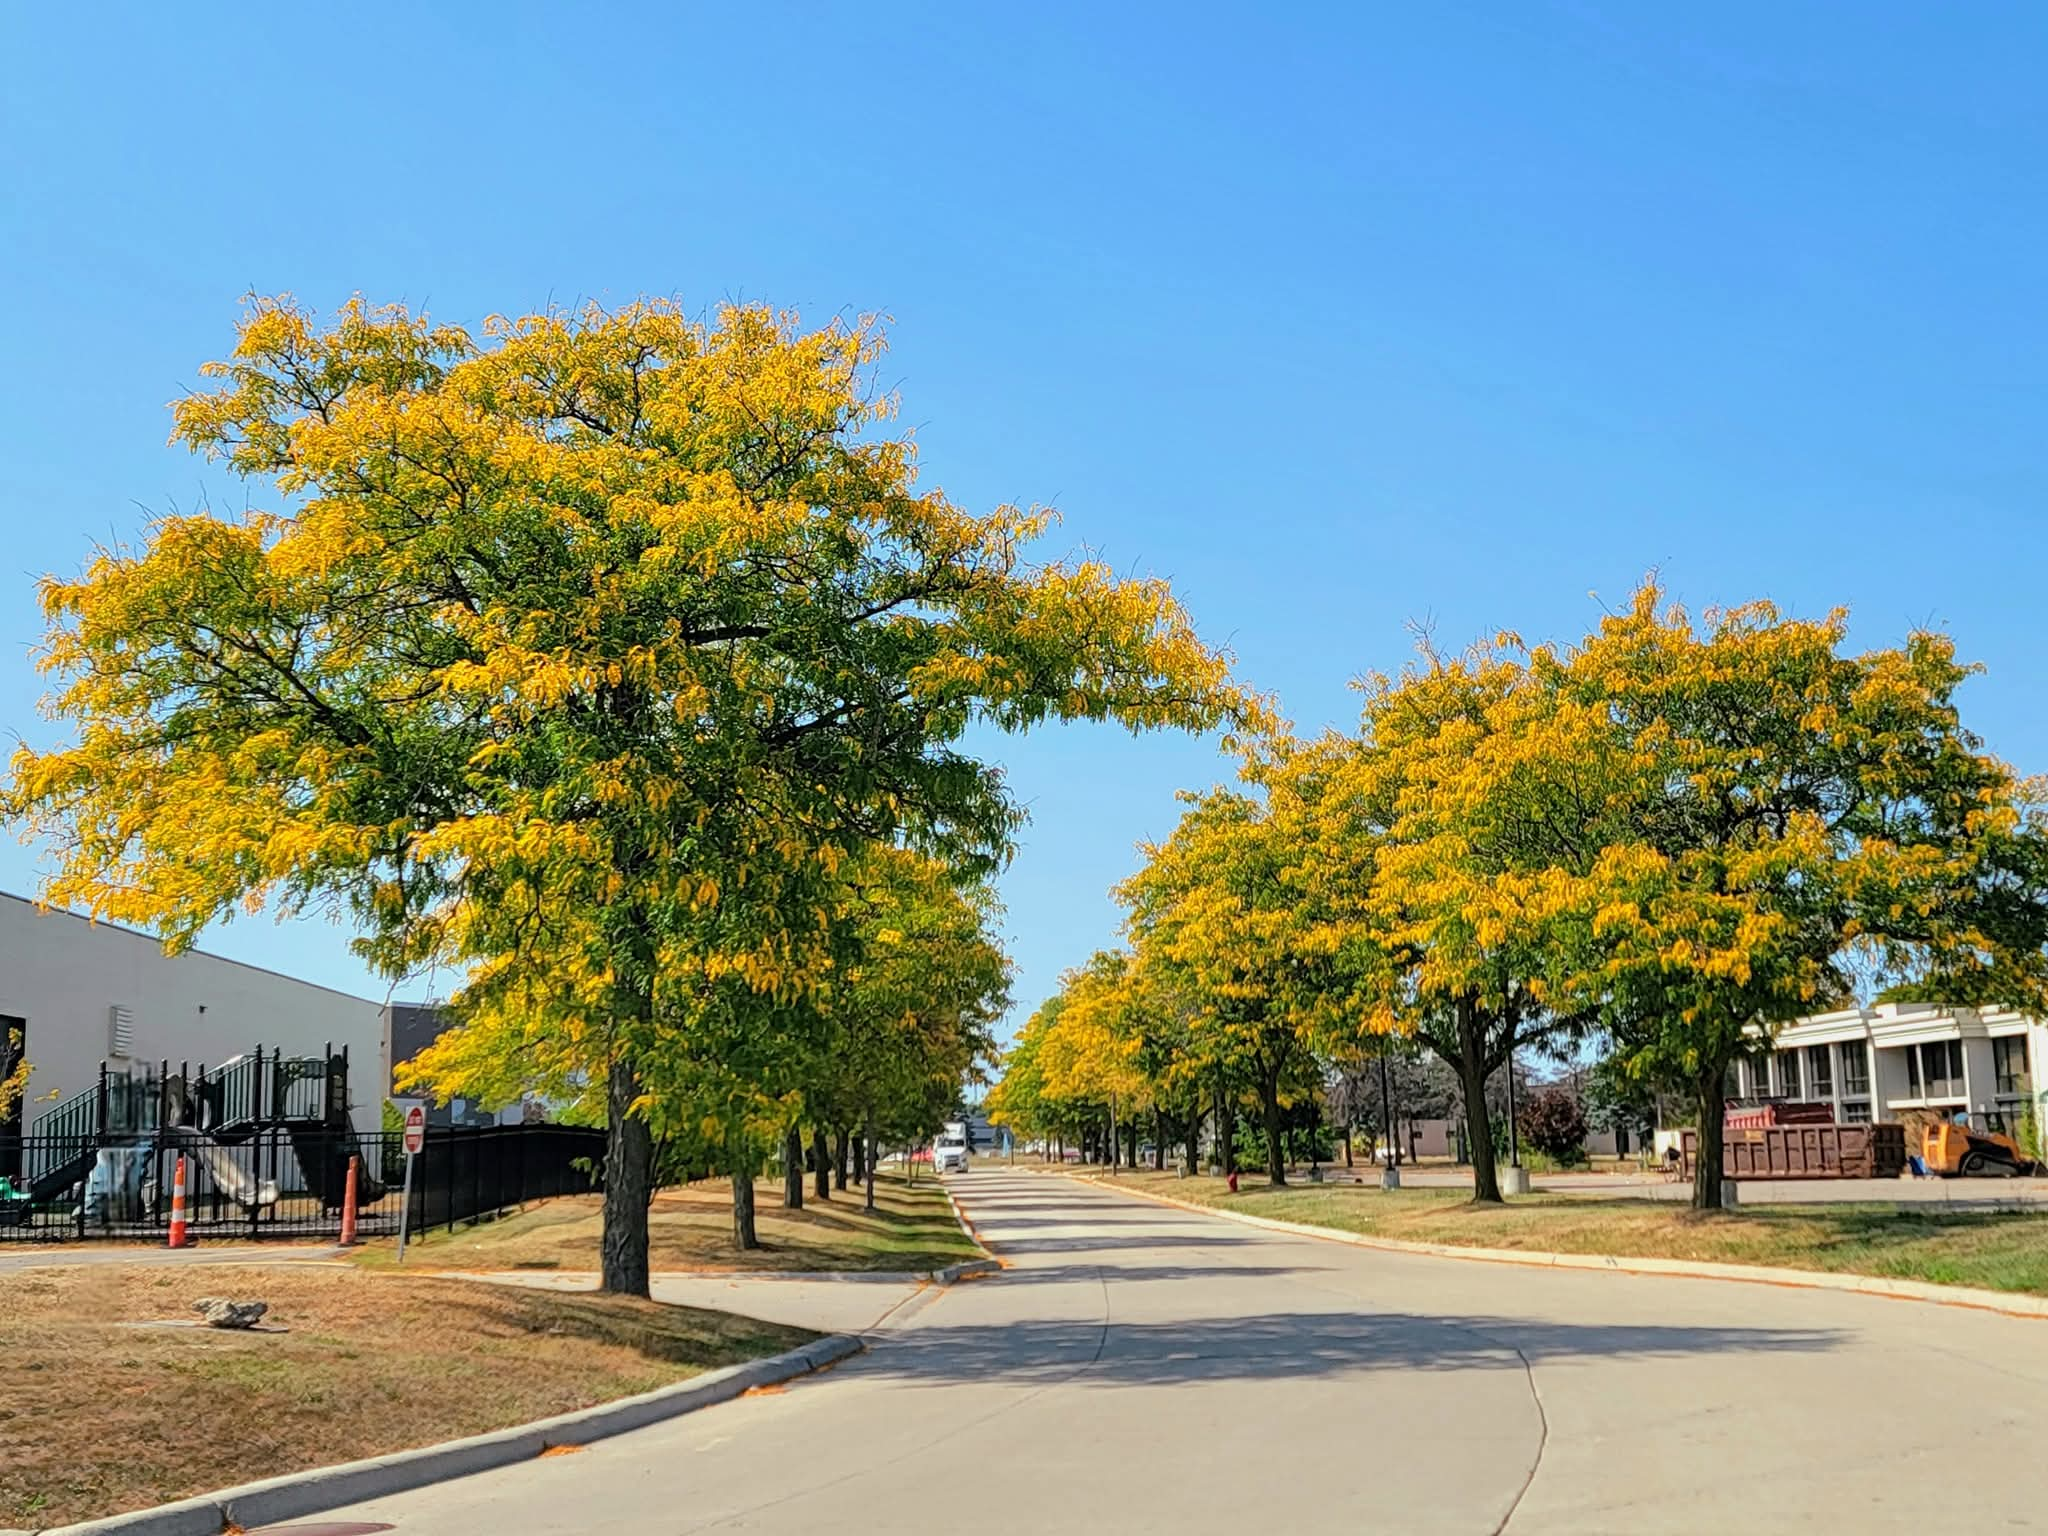
I imagine color is ramping up bigtime in NNE with the drought.
Our average peak in SE MI is mid-late October, but color began in late August as the cool nights arrived and even with the pattern shift to warmer, color continues to expand. The air smells like fall with all the drying leaves, even in the warm sun, and I suspect the dry conditions have to be playing a part.
Kind of hard to tell in this picture from earlier, but the gold of the grass is only a few shades lighter than the gold on the trees.
It’s been insanely dry since the end of July-
1
-
-
-
43 minutes ago, 40/70 Benchmark said:
The real heart to the drought is over northern New England....couple that with a modest +NAO and maybe it’s finally my turn.
You are right about the smax. High sunspots and especially high geomag argue for +NAO as does the cold North Atlantic
-
Until that W PAC meaningfully changes it’s very difficult to be hopeful south of I-90 for a decent winter. Maybe there can be an outlier like 20-21 but that’s a maybe one in ten proposition. Or we get a season with no/little SE Ridge like last winter and lots of suppression. Of course the I-90 corridor and north can still get a lot from SWFEs which 07-08 had pretty much every other day.
Honestly, the most concerning thing, at least as far as snowfall is the drought. These typically aren’t easy to break, especially when in place for several months. They form a feedback cycle. And parts of the northeast are historically dry
As far as the SE ridge, I think we do see much more SE ridging this time around due to the state of the Atlantic. BAMWX actually touched on this yesterday -
I mentioned it a few days ago but the WPAC SST alignment matches previous years that saw a lot of +WPO. This -PDO cycle has been different than the last major -PDO cycle we saw (1940’s-1970’s), where where we now have the western North Pacific boiling, unlike back then
-
1
-
-
If this dry pattern continues into October and it looks like it will, my fear is that this drought has a chance of becoming worse than last fall….that dry pattern didn’t start until after mid-August, this one started at the tail end of July
2025-2026 ENSO
in Weather Forecasting and Discussion
Posted
As far as the WPO goes….I have to agree with you there. The WPAC SST pattern over the last couple of months up to now is matching past years that had predominantly +WPO winters. If that doesn’t change in a big way between now and the end of November, a +WPO winter would not surprise me