RIC Airport
-
Posts
2,586 -
Joined
-
Last visited
Content Type
Profiles
Blogs
Forums
American Weather
Media Demo
Store
Gallery
Everything posted by RIC Airport
-
Richmond Metro/Hampton Roads Area Discussion
RIC Airport replied to RIC Airport's topic in Mid Atlantic
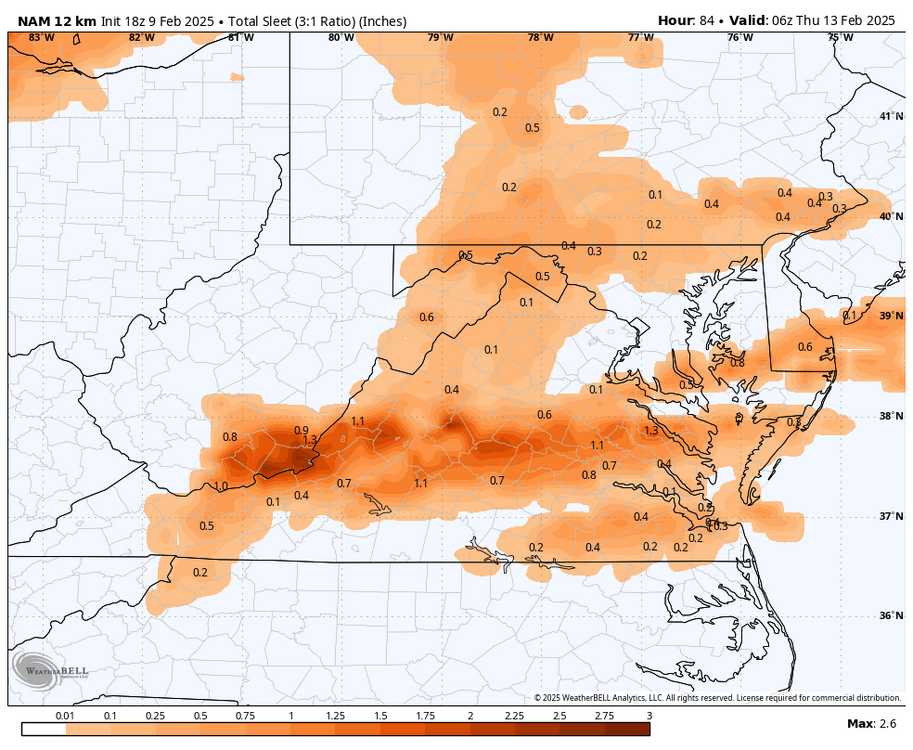
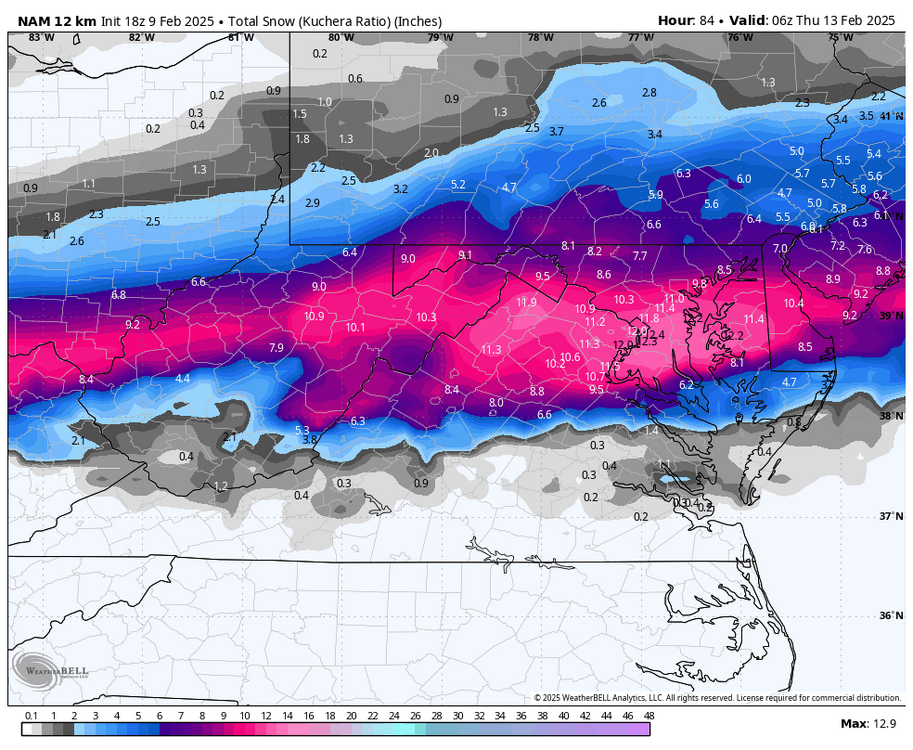
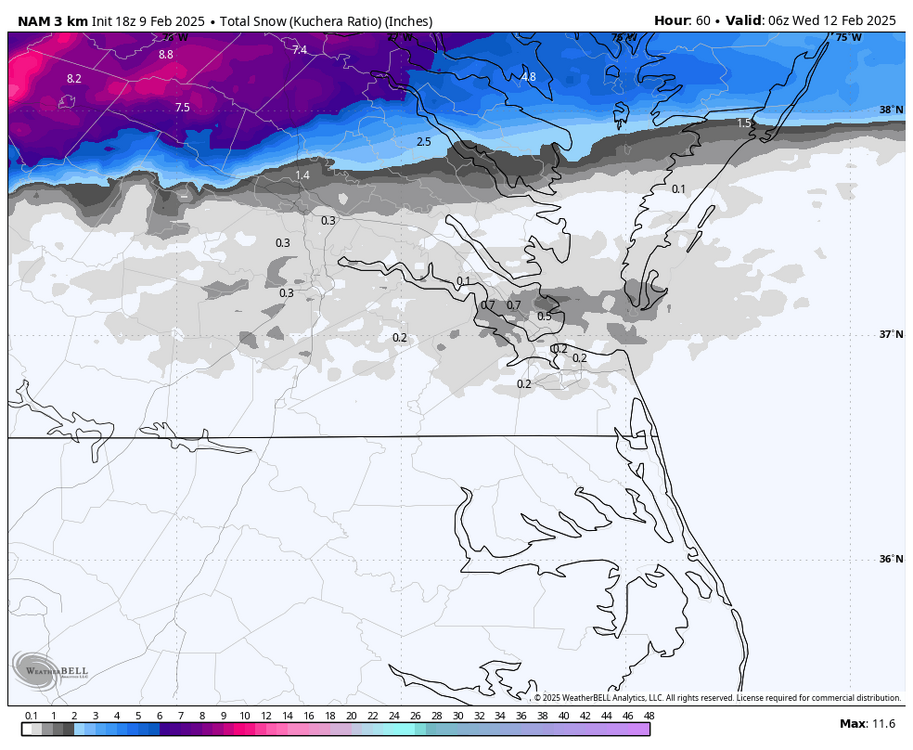
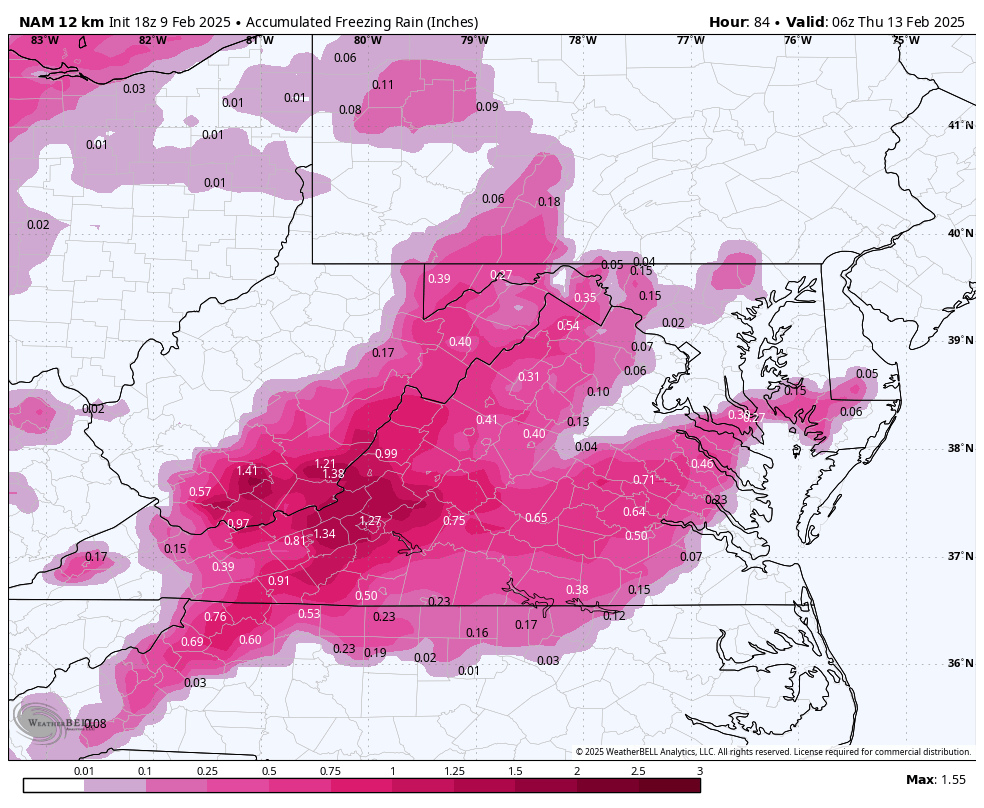
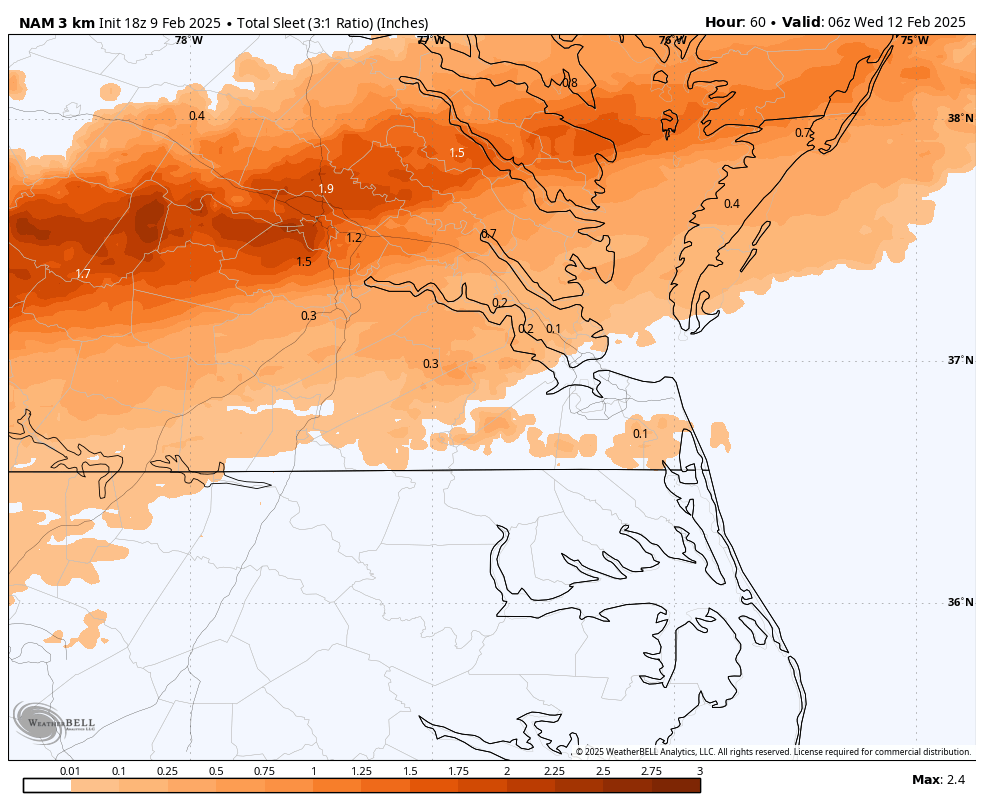
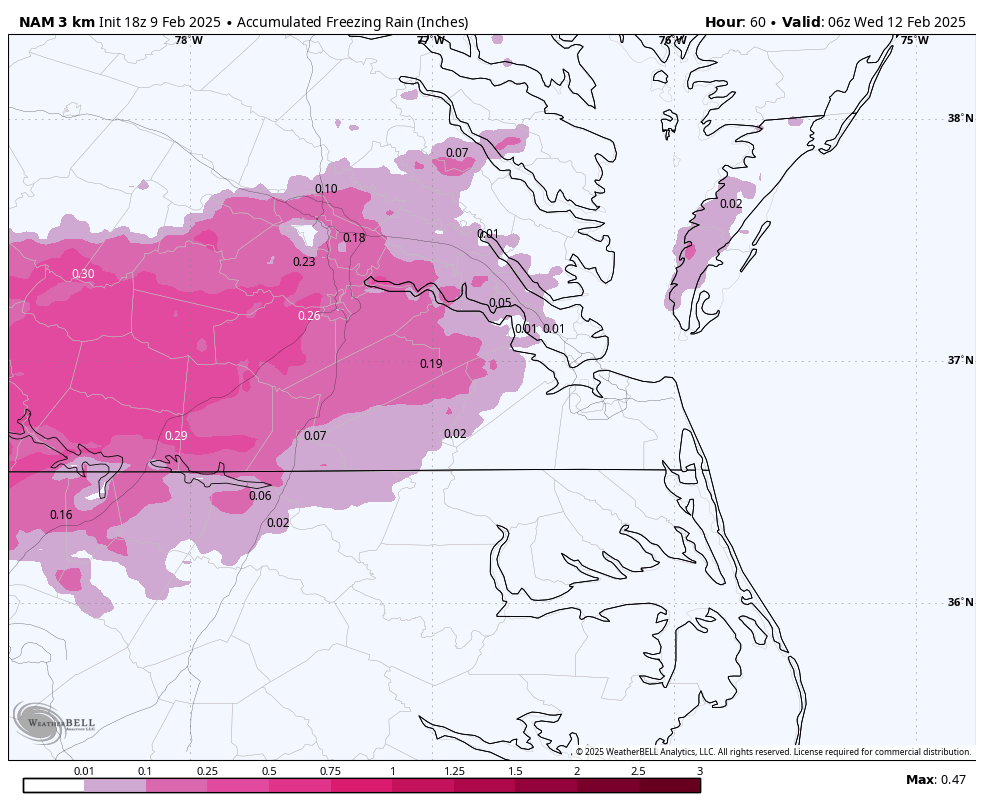
Yeah, and that was the 3K NAM only through hour 60. Look at the ZR amounts on the 12K NAM through hour 84, although probably overdone. Once RIC hits freezing, it's at freezing all night with ZR.
-
Richmond Metro/Hampton Roads Area Discussion
RIC Airport replied to RIC Airport's topic in Mid Atlantic
NAM is colder, but is basically a IP/ZR fest.


-
Richmond Metro/Hampton Roads Area Discussion
RIC Airport replied to RIC Airport's topic in Mid Atlantic
Watches just issued to our west. -
Richmond Metro/Hampton Roads Area Discussion
RIC Airport replied to RIC Airport's topic in Mid Atlantic
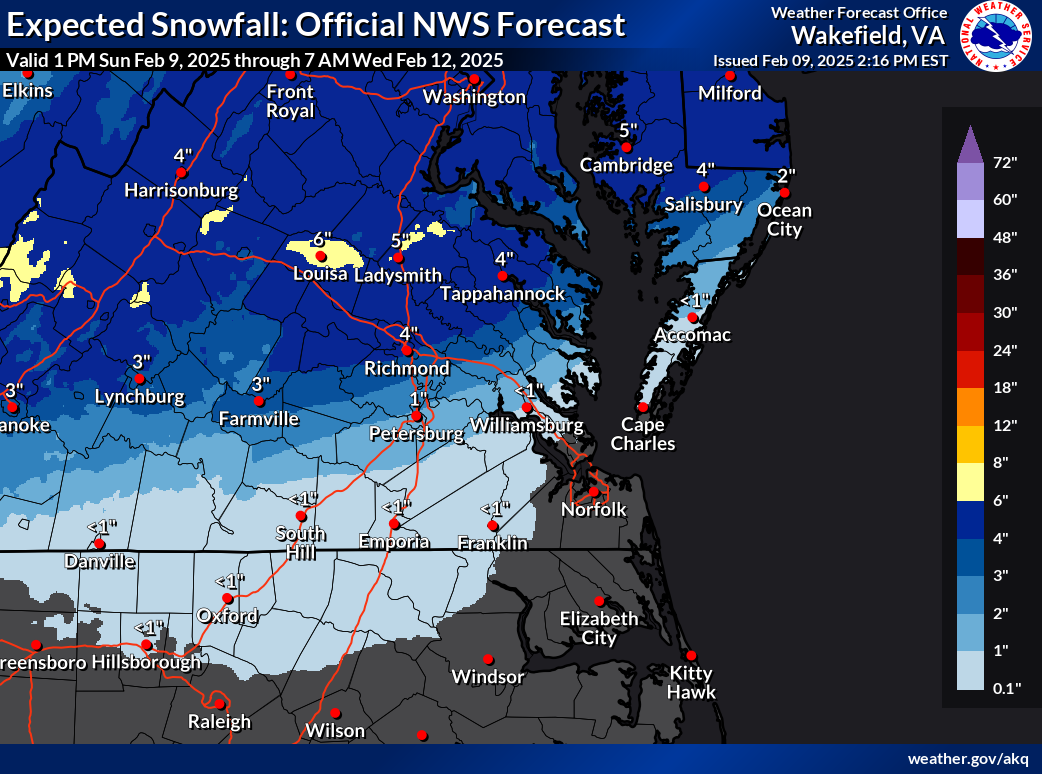
Here is the latest map from AKQ, updated about 10 minutes ago. You can tell they didn't collaborate with RNK in the Buckingham and Appomattox areas.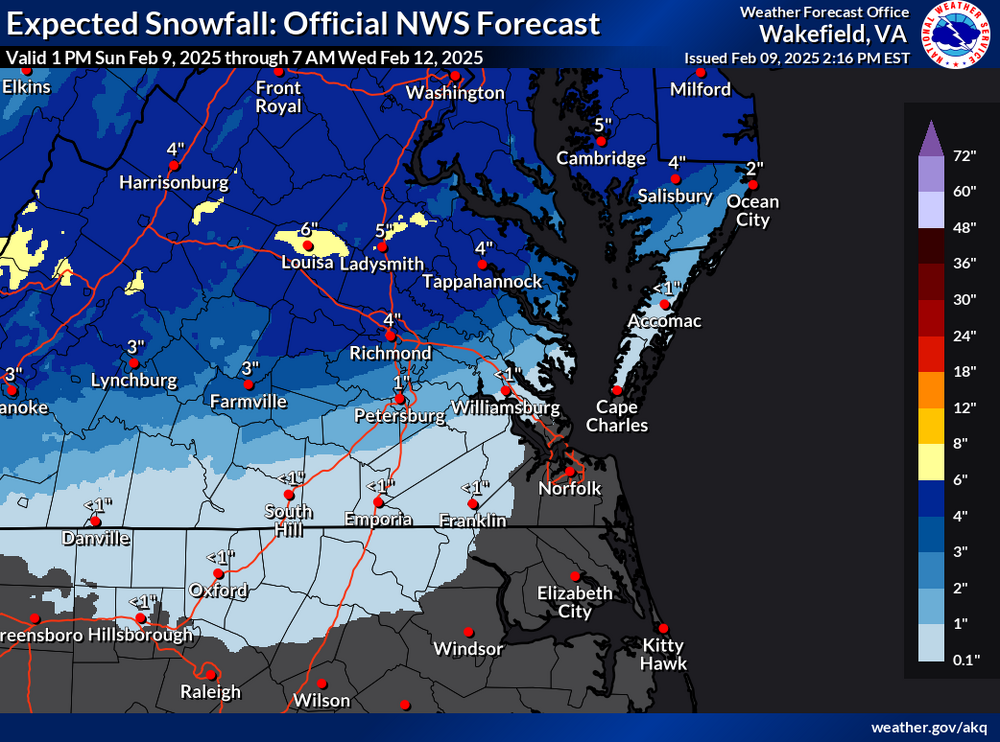
-
Richmond Metro/Hampton Roads Area Discussion
RIC Airport replied to RIC Airport's topic in Mid Atlantic
Surface temps are so marginal. We need precip to start earlier in the morning. Euro has RIC at 29°F at 7 am ahead of the precip, but it's up to 37°F by 11 am when the precip starts, and it just stays at 33°F during the event. Euro has 850mb temps rising above 0°C around 7-8pm. The GFS has RIC at 32° at 7 am and at 36°F by 11 am, dropping to 33°F for most of the afternoon. But, the heavy rates help RIC drop to 32°F at 5 pm, where it stays for the rest of the night. 850mb temps on the GFS don't go above 0°C until Wednesday afternoon. Just highlighting the differences I've seen between the Euro and GFS. -
Richmond Metro/Hampton Roads Area Discussion
RIC Airport replied to RIC Airport's topic in Mid Atlantic
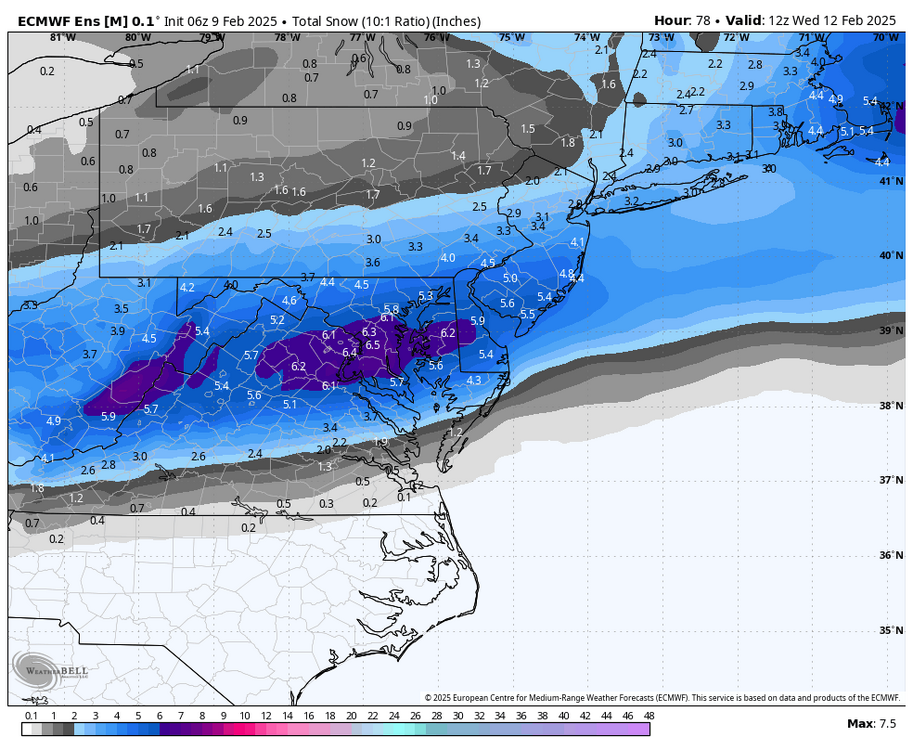
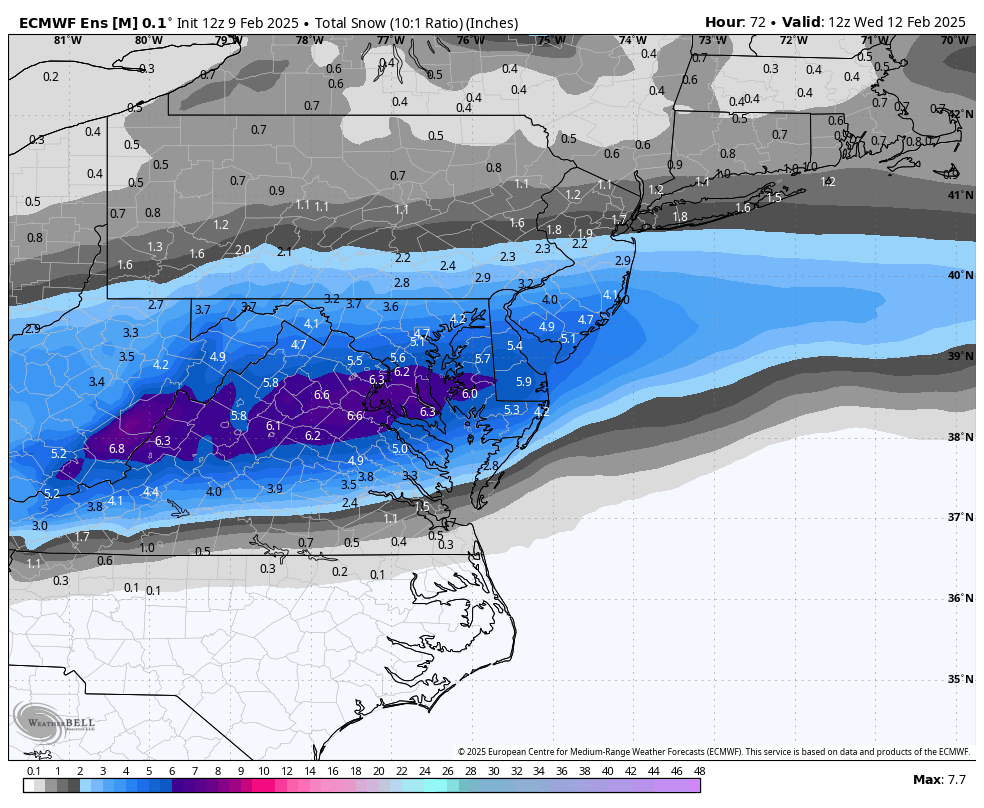
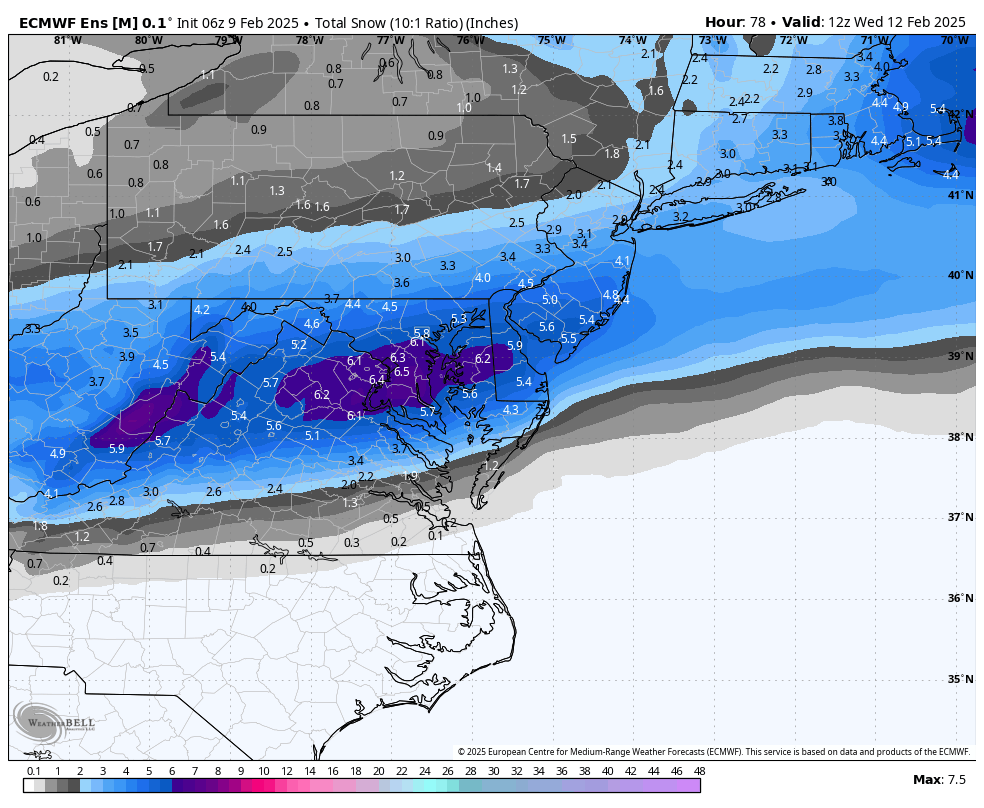
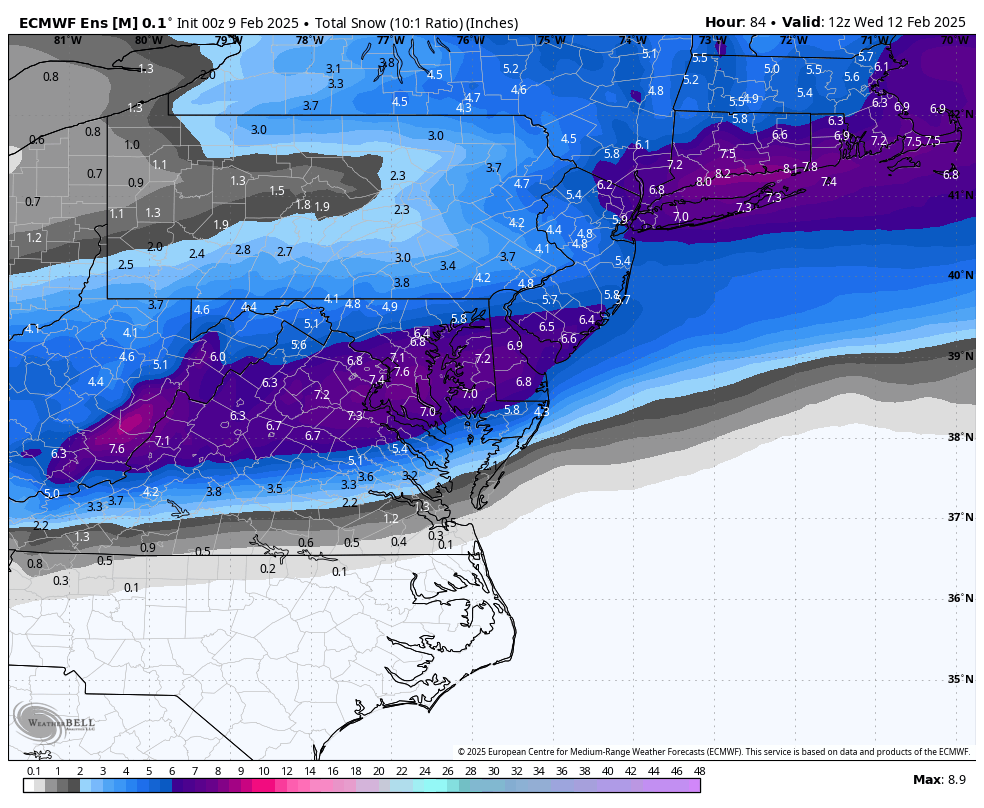
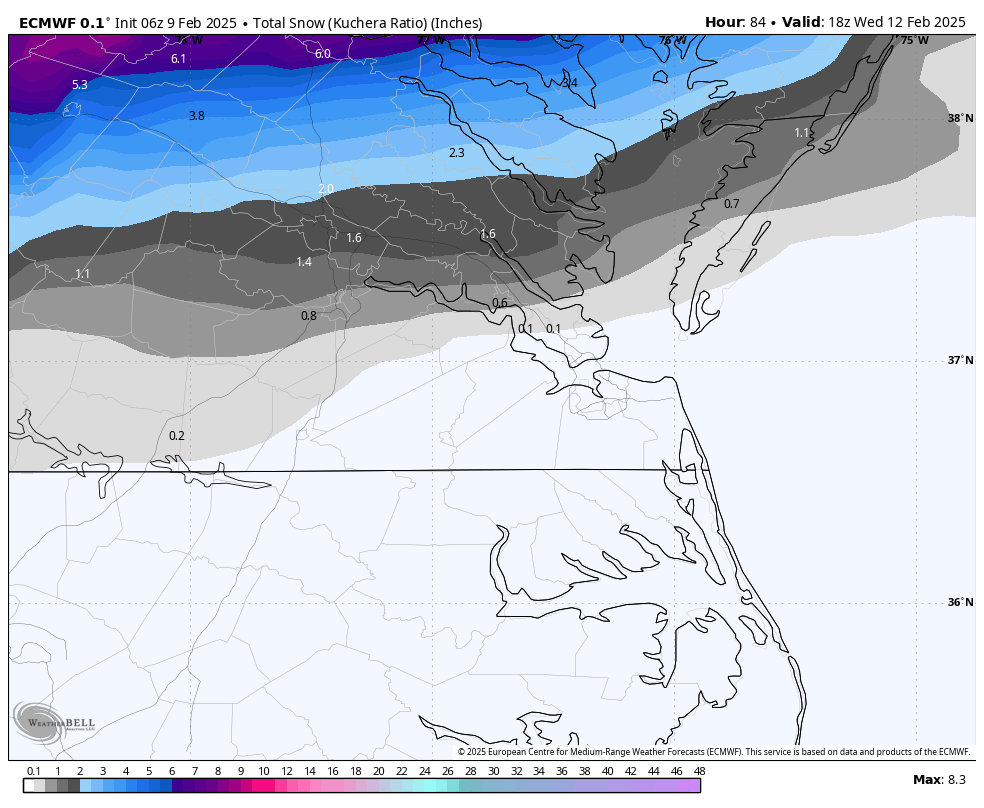
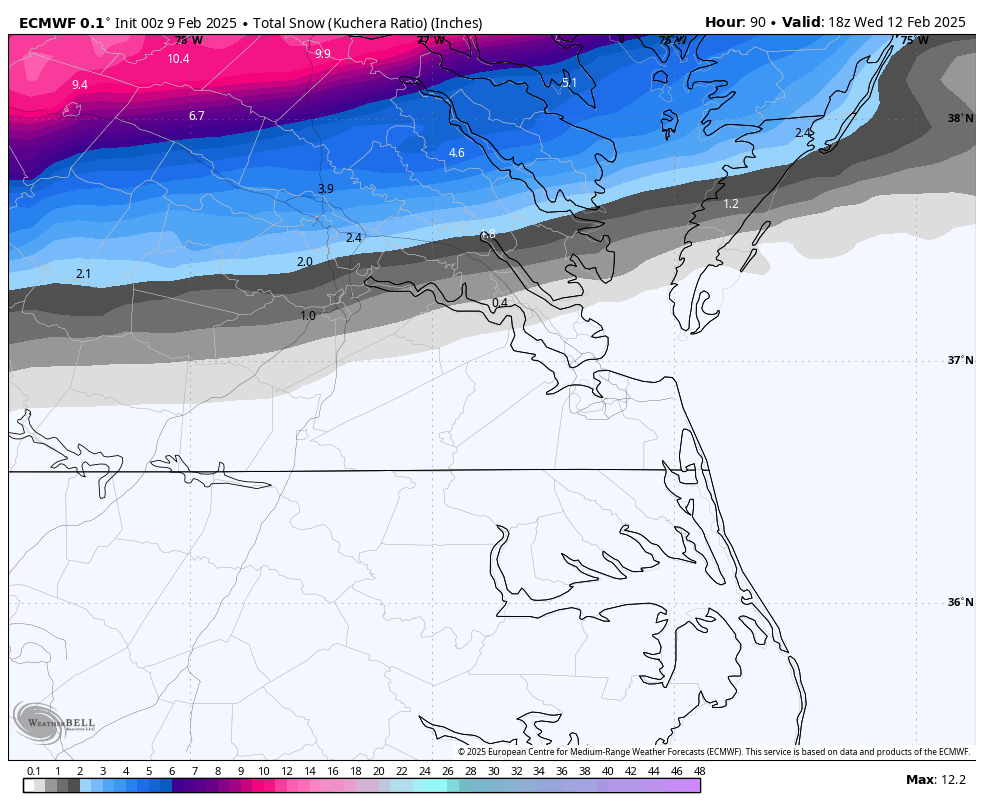
12z vs 6z vs 0z EPS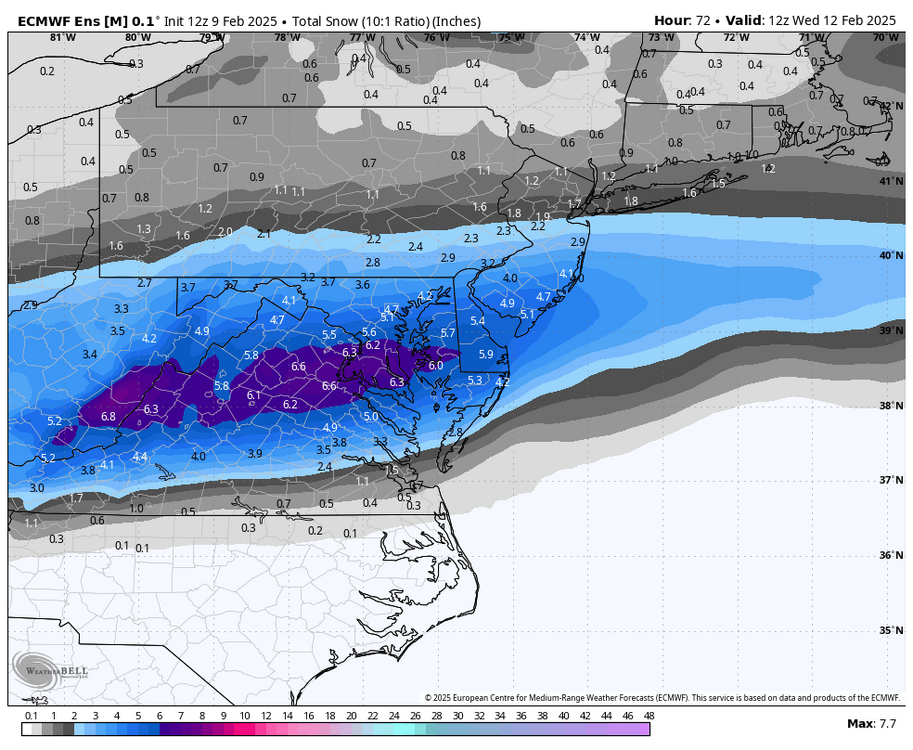

-
Richmond Metro/Hampton Roads Area Discussion
RIC Airport replied to RIC Airport's topic in Mid Atlantic
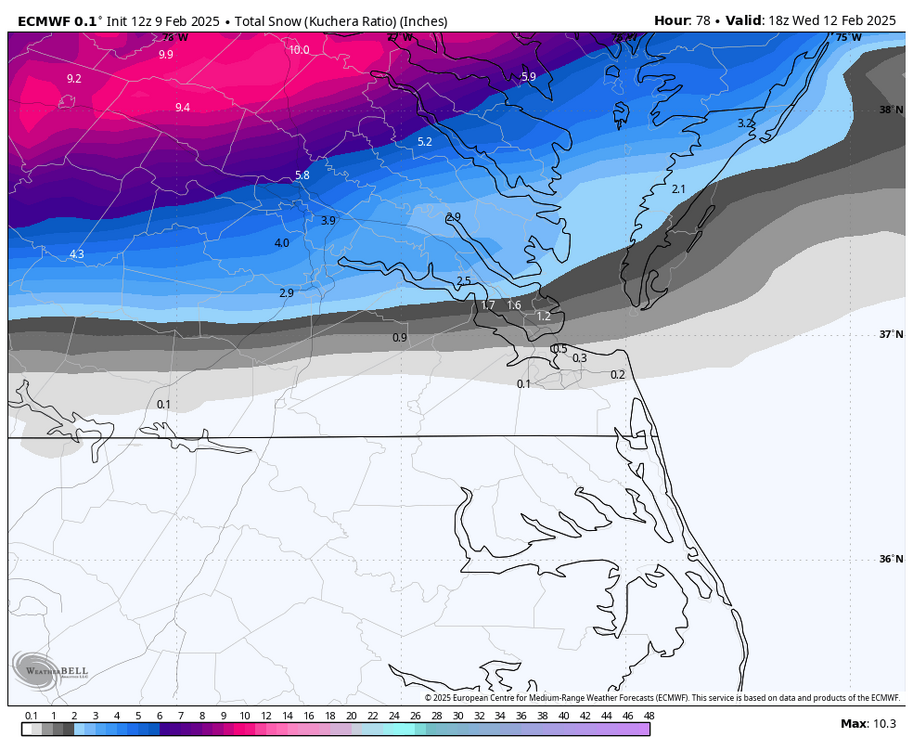
Here are the 12z, 6z and 00z maps for comparison. Euro definitely ticked back south.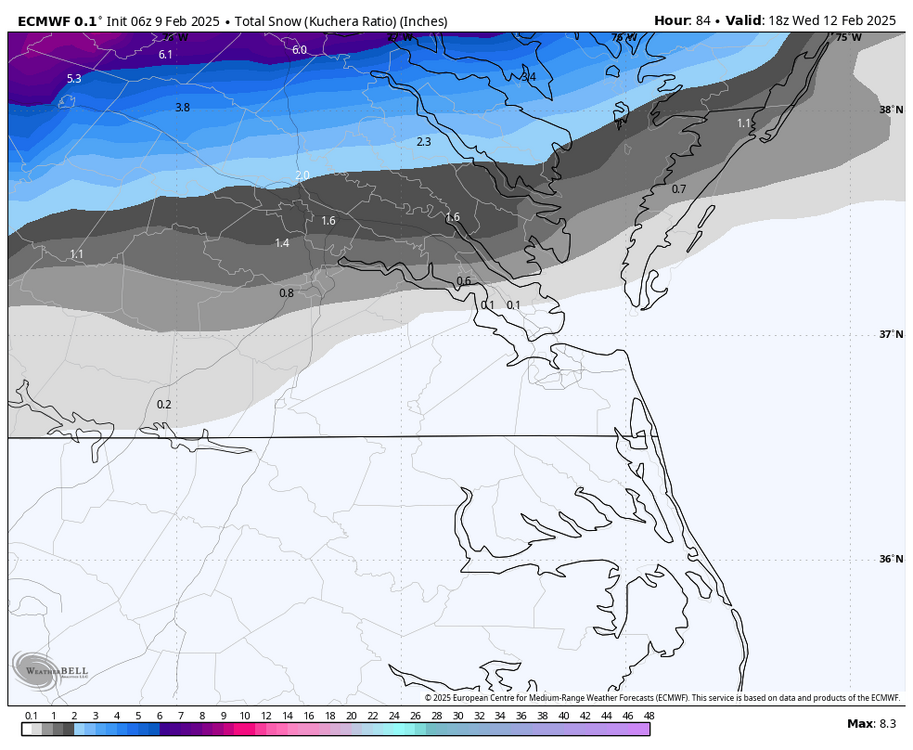

-
Richmond Metro/Hampton Roads Area Discussion
RIC Airport replied to RIC Airport's topic in Mid Atlantic
-
Richmond Metro/Hampton Roads Area Discussion
RIC Airport replied to RIC Airport's topic in Mid Atlantic
I'm liking the Euro so far! -
Richmond Metro/Hampton Roads Area Discussion
RIC Airport replied to RIC Airport's topic in Mid Atlantic
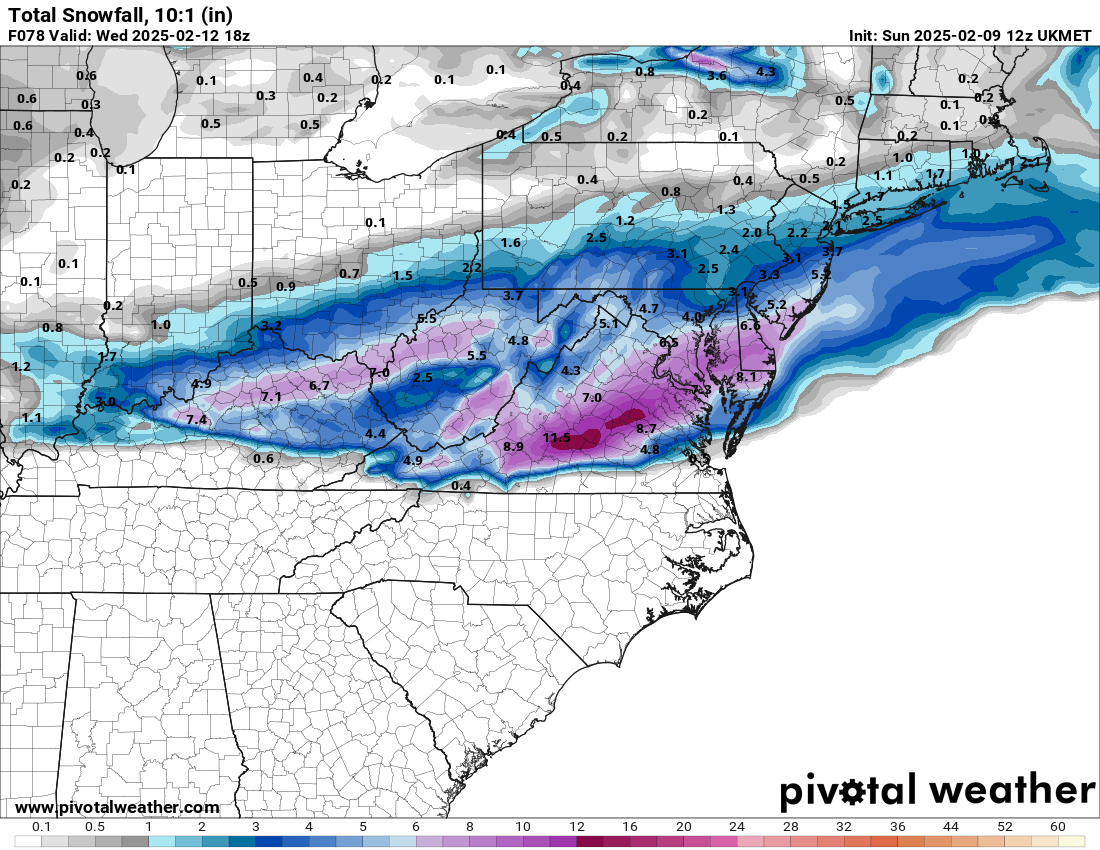
Could the Ukmet portend the 12z Euro? I don't usually look at it, but this is the coldest run in a while.
-
Richmond Metro/Hampton Roads Area Discussion
RIC Airport replied to RIC Airport's topic in Mid Atlantic
ABC 8's map. Not sure if the other channels I posted last night updated or not.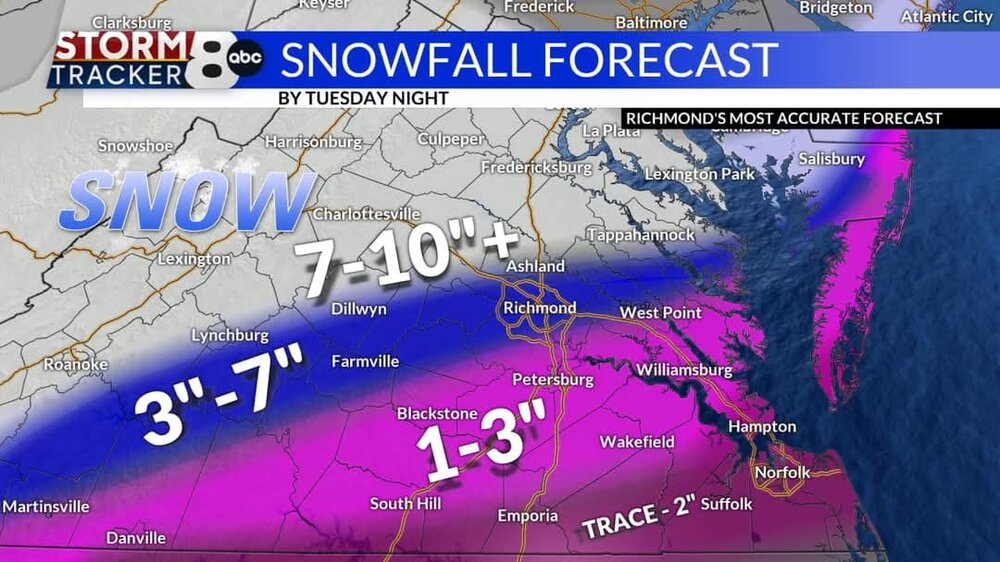
-
Richmond Metro/Hampton Roads Area Discussion
RIC Airport replied to RIC Airport's topic in Mid Atlantic
.thumb.png.46196a9b0de8b732fd2da434b23da6ac.png)
-
Richmond Metro/Hampton Roads Area Discussion
RIC Airport replied to RIC Airport's topic in Mid Atlantic
I have a feeling the GFS will continue to trend farther north, but how much is the question. Accumulations for Richmond are still likely, but 1-3" or 2-4" is probably a good conservative call for now. It all depends on timing and where the heaviest bands set up. An earlier precip arrival Tuesday morning would also help a good deal. -
Richmond Metro/Hampton Roads Area Discussion
RIC Airport replied to RIC Airport's topic in Mid Atlantic
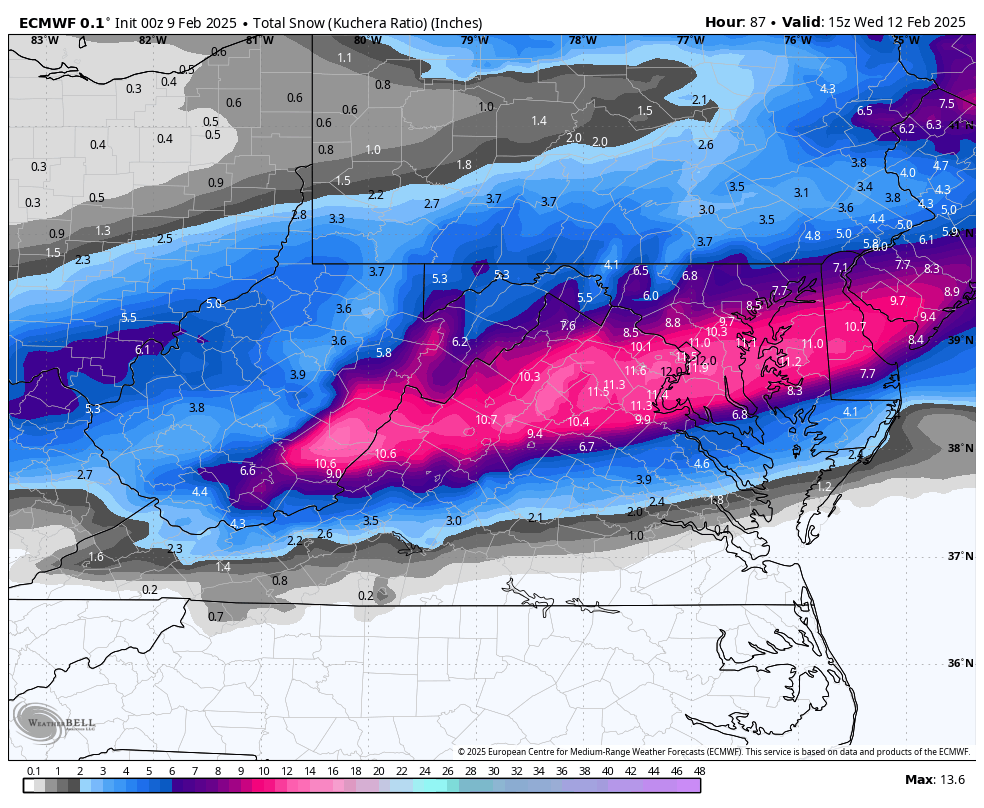
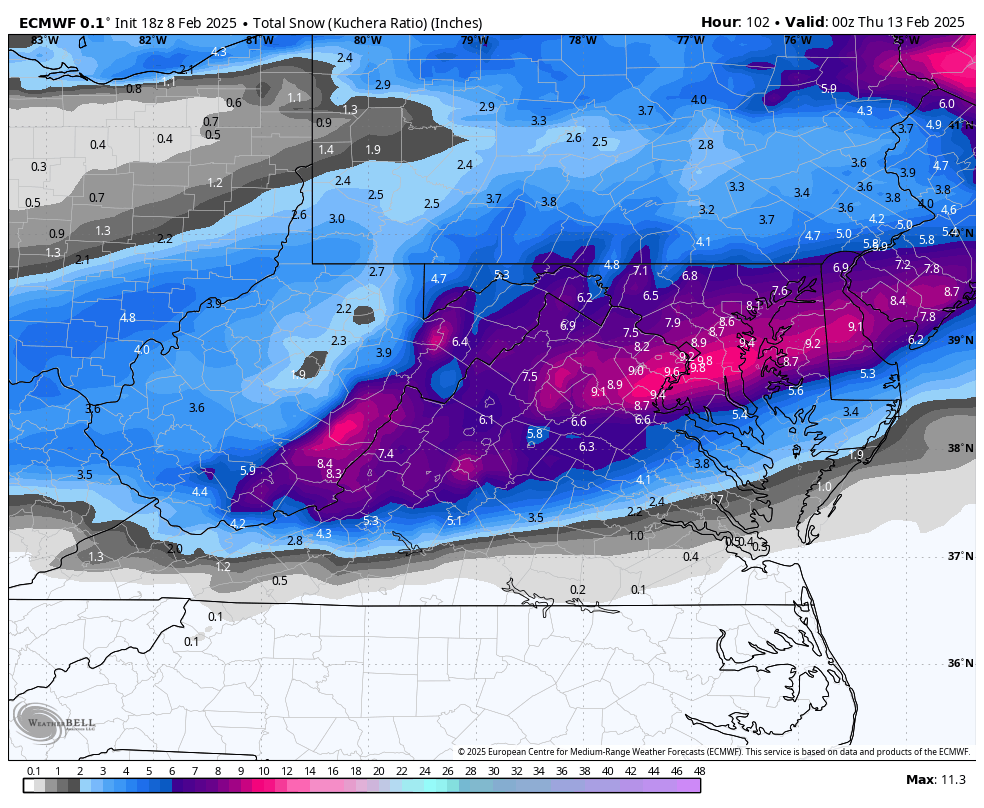
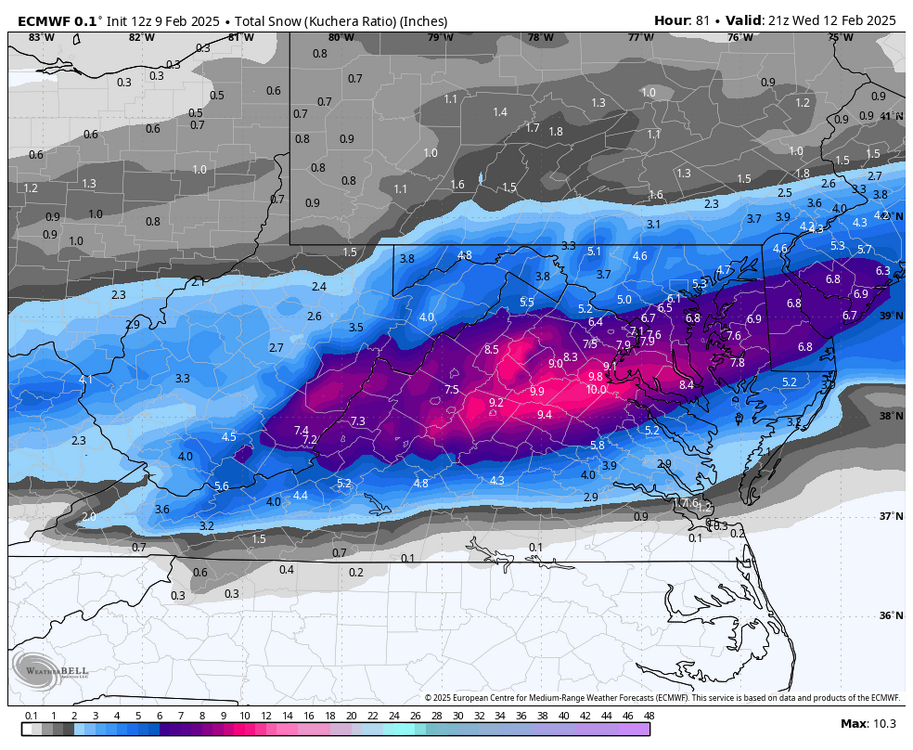
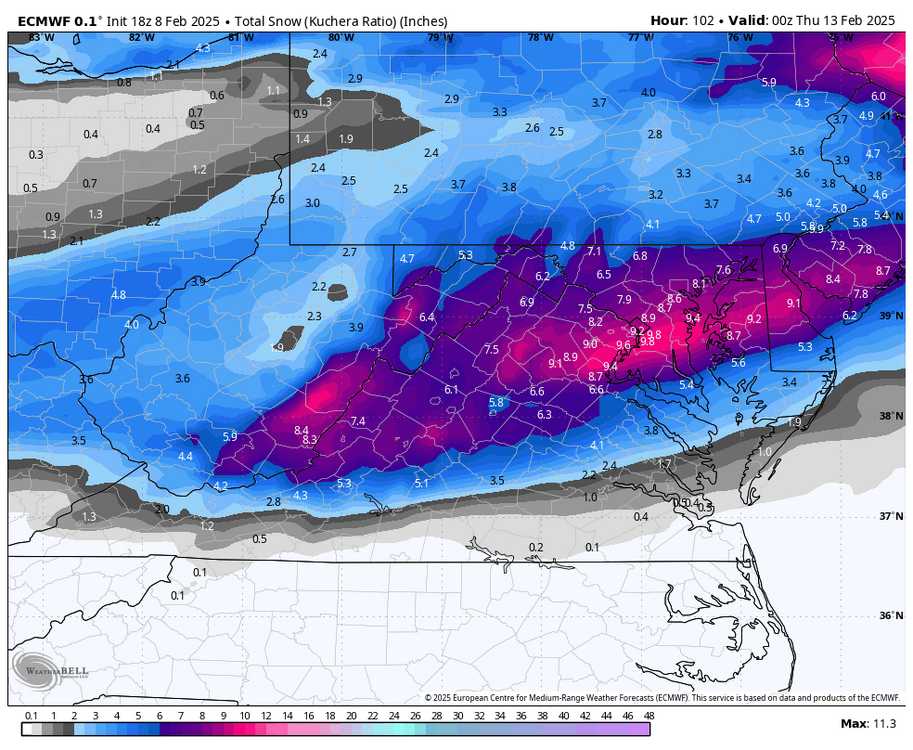
Euro still favoring north of RIC for heaviest snows.
-
Richmond Metro/Hampton Roads Area Discussion
RIC Airport replied to RIC Airport's topic in Mid Atlantic
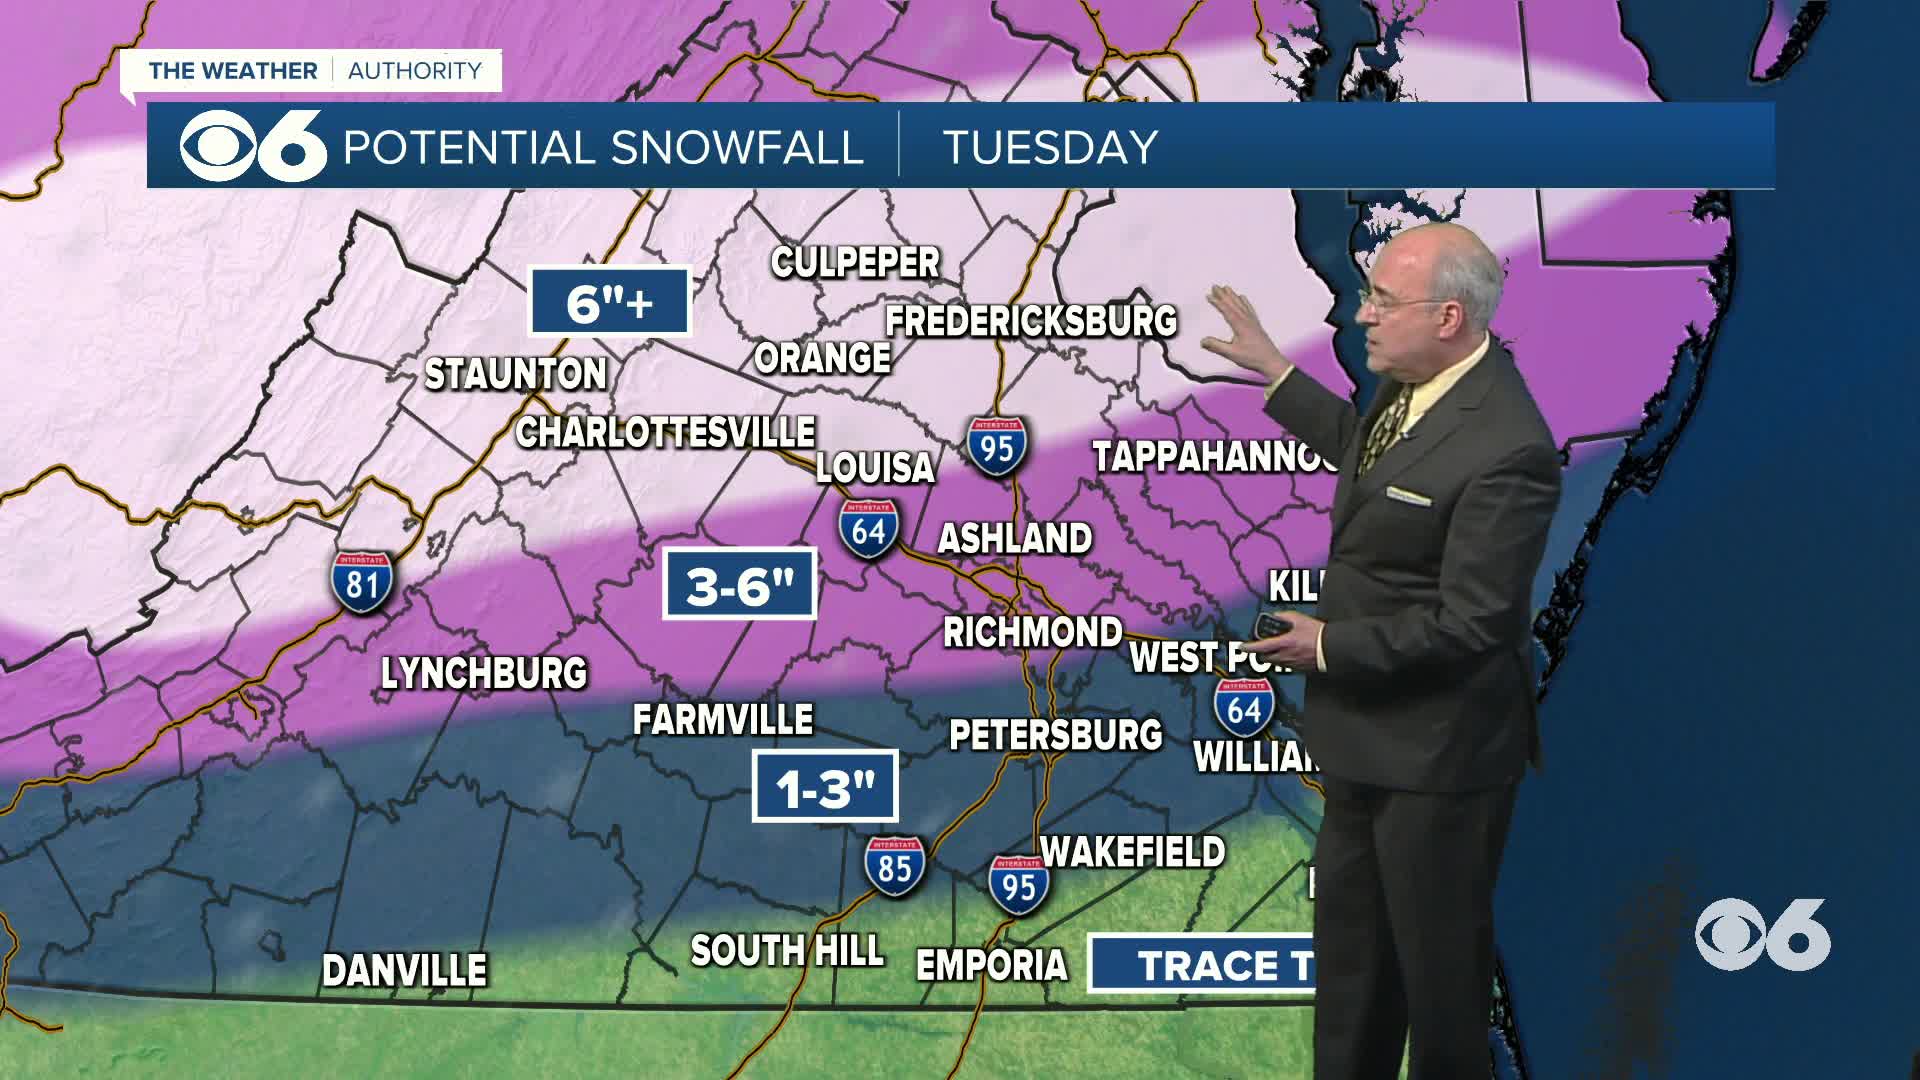
Here is CBS 6's map
-
Richmond Metro/Hampton Roads Area Discussion
RIC Airport replied to RIC Airport's topic in Mid Atlantic
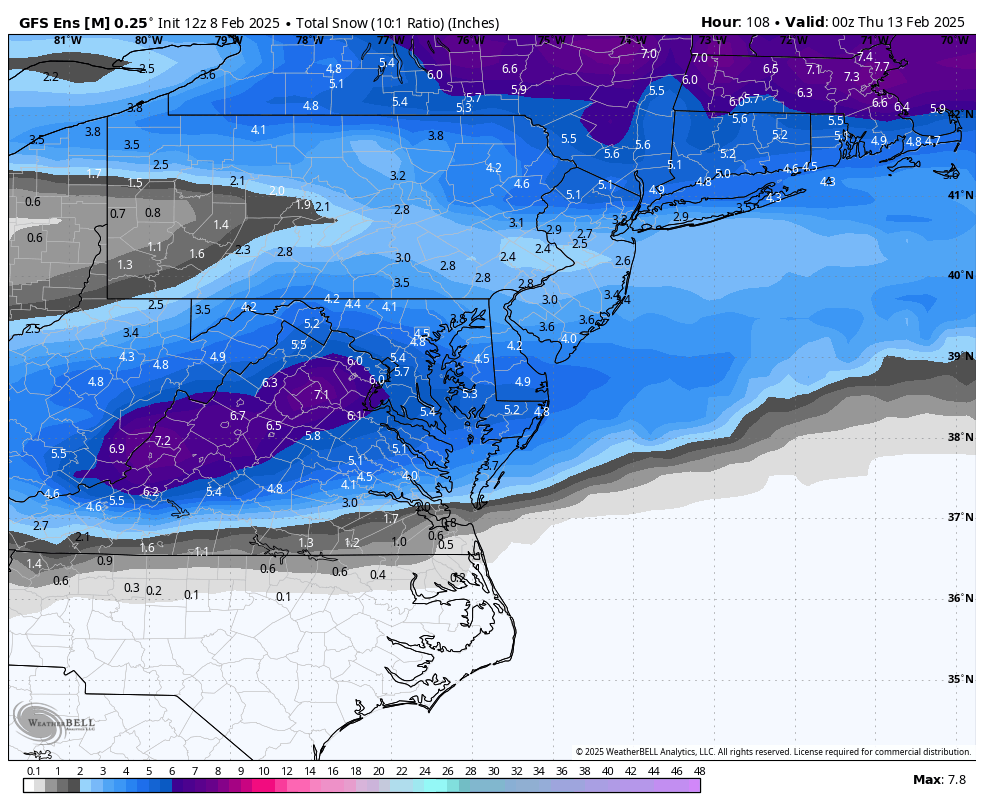
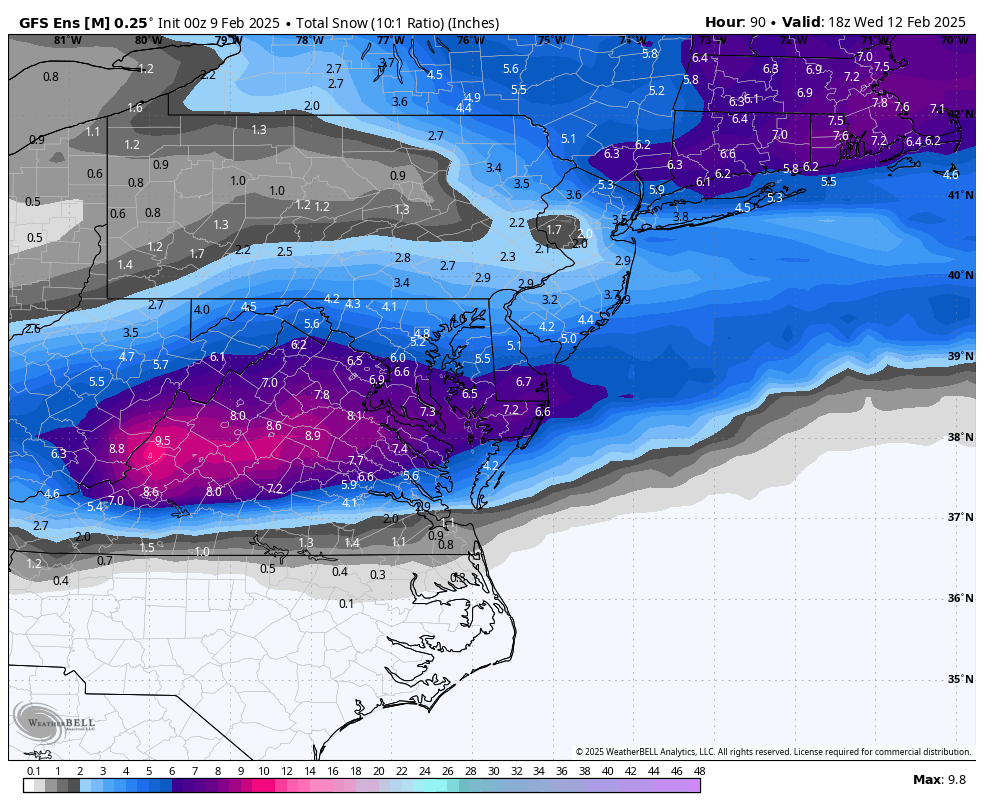
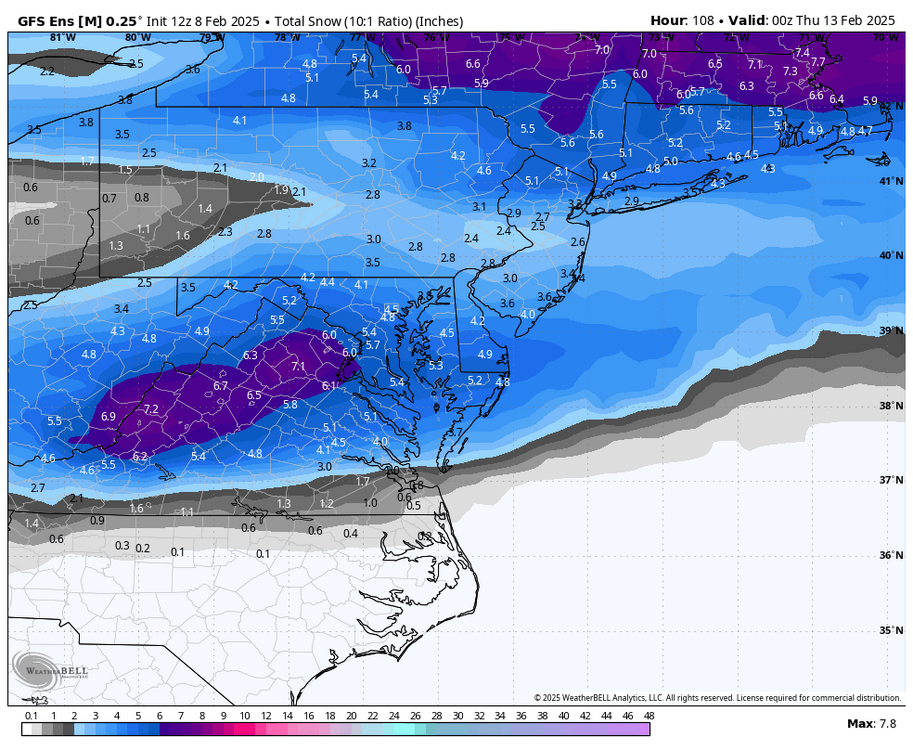
YES! Here are 18z and 12z GEFS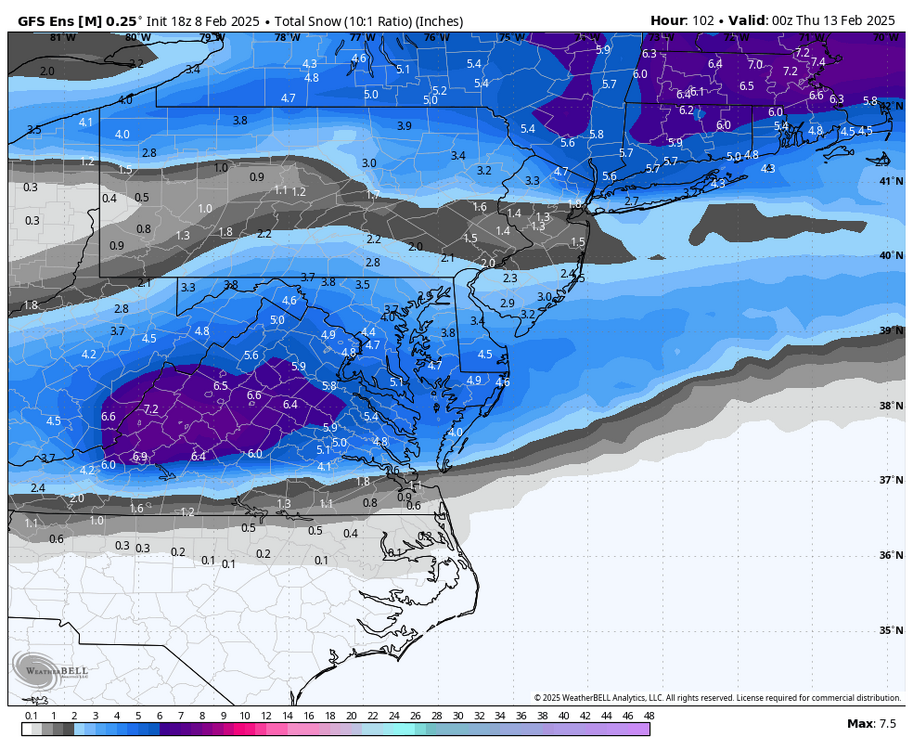
-
Richmond Metro/Hampton Roads Area Discussion
RIC Airport replied to RIC Airport's topic in Mid Atlantic
Thank you. I saw your post. It's crazy sometimes in there. But it's been like that for years, even returning to the Eastern days. We are always in a tough spot. Some people think it just can't possibly snow here like the guy pointing out Richmond's average high for the date, which is like 2 degrees warmer than DCA's, as to say our climate is too warm. Also, many stations have daily snowfall records for 2/12 from 1899 because of that massive east coast blizzard that year. RIC's record for that date is higher than that of DCAs. -
Richmond Metro/Hampton Roads Area Discussion
RIC Airport replied to RIC Airport's topic in Mid Atlantic
The 00z GEFS has a 6-7" mean around RIC.
-
Richmond Metro/Hampton Roads Area Discussion
RIC Airport replied to RIC Airport's topic in Mid Atlantic
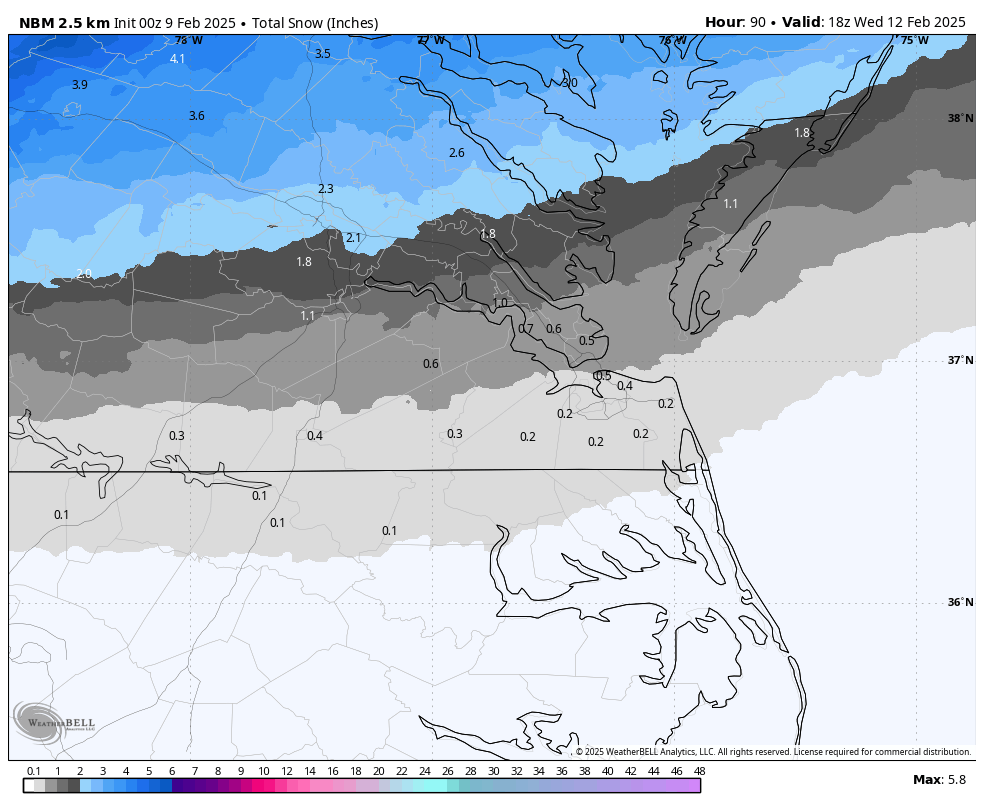
Latest NBM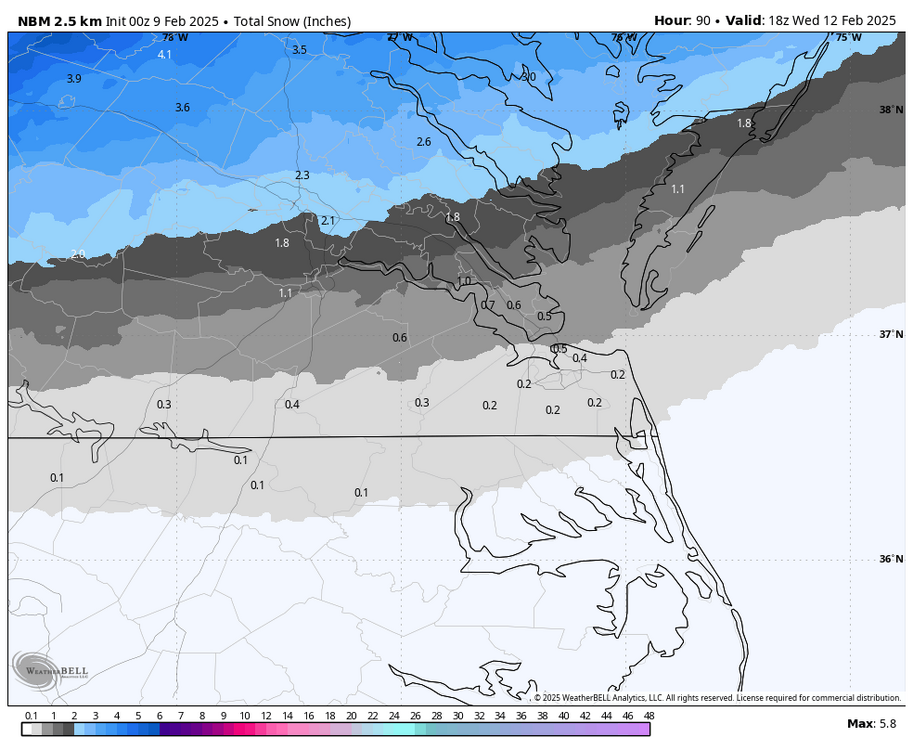
-
Richmond Metro/Hampton Roads Area Discussion
RIC Airport replied to RIC Airport's topic in Mid Atlantic
Timing this run is about 6-7am and surface temps are mostly at 32 during the event. The 850 0C lines creeps close, but remains below freezing.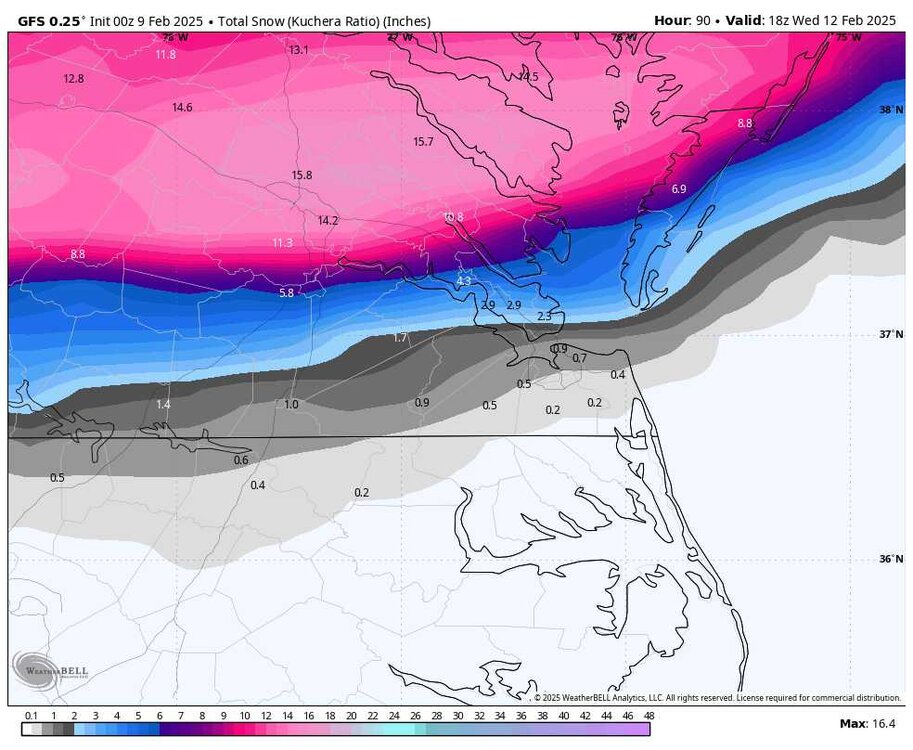

-
Richmond Metro/Hampton Roads Area Discussion
RIC Airport replied to RIC Airport's topic in Mid Atlantic
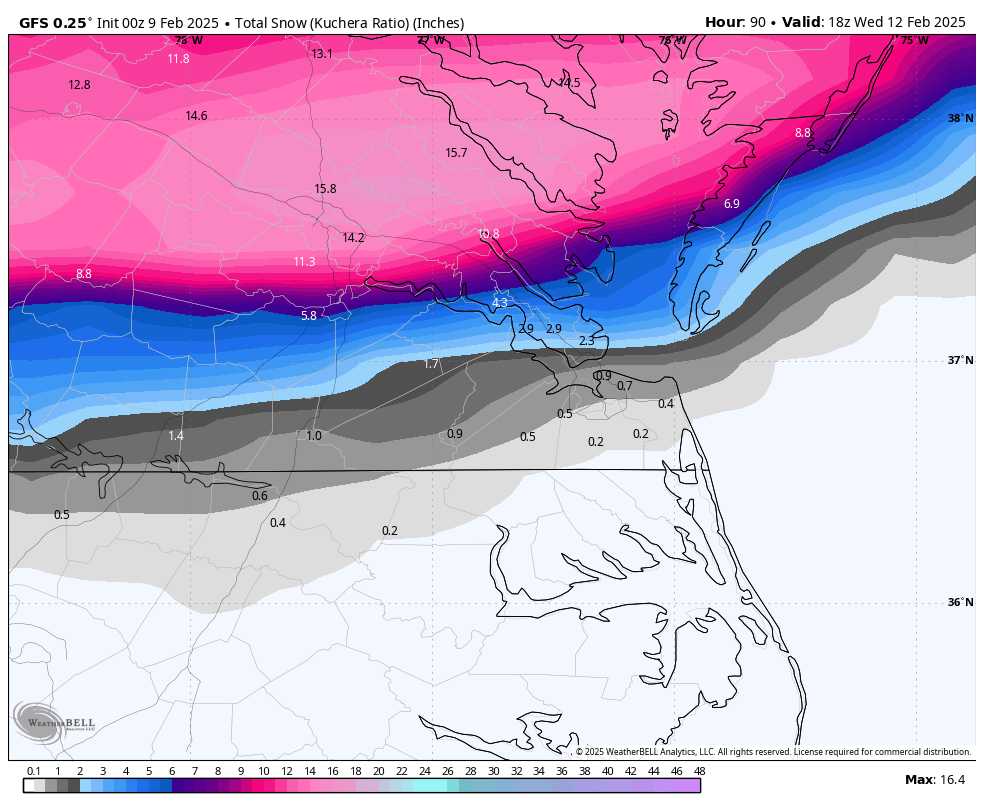
GFS still with its larger totals, but RIC proper has no room for error.
-
Richmond Metro/Hampton Roads Area Discussion
RIC Airport replied to RIC Airport's topic in Mid Atlantic
I know I'll be gone, but this would be wonderful! Just hope 18z Euro isn't the beginning of a trend. @wasnow215cautioned that it may not be after only one run. 00z runs will be interesting. -
Richmond Metro/Hampton Roads Area Discussion
RIC Airport replied to RIC Airport's topic in Mid Atlantic
It's been more consistent so there is that. But, when you look at the ensembles (GEFS/EPS) over the last couple of days, there was always a more northerly signal. -
Richmond Metro/Hampton Roads Area Discussion
RIC Airport replied to RIC Airport's topic in Mid Atlantic
The GFS was on its own being the coldest and farthest south. -
Richmond Metro/Hampton Roads Area Discussion
RIC Airport replied to RIC Airport's topic in Mid Atlantic


.png.88bc33ab97ef9d6f47cd9707fa3b2f2d.png)