GaWx
Members-
Posts
17,532 -
Joined
Content Type
Profiles
Blogs
Forums
American Weather
Media Demo
Store
Gallery
Everything posted by GaWx
-
-
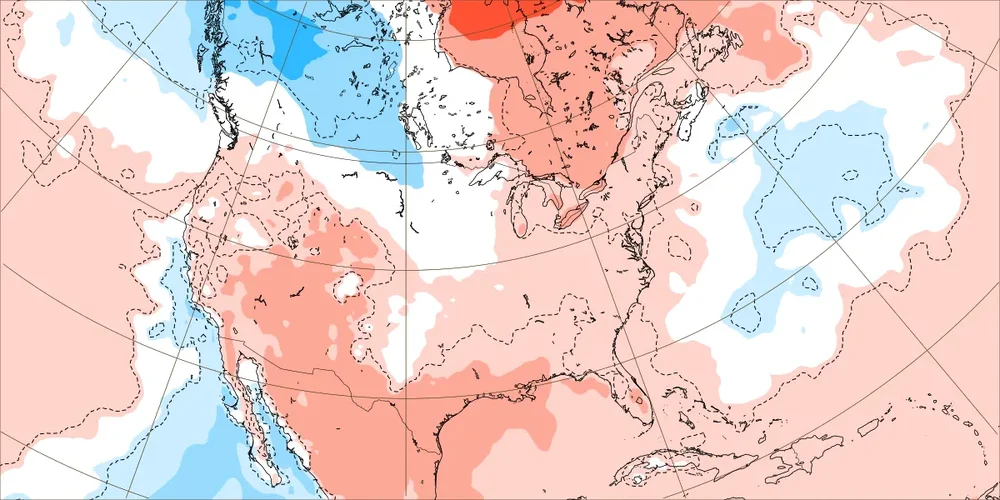
Latest CFS ensemble AAM forecast: fairly similar to prior forecast with largely a moderate +AAM (El Ninoish). Most notable to me is that it hangs on and is even stronger at very late month although that’s a highly fwiw since these CFS forecasts aren’t the least bit reliable that far out: Prior forecast (from one week ago):
-
Bump. -# of NS is at 18, which is 5 below April CSU prediction. -# of NS days is at 78, which is way below the predicted 116 -ACE is at 162, which is way below the predicted 210. So, 2024 was still another extremely April CSU forecast that verified too active.
-
You don’t sound like you’re as much of a pure cold lover (SE brand of cold I mean) as me. It makes me want to go outside and enjoy it. Different strokes for different folks! Happy Thanksgiving, everybody!
-
If it were to end up only 5 days, I’d still be thankful for the 5 days. Any cold is good cold. But it appears to me like more than a total of 5 days is the most likely between now and 11/15 with these days over two different periods.
-
It looks to me like it will be close. Right now I have Nov MTD near the -2.9 to -3.3 range. My best guess is for -3.0 to -3.2. Jul and Aug were in the -2.9s. It appears that Nov was slightly more negative than those two, but the correlation of NOAA to WCS from month to month has been far from perfect. Thus, another in the -2.9s seems like a legit possibility even though I favor sub -3.0 right now. We’ll know pretty soon. If Nov is sub -3.0, it would be only the second time since 1851 for three sub -3 in a row. The only other time was in 1894.
-
NG is now down a whopping 7% since yesterday with a pretty steady drop the last 14 hours. It is now near session lows. Per a pro met friend: MUCH warmer overnight,…! -10 HDDs on the last 0z EPS vs the previous 12z run! Edit: NG closed down 8%! So, this market is seeing either less cold or potentially an earlier end to it.
-
There are still areas with peak autumn leaf color in the Atlanta area.
-
Natural gas (NG) has been down ~4.5-5% for the last few hours vs yesterday with most of drop from late last evening through early this morning. That makes me wonder if EPS and/or GEFS forecasted population weighted US HDDs has dropped notably vs yesterday’s runs.
-
I’m just happy to have the cold for late Nov and a good portion of the first half of Dec. Besides, wintry precip down here is rare and actually doesn’t occur most winters. Dry cold is so refreshing and is great for walking! So, I’m always happy with cold.
-
The EPO as expected dipped sharply to its lowest level in 13 months after being at its highest since June 4th just 5 days earlier: 2024 11 17 232.92 2024 11 18 182.78 2024 11 19 30.24 2024 11 20 -168.33 2024 11 21 -243.29 2024 11 22 -258.96 2024 11 23 -229.99
-
If the global tropics were averaging +4.5C but Nino was only at +2.3C, would you still be thinking of it as a super El Niño other than “in name”? Do you at least see my point?
-
But if the global tropics were averaging +4.5C but Nino 3.4 were only at +2.3C, why does 3.4 being at +2.3 really matter from El Niño perspective when it is actually a cold area of water relatively speaking and thus should act like La Niña?
-
I don’t disagree with what you wrote here from an “official” standpoint or “in name only”. But for all practical purposes, RONI is the more accurate metric imho because of where the SSTs in other tropical regions are is very important to consider. I’ll do an extreme hypothetical example to illustrate. Let’s say the average global tropical SST anomaly were +4.5C. And let’s say Nino 3.4 were at +2.3. Officially or in name only it would be a super Nino since it was at +2+. But, for all practical purposes it would actually be a super Niña because 3.4 was 2.2C colder than overall tropical waters. For that metric what’s important is how 3.4 is on a relative basis, which is what I mean by “for all practical purposes.” There’s really nothing El Niño about having a +2.3 in 3.4 other than “in name only” if the surrounding waters are averaging +4.5. In fact it is the opposite. @PhiEaglesfan712
-
For all practical purposes, I say yes. Actually, for all practical purposes, 1991-2 was a solid super-Nino with a +2.3 trimonthly peak per RONI along with 4 trimonthlies in a row of +2+. So, not just a borderline super.
-
Yes, 2023-4 was officially a borderline super event or a super “in name only”. But it was only a borderline moderate/strong El Niño at most for all practical purposes when taking the overall tropical waters’ warming into account. For a similar reason, we’re currently for all practical purposes in a weak La Niña even though officially it may end up cold neutral.
-
Natural gas opened up a whopping 7% this evening! With the ensembles still looking cold dominated, with no end yet in sight, and with NG having closed close to 7% off its highs on Fri, that actually isn’t a shock. So, now it is back up to near its Thu evening highs in the 3.50s.
-
Here are today’s CPC days 8-14 analogs. Note the bolded, 19891221. That as many in this region know was when there was a very rare/historic SE coastal heavy snowstorm along with extreme cold for a deep SE snow (temperatures in the lower 20s with lots of wind): 19561129 19851221 19881208 20081130 19581212 20021128 19891221 19561124 19761124 19881213
-
19891221 (bolded) was when there was a very rare/historic SE coastal heavy snowstorm along with extreme cold for a deep SE snow (temperatures in the lower 20s with lots of wind).
- 409 replies
-
- 3
-

-
Per 12Z EPS fwiw, this (Gulf Miller A coming across over FL pen. and then offshore SE US with it cold enough to north) on the Euro op. is as one would expect currently only a very low probability scenario: I not surprisingly count only 3 of 50 members with something fairly close in track during a similar timeframe (members 16 and 34 have sig snow like op while member 32 has only very light snow): so only 6% of members. Member 43 track is inland and produces sig snow but further NW. If I count that it’s 4/8% of members. Also, member 34 actually has a second further SE tracking Miller A two days later that gives heavy snow to the SE coast similar to the very rare pre-Christmas Dec 1989 and early Jan 2018 historic heavy coastal snowstorms. As this period gets closer we’ll see how the various ensembles trend. I think this type of analysis is what was requested by @olafminesaw
-
This is day 10 on 12Z Euro with a weak Miller A Gulf low: so still in fantasyland/low statistical credibility period on an operational and thus mainly for entertainment showing a near best case scenario kind of thing (next run very likely won’t look similar):
-
New Euro Weeklies: 1. This week (12/2-8) coldest yet: just 6 days ago was mainly slightly AN 2. Following week (12/9-15) coldest yet: 4 days ago was mild 3. Week of 12/16-22 coldest yet (NN)
-
Makes sense: -Last time RDU got measurable Dec 1-15: 2018. -Only times since 2000 with 1”+ Dec 1-15: 2018, 2002
-
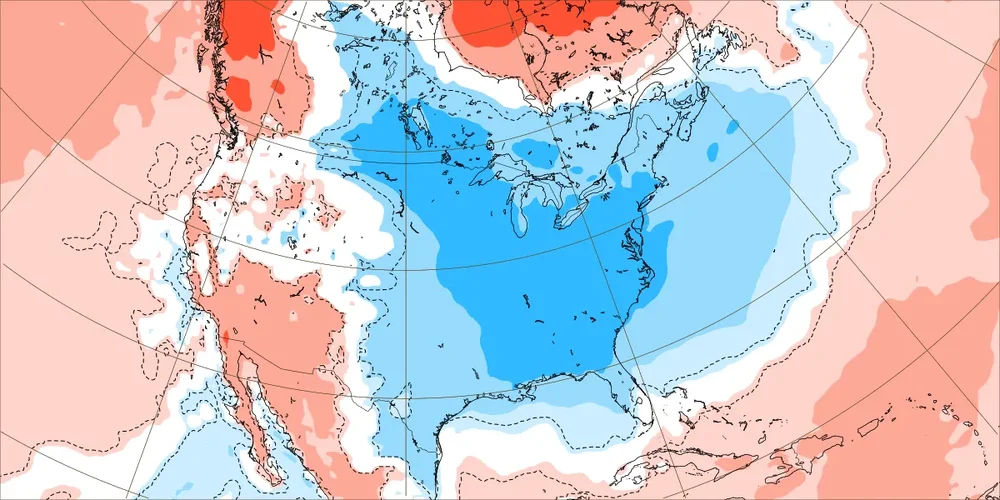
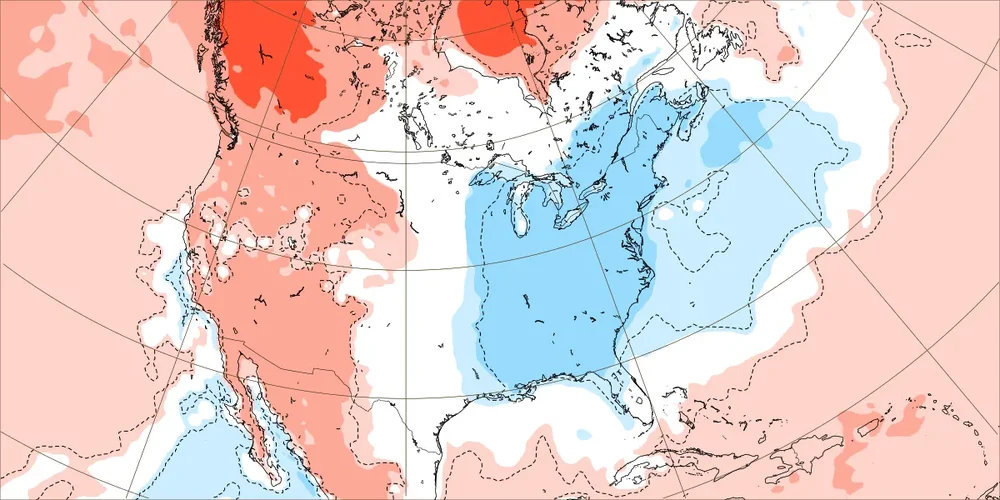
Note the change in the 3 day averaged 4 member CFS within just the last week: shows how blind it apparently (i.e., assuming they’re now on track) was just 2.5-3 wks out: As of one week ago for 11/30-12/6: Current for 11/30-12/6: In addition the subsequent fcast week, 12/7-13, has cooled almost as dramatically. However, the subsequent two weeks covering most of last half of Dec along with last 4 days of Dec have remained ~same (mainly mild) and the resulting in a near to slightly above normal Dec overall: NYC now at ~1991-2020 climo vs ~+2 as of a week ago: (Jan now coolest of DJF and Feb warmest) Will last 1/2 of Dec eventually cool off, too, or is this cold period going to end up being just in 1st half of Dec? Any educated guesses?
-
The 12Z EPS is about as cold as any through day 12 (Dec 4th). The rest of the run is a bit warmer than recent runs but is still cold overall along with reinforcing cold at the end (12/7).


