

beavis1729
-
Posts
2,428 -
Joined
-
Last visited
Content Type
Profiles
Blogs
Forums
American Weather
Media Demo
Store
Gallery
Posts posted by beavis1729
-
-
2 hours ago, Modfan2 said:
Was that the year it never got above 0?
12/24/1983 was one of the coldest days on record in Chicago. High -11, low -25.
-
12 minutes ago, SJonesWX said:
settle down Beavis
You rang?

George's post got 16 hot dogs - could be a new record!
") All in good fun.
All in good fun.
-
 5
5
-
-
52 minutes ago, ORH_wxman said:
Dec '81 is actually not a terrible analog either for this pattern. I think late Dec '10- early Jan '11 is a better one, but Dec '81 had that block dominating the pattern for weeks.
Parts of Dec 1995 are a good match too.
And then some insane cold in January 1982.
-
 1
1
-
-
54 minutes ago, Hoosier said:
As far as what I'd go with, it's a tough one. Nothing clearly jumps out for me where I'm like 'yeah, that's definitely the one.' Perhaps it would be 1/2/99. There was just something a little extra special about that... following it in the days before and then watching it come to fruition.
Yeah, I’d put 1/2/99 at the top for those same reasons. #2 would be the super bowl storm in 2015…an incredibly wintry scene that kicked off the very cold month of Feb 2015. #3 would be 2/2/11 (GHD 1). #4 is 1/30/19, extreme cold and wind chills around -50.
-
1
-
-
2 hours ago, Hoosier said:
Hey beavis, here's some research for ya.
Yesterday was just the 5th time on record that Chicago has had a 70/60 day on 11/10 or later. And it had been 70 years since it happened.
11/11/1882: 72/62
11/12/1902: 70/62
11/21/1913: 72/62
11/17/1952: 74/60
11/10/2022: 76/60
Nice…and funny that all of those temps are even numbers. Very difficult to have a 60+ min this time of year, with the long nights.
-
2 hours ago, Chicago Storm said:
Record broken here at ORD. Peak of 76 so far.
This is Chicago's 2nd warmest temp on record for so late in the season (it was 78 on 11/14/1971).
Also, if the cold front can hold off until after midnight, the record high min for November 10th will be shattered...which is amazing with a 150+ year POR. Current record is 52 set in 1949. Today's min (so far) has been 62.
-
^ Very impressive airmass. Mason City IA dropped to 15, tying the coldest on record so early in the season (it was 15 on this date in 1972). Records go back to 1893.
Only hit 30 here, as it was too windy and cloudy for much of the overnight.
-
On 10/10/2022 at 4:40 PM, Hoosier said:
Funny thing about that one is that while the amount of snow was nice, the thing I think of right away is the immediate plunge into bitter cold at the tail end of the storm and after, which resulted in the roads being absolute trash even days after the storm ended.
Yeah…even though we’ve certainly had colder temps (1/31/2019 as a recent example), I’d have to say the morning of 1/6/2014 was the most “arctic tundra” feeling I’ve ever experienced here. About 15” of snow on the ground, cloudy skies, gusty winds and blowing snow, and temps around -17. An incredible airmass, as you don’t often get temps that low here without high pressure and clear skies.
-
38 here, pretty chilly for September in these parts.
-
34 minutes ago, cptcatz said:
I think what he's trying to say is that right now (as of 10pm), the NHC is saying that this storm is producing surface level sustained winds of 100 mph somewhere. You don't need recon planes or satellites or models to tell us that. The storm is well inland in a populated area. If the storm is actually producing 100 mph sustained winds, we would know. But it's not. So what is the NHC telling us? That if this same storm were over open water then it would be producing 100 mph winds? What good is that? Why not just use actual surface wind measurements to tell us what the storm is currently doing?
When NHC says “max sustained winds of 105 mph”, that could be based on extrapolation or other estimates…as there may not be reliable surface obs in the exact/tiny spot where the max sustained winds are occurring.
Usually, the max sustained wind values are very localized in a hurricane. Most areas “near” the eye wall (and even this covers a small geographic area) are probably 70-90 mph. The max of 105 mph could be a very tiny surface area on the ground (and therefore likely missed by obs)…but could still technically be correct because of the word “max”…even as it’s actually not experienced by a lot of people.
The exact words are very important here. I agree there could probably be more accurate and meaningful ways of communicating the areas of higher sustained winds for a hurricane…but people are drawn to the “max” because it’s sexier.
Just my two cents.
-
On 9/17/2022 at 4:30 PM, Hoosier said:
Have an idea for a winter thread that I'm pretty sure we haven't done before. Should I present it now or wait until, you know, winter?
Go for it.

As with every thread, people can participate (or not) at their discretion.
-
The heat out west over the past week has been remarkable.
One example - before this year, Salt Lake City's September record high was 100F. They broke it on 9/1 (102F), then broke it again on 9/3 (103F), then again on 9/5 (104F), then again on 9/6 (105F), then again on 9/7 (107F).
-
1
-
-
While I acknowledge the explanation about how the daily temperature curve differs in Phoenix vs. Chicago (which is interesting and makes sense), the high overnight temps in the heat island of Phoenix metro have a huge impact on those who are more vulnerable. The body doesn't have a chance to recover when there is a prolonged stretch of very warm nights; it's not just the hot afternoons that are dangerous for humans.
In Chicago's 1995 heat wave, I believe studies showed that many of the 700+ deaths occurred because there was no relief at night.
-
2
-
-
3 hours ago, donsutherland1 said:
Phoenix recorded just its 7th 95-degree low on record this morning. Records go back to August 1895.
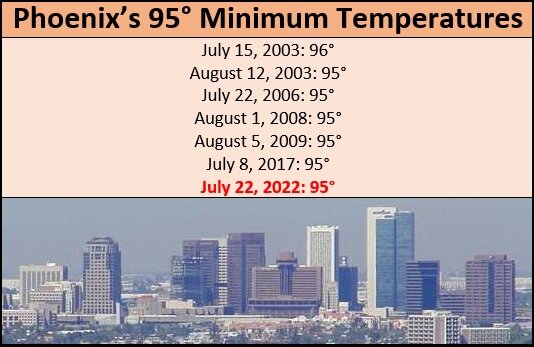
What's amazing (bad) is that every single min temp of 93+ in their historical record has occurred since 2003.
And, in the entire 75-year period up through 1969, there were only two min temps of 90+ (one day with 90, one day with 91).
-
1
-
-
5 hours ago, aggiegeog said:
Gonna be a lot of sites in Northwest Texas with highs over 115F today. The swath from San Angelo north to Wichita Falls is the epicenter.
TX/OK high temps today:
Wichita Falls 115
Lawton 114
Denton 111
Abilene 110
OKC 110 (only their 12th 110+ day on record; first since 2012)
DFW 109
San Angelo 108
-
1
-
-
1 hour ago, Hoosier said:
It got to 110 in OKC today for only the 12th time on record and the first since 2012.
And 115 in Wichita Falls TX
-
7 hours ago, Powerball said:
Also, it is now the hottest day of the year at DFW with a current temp of 108*F. Record high is 110*F set back in 1980, which might be tied or broken.
DFW peaked at 109. Still 96 at 11 pm local time.
-
6 hours ago, Powerball said:
In theory, the low would be 86*F at DFW (another record maximum), but of course a couple of rogue rain shower has billowedvup across thr Metroplex. So that might take a hit.
Looks like the low is still 86, so far. if it holds, it will tie DFW's highest daily min in recorded history, going back to 1898.
86 on 7/27/2018
86 on 8/16/2011
86 on 8/4/2011
86 on 8/3/2011
86 on 7/26/2011
-
108 in Hobart OK right now. They should hit 110-115 Monday and Tuesday.
If OKC reaches 110 over the next couple of days, it will be their hottest temp since 8/3/2012 (113).
-
55 minutes ago, Hoosier said:
 That would be extremely impressive even if you cut it by several degrees.
Definitely...as record highs in OKC (as an example) are 108-110 for July 18-20.
NWS Tulsa:
Ridge aloft quickly strengthens across the region by Monday and
likely maintains the dominate influence through much of next week.
Deterministic guidance raw sfc temps generates extreme heat
values next week, and while errors are likely large at this time
range, the more reasonable bias corrected blend still produces
high confidence for high temps in the 100 to 110 range for
several days across the forecast area. No meaningful rainfall is
expected through the forecast period and drought conditions will
continue to intensify.
-
Only 5 days out...12z GFS:

-
1
-
-
2 hours ago, A-L-E-K said:
best climo

Morning lows too warm for best climo - lake influence and UHI.
-
3 hours ago, Hoosier said:
GFS trying to bring back the death ridge in the super extended.

We need to get death ridged at some point. It's not right for the areas west of us to bear the burden alone. We need to feel what they are feeling.
12z GFS shows high temps of 105-115 in Oklahoma for a week straight. Bring back the 1930s.
-
1
-
-
48 minutes ago, Hoosier said:
Oh my God, I actually posted that.


Winter 2022/23 Medium/Long Range Discussion
in Lakes/Ohio Valley
Posted
You'd think this would be a great look in the MW/GL, given the mean trough being in a decent spot (a bit west) to avoid storms being suppressed. But it seems like no Day 8+ fantasy storms are showing up on the op runs yet.
Or, my interpretation of the map could be wrong...