heavy_wx
-
Posts
1,628 -
Joined
-
Last visited
Content Type
Profiles
Blogs
Forums
American Weather
Media Demo
Store
Gallery
Everything posted by heavy_wx
-
January Storm Term Threat Discussions (Day 3 - Day 7)
heavy_wx replied to WxUSAF's topic in Mid Atlantic
Lovely bifurcation of the mid-level flow! The resulting confluence promotes anticyclogenesis south of James Bay and cold-air damming into the mid-Atlantic.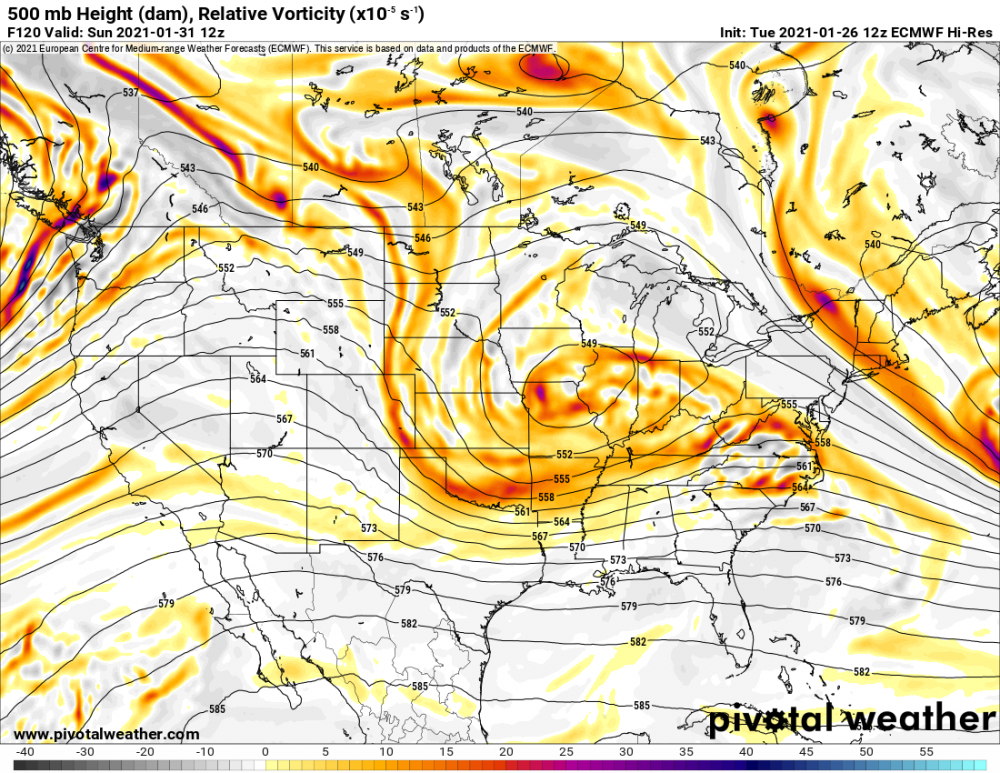
-
Light to moderate snow here with a coating on the ground.
-
January Storm Term Threat Discussions (Day 3 - Day 7)
heavy_wx replied to WxUSAF's topic in Mid Atlantic
Good question; I'm not sure if the differences in the shortwave evolution are caused by something inherent in the model dynamics or differences in the model initial conditions. -
January Storm Term Threat Discussions (Day 3 - Day 7)
heavy_wx replied to WxUSAF's topic in Mid Atlantic
Yes, the GFS keeps the 500-mb shortwave mostly coherent as it propagates from AZ on 12z Tuesday to the OH river valley, where it acquires a negative tilt.The shortwave on the Euro loses its coherence over the southwest, keeping some of the energy delayed as the feature moves eastward. The result is a flatter, positively tilted shortwave that produces less favorable interaction with the developing surface low. There's definitely potential with this system for snow in the mid-Atlantic, but I think there's too much uncertainty right now in how these features will evolve to be confident in any operational model solution. -
Dec 16-17 Storm OBS Thread
heavy_wx replied to BuffaloWeather's topic in Upstate New York/Pennsylvania
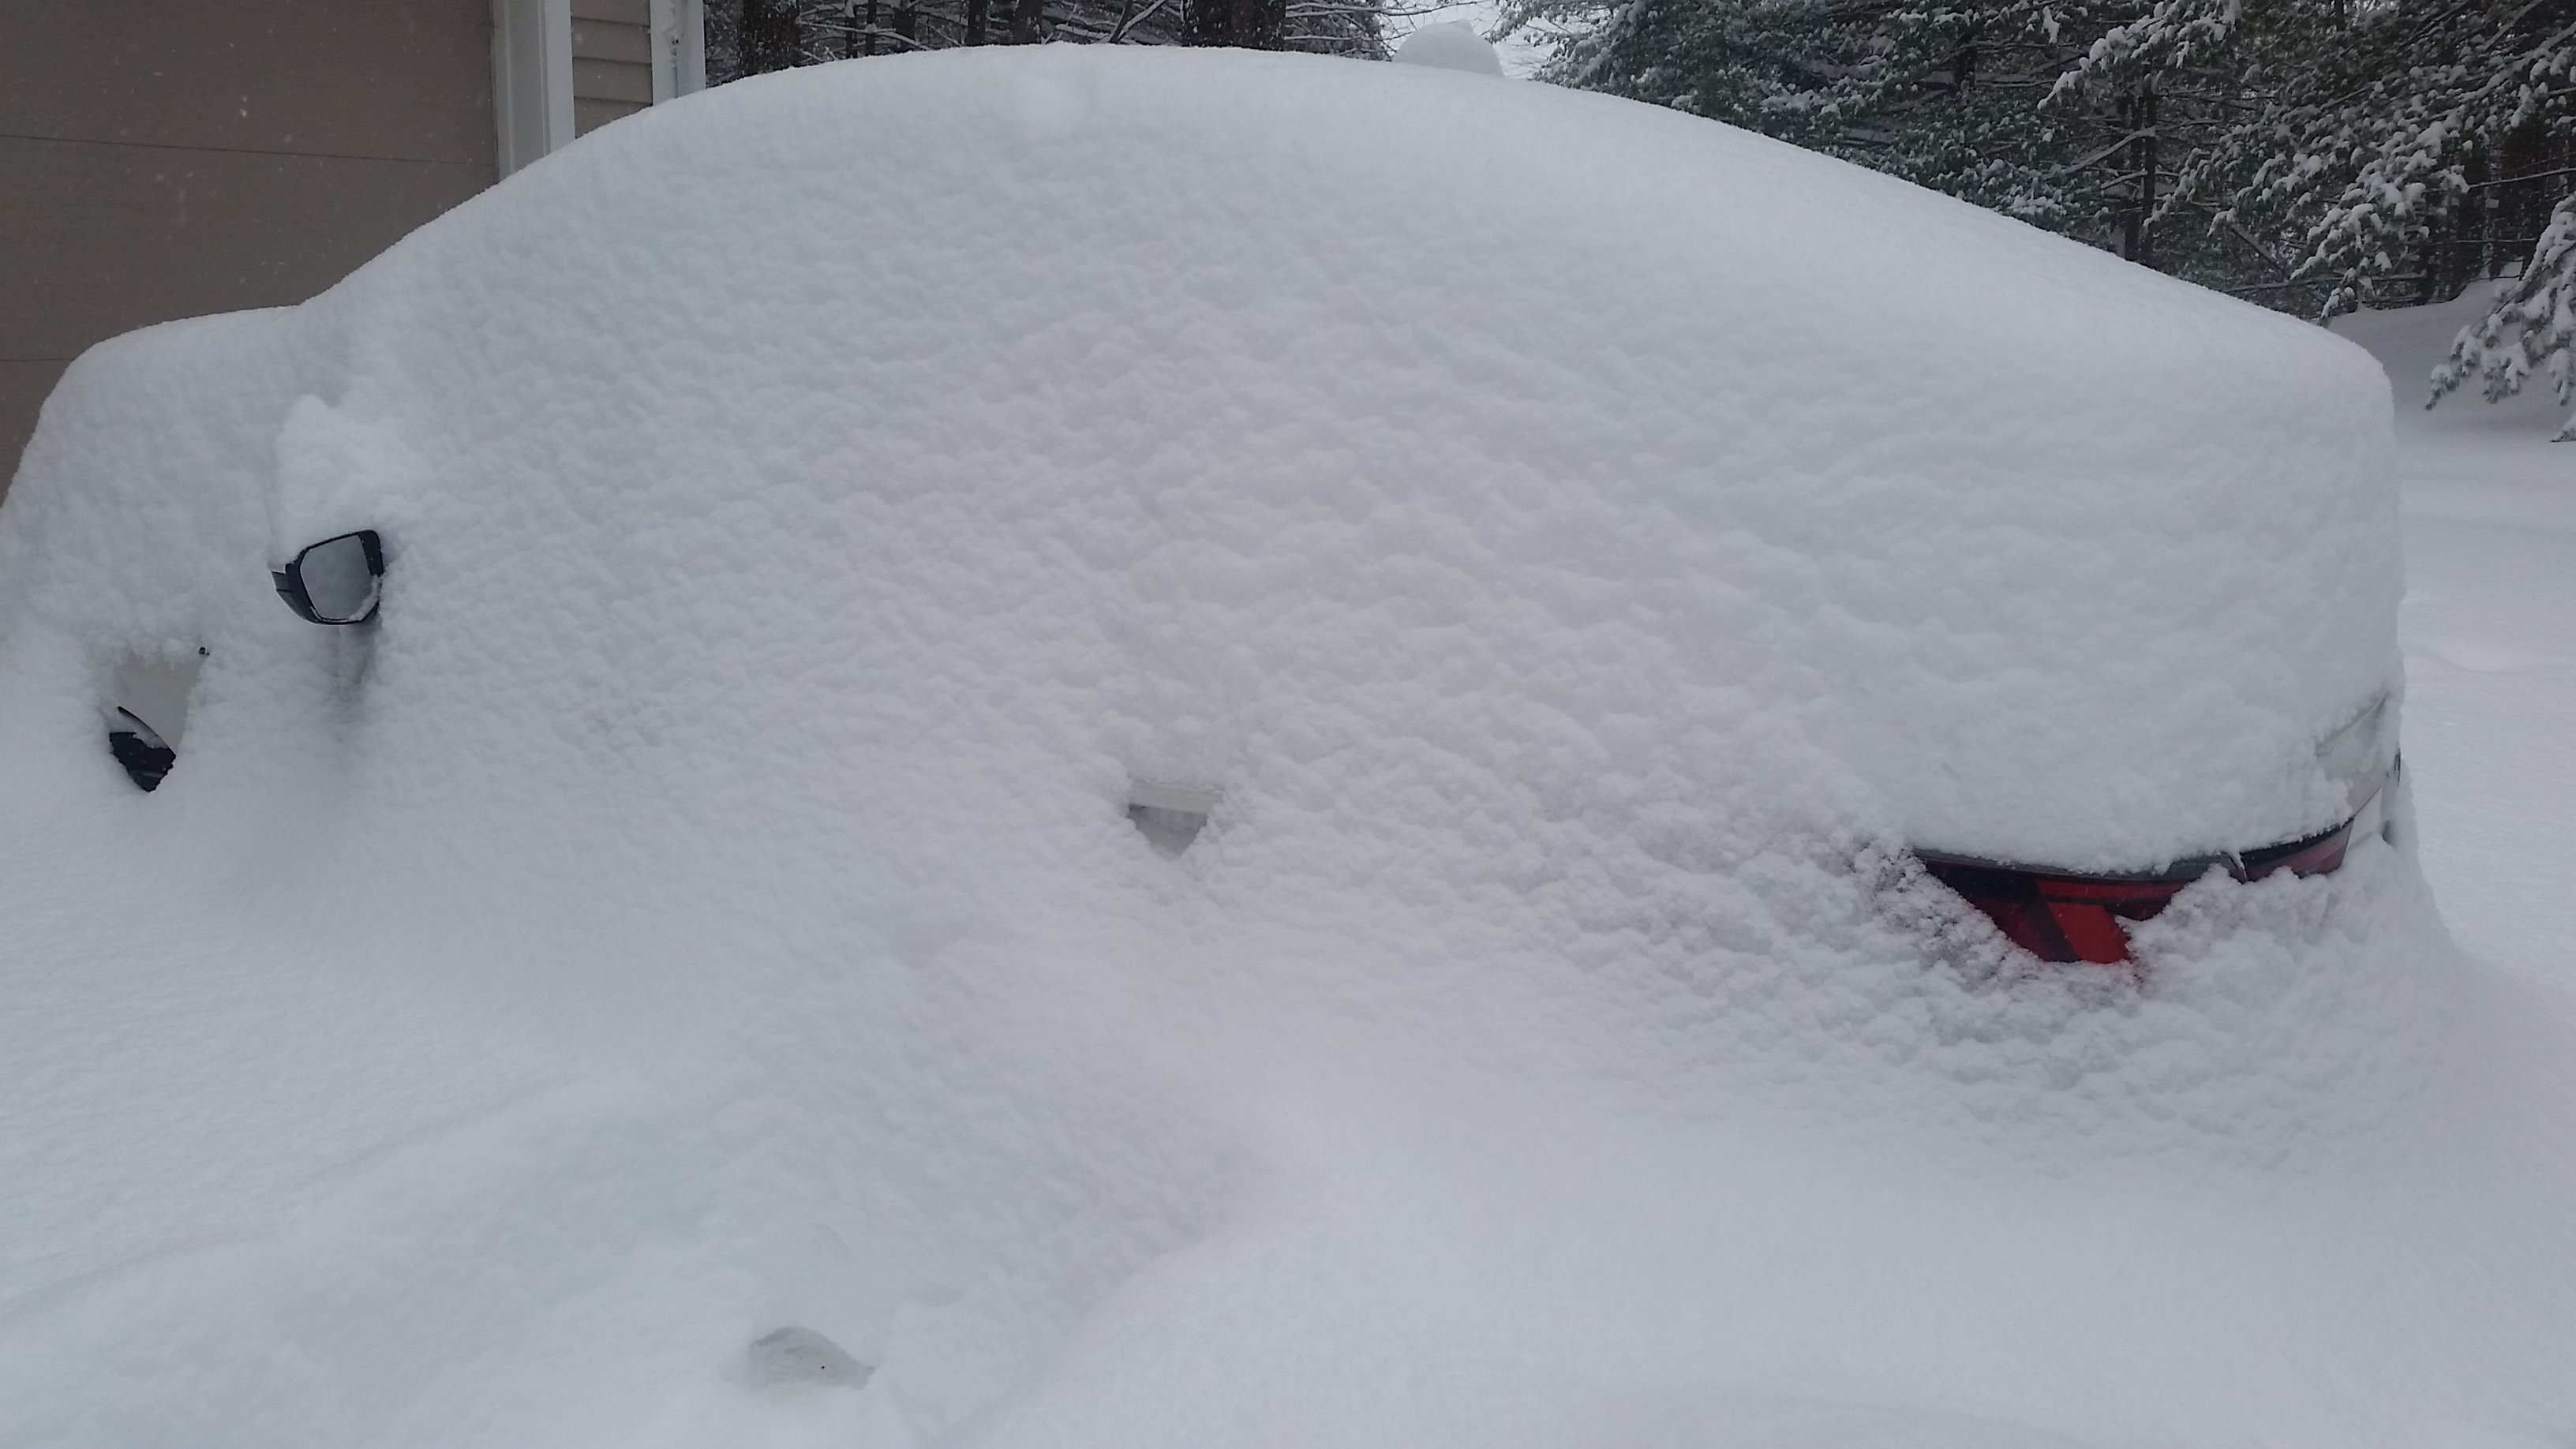
Measured about 19" depth on the ground NW of Albany about an hour ago.
- 693 replies
-
- 10
-

-
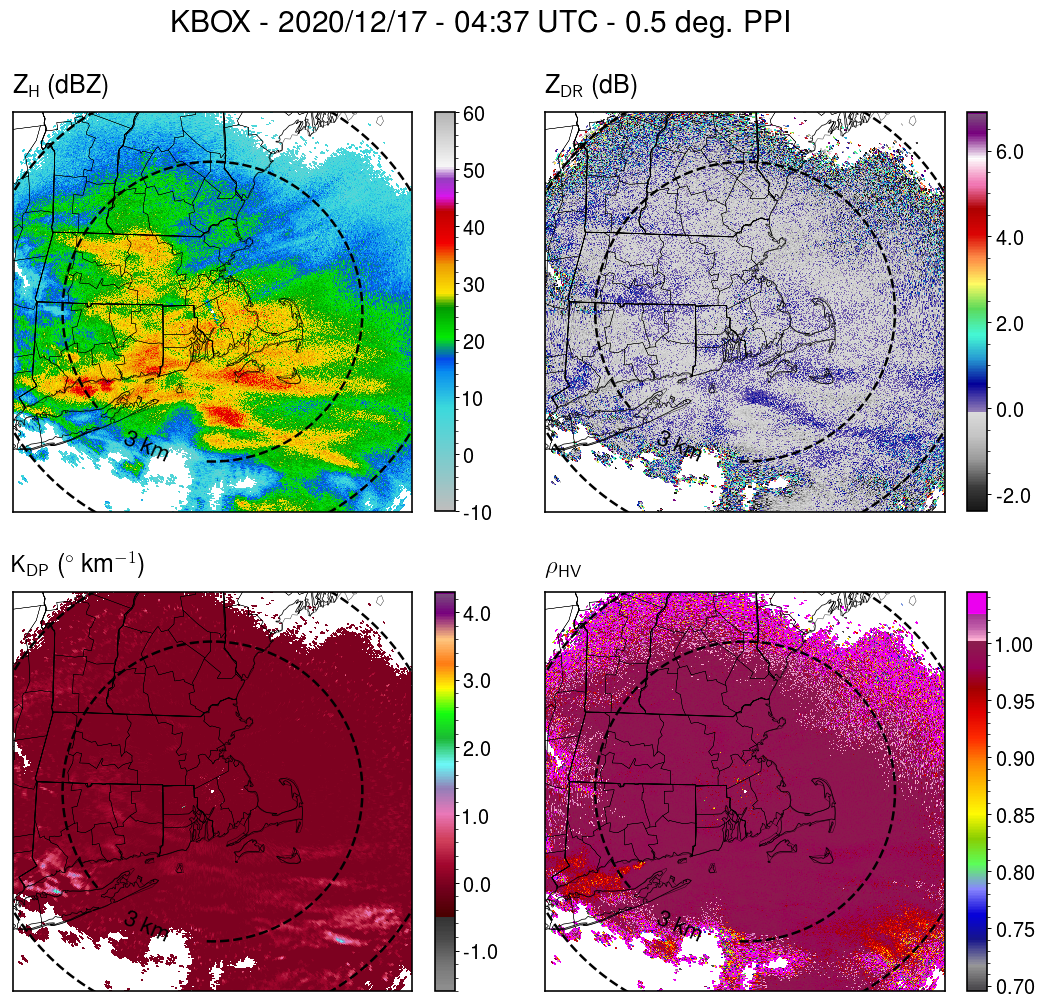
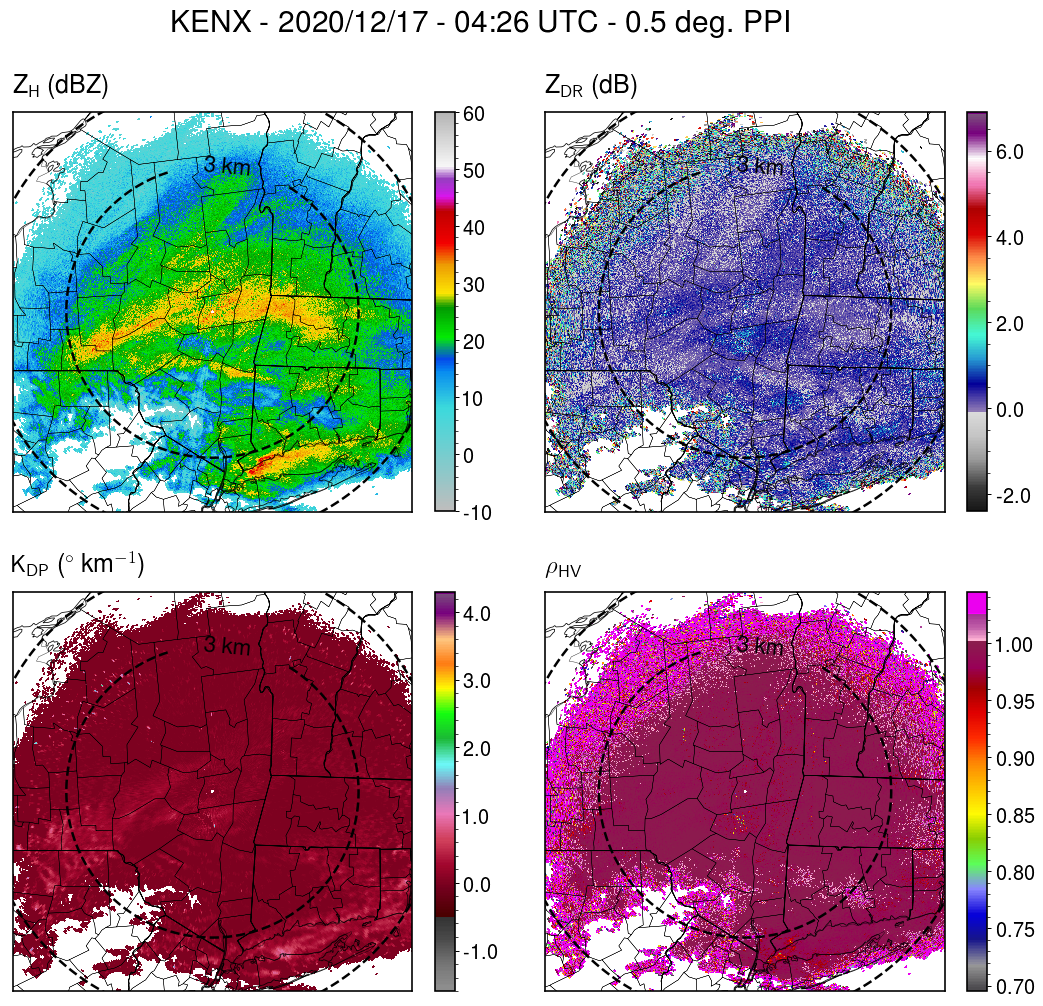
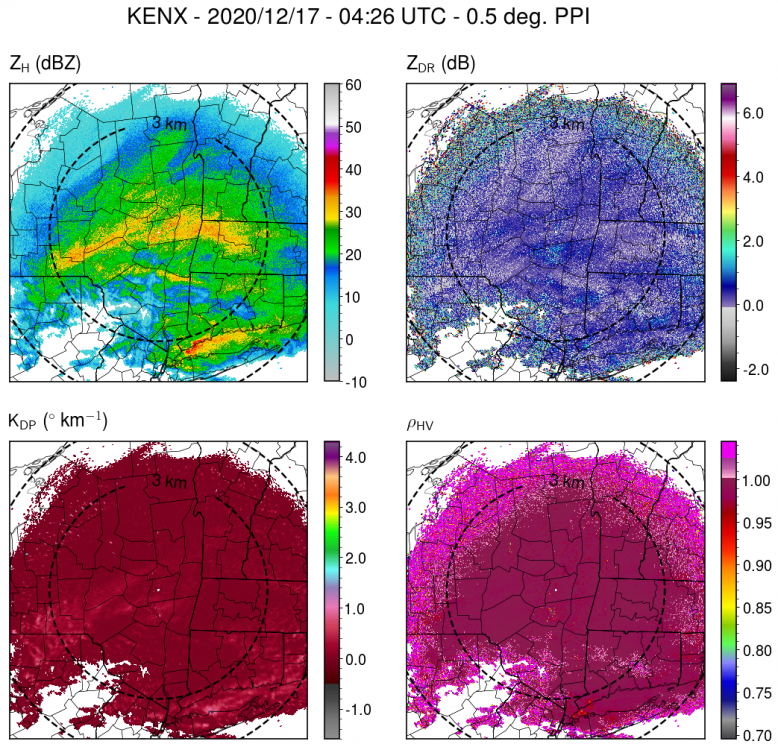
I plotted it from the level-2 NEXRAD data (https://registry.opendata.aws/noaa-nexrad/).
-
Just into the band here in Albany, finding a lot of dendrites and moderate-sized aggregates of dendrites. Corresponds to enhanced reflectivity, KDP, and ZDR within the band from KENX.
-
Dec 16-17 Storm OBS Thread
heavy_wx replied to BuffaloWeather's topic in Upstate New York/Pennsylvania
Some light snow started here within the last half hour just NW of Albany. -
Upstate/Eastern New York
heavy_wx replied to BuffaloWeather's topic in Upstate New York/Pennsylvania
I'm up near the Albany area for this storm...I think it will be better here than where I'd usually be, along I95 in MD! My main concern is if the secondary mid-level (~700-mb) band stays just south of ALB, and we're stuck in the subsidence zone of the circulation during the period of heaviest snow. -
There's a relatively good indication of 1-km AGL rotation from KLWX for the storm west of Baltimore City. Also some shear-induced size sorting evident in the relative placement of the ZDR and KDP maxima.
-
The August 21, 2017 Great American Eclipse
heavy_wx replied to ice1972's topic in Weather Forecasting and Discussion
Yeah, not a bad analogy. -
The August 21, 2017 Great American Eclipse
heavy_wx replied to ice1972's topic in Weather Forecasting and Discussion
Yeah, I was kind of planning on doing that beforehand anyway just because I had a long drive back. I probably would have stayed around a bit longer otherwise. -
The August 21, 2017 Great American Eclipse
heavy_wx replied to ice1972's topic in Weather Forecasting and Discussion
I left maybe 10 minutes after totality. Traffic was fine on I-40 east until I got to the exit ramp. All of the local roads from Tennessee into Kentucky towards I-75 were bad, and it ended up being a 5-hour drive to I-75 that takes under 3 hours without traffic. After a few miles on I-75 traffic was fine and opened up a lot once I got to I-64 east in Kentucky. That part of the trip was definitely helped by the lower populations of West Virginia, western MD, and central PA. -
The August 21, 2017 Great American Eclipse
heavy_wx replied to ice1972's topic in Weather Forecasting and Discussion
I ended up witnessing the total eclipse at Edgar Evins state park 60 miles east of Nashville. The build-up to totality was amazing; it got noticeably colder and the cumulus died as if an outflow boundary had swept through the area. The light got noticeably dimmer, and it kind of looked like those scenes in old movies where they film shots in the day and darken them to make it seem like night. Totality itself was of course awesome; light from the corona seemed to extend away from the sun in a wishbone shape, with one wispy strand of light to the left and two strands to the right. We were also able to see Venus, and I think Mercury during totality. My favorite picture of the event (the only one I took during totality): -
The August 21, 2017 Great American Eclipse
heavy_wx replied to ice1972's topic in Weather Forecasting and Discussion
Leaving for TN soon. Good luck everyone! -
The August 21, 2017 Great American Eclipse
heavy_wx replied to ice1972's topic in Weather Forecasting and Discussion
Got to my hotel in Richmond, KY. Very light traffic from PA through MD, WV, and KY. I'll probably head south for central TN around 5 am, and hopefully there won't be much traffic at that time. -
The August 21, 2017 Great American Eclipse
heavy_wx replied to ice1972's topic in Weather Forecasting and Discussion
Watertown is about 3 hours from Scranton. But maybe it's a bit early to plan lol. -
The August 21, 2017 Great American Eclipse
heavy_wx replied to ice1972's topic in Weather Forecasting and Discussion
The best bet might be the cumulus shadows near the Ontario and Erie lake shores. Of course in April, there could also be widespread overcast throughout the Great Lakes. -
The August 21, 2017 Great American Eclipse
heavy_wx replied to ice1972's topic in Weather Forecasting and Discussion
Same, I've never been to Kentucky or Tennessee. I'm thinking I'll probably leave my hotel in KY around 4-5 am just to be safe with regards to traffic. I have plenty of work to keep me busy while I wait anyway... -
The August 21, 2017 Great American Eclipse
heavy_wx replied to ice1972's topic in Weather Forecasting and Discussion
Some supersaturation wrt ice around 200 mb but otherwise southeastern TN is looking pretty good as of now.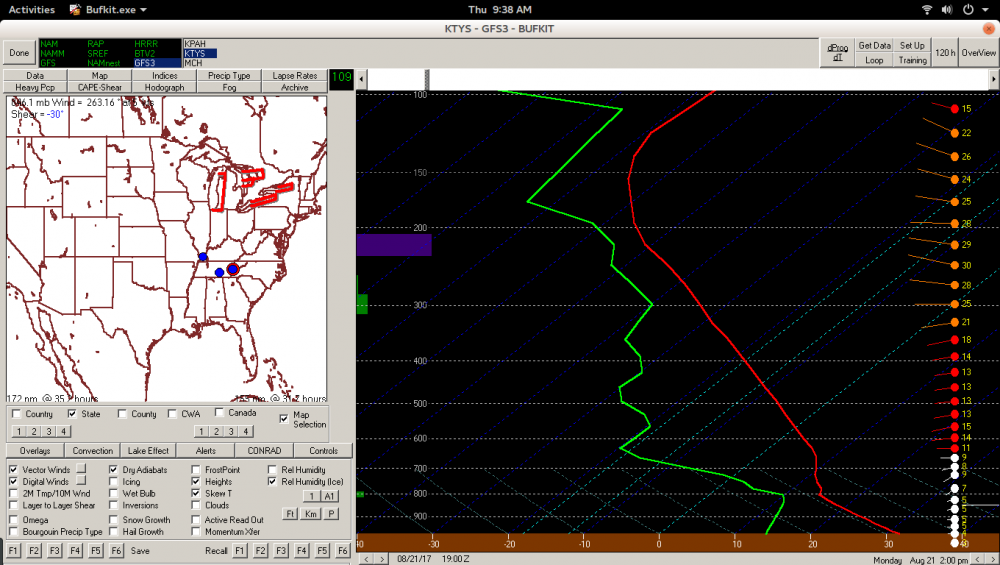
-
The August 21, 2017 Great American Eclipse
heavy_wx replied to ice1972's topic in Weather Forecasting and Discussion
I think it's probably best to be at your intended viewing location at least a couple hours before the eclipse. I would definitely avoid big metro areas like St. Louis or Nashville if possible. Major interstates near the path of totality will probably be OK a few hours before the eclipse. Interstates that connect directly to large cities like I-55 and I-70 in Illinois, I-65 in IN/KY, and I-75 in KY may be pretty busy early in the day if people are driving south for the day. I'm considering going to Sparta, TN because it isn't near any north-south interstates and it's also not really that close to I-40, so traffic shouldn't be bad a few hours before the eclipse. -
The August 21, 2017 Great American Eclipse
heavy_wx replied to ice1972's topic in Weather Forecasting and Discussion
It's only like an extra second longer in southern IL vs. central MO so I'm not sure that will really cause people to seek out that area especially; weather and convenience are probably the dominant factors in where people end up going. Getting to the center of the totality path is also important if you want a longer eclipse. I booked a hotel in Richmond, KY for Sunday night with plans to drive into central TN or western KY depending on the weather.