

2001kx
-
Posts
2,291 -
Joined
-
Last visited
Content Type
Profiles
Blogs
Forums
American Weather
Media Demo
Store
Gallery
Posts posted by 2001kx
-
-
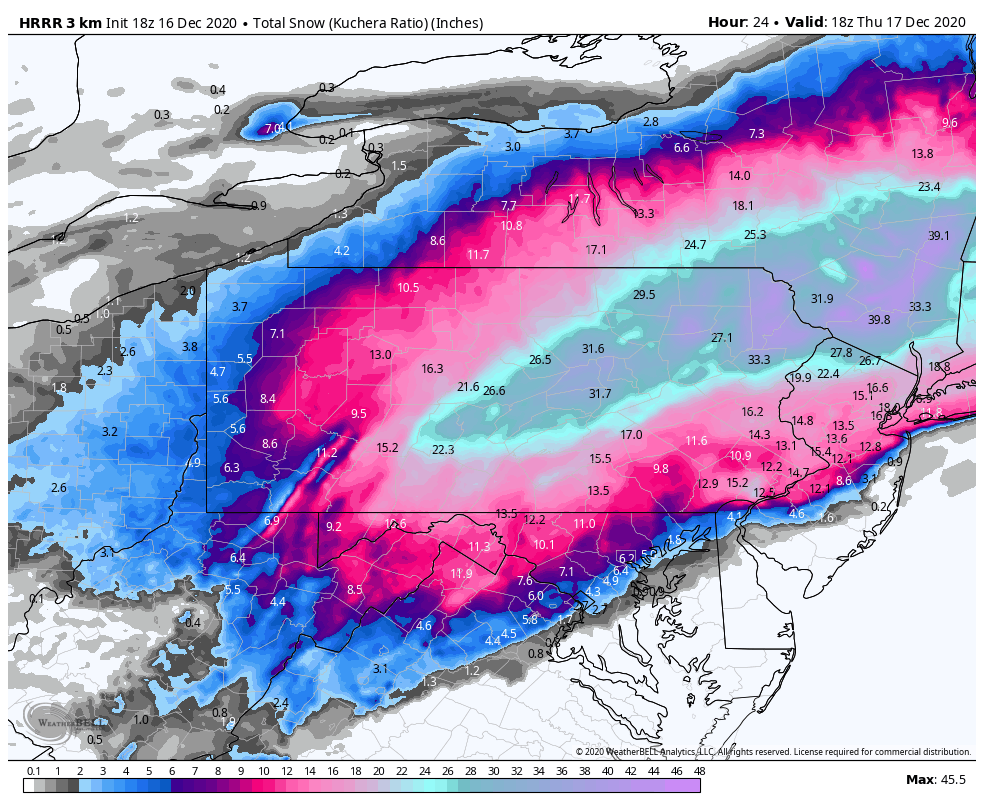
31 minutes ago, MAG5035 said:
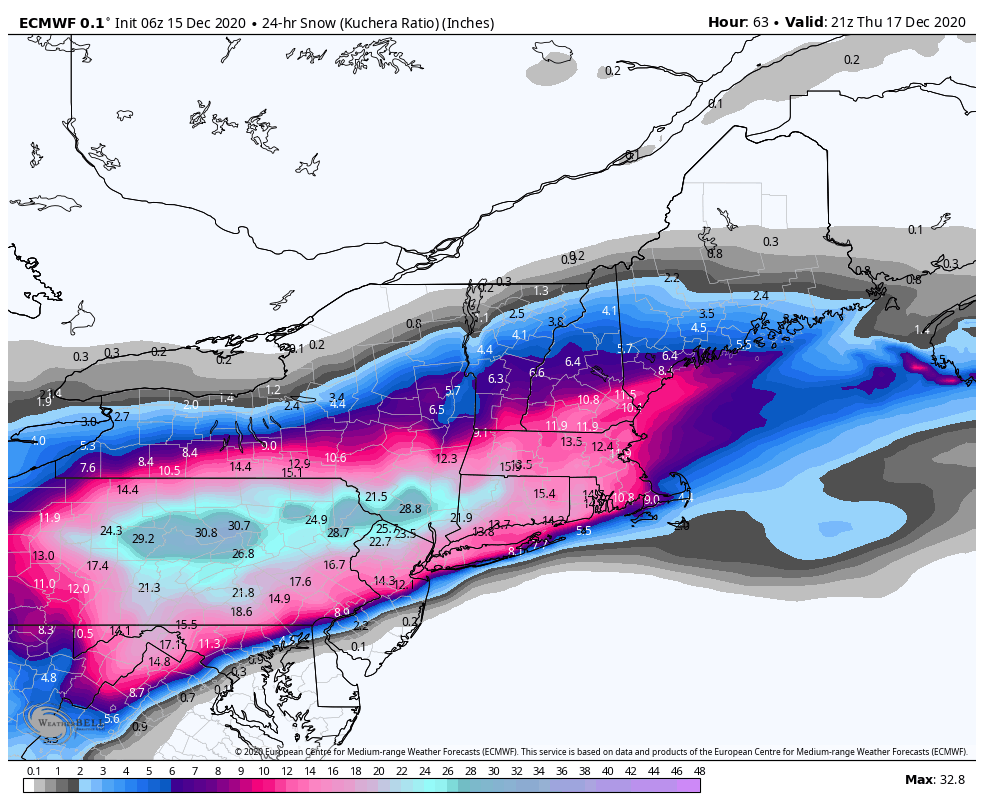
Wow on the 18z HRRR. And these Kuchera totals aren't doing anything mind blowing ratio wise. Did some calculating and KAOO and UNV get to their ~2ft amounts via 14-15:1 ratios. Selinsgrove (SEG) and IPT get to their nearly 32" totals via a 13-14:1 average. This is doable if the QPF ends up that high in the deform bands.

Think I have a shot at 12" back here?
-
at least a solid 1" here so far.
-
-
Just now, Wmsptwx said:
Yes sir 18 in 2017. My fav storm to date.
I thought so..You are the hot spot now (well i guess we'll see tomorrow)
-
Pretty sure they got close to 20" just a couple years ago didnt they?
wmsptwx?
Good luck to you and everyone on here...

-
2 minutes ago, canderson said:
I seee no reason to stay for the Euro tonight. See everyone tomorrow - remember to get the beer in the fridge early for proper cooling.

-
Just now, tim123 said:
2 feet snowstorms in Pittsburgh is a once in a lifetime event.
Yep same for Clearfield apparently.
-
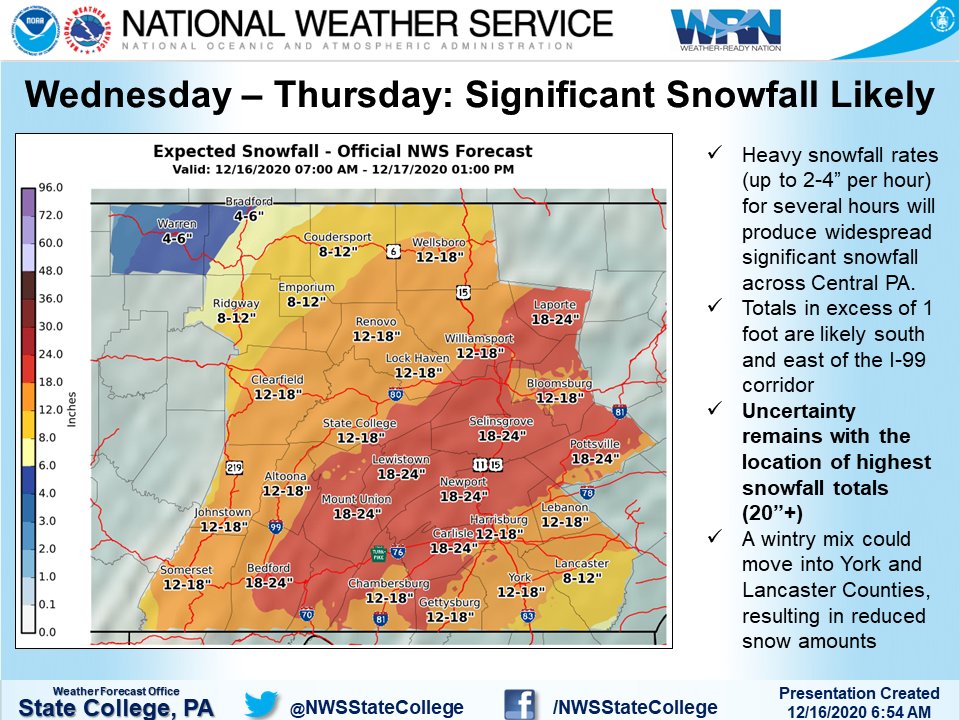
1 minute ago, jm1220 said:
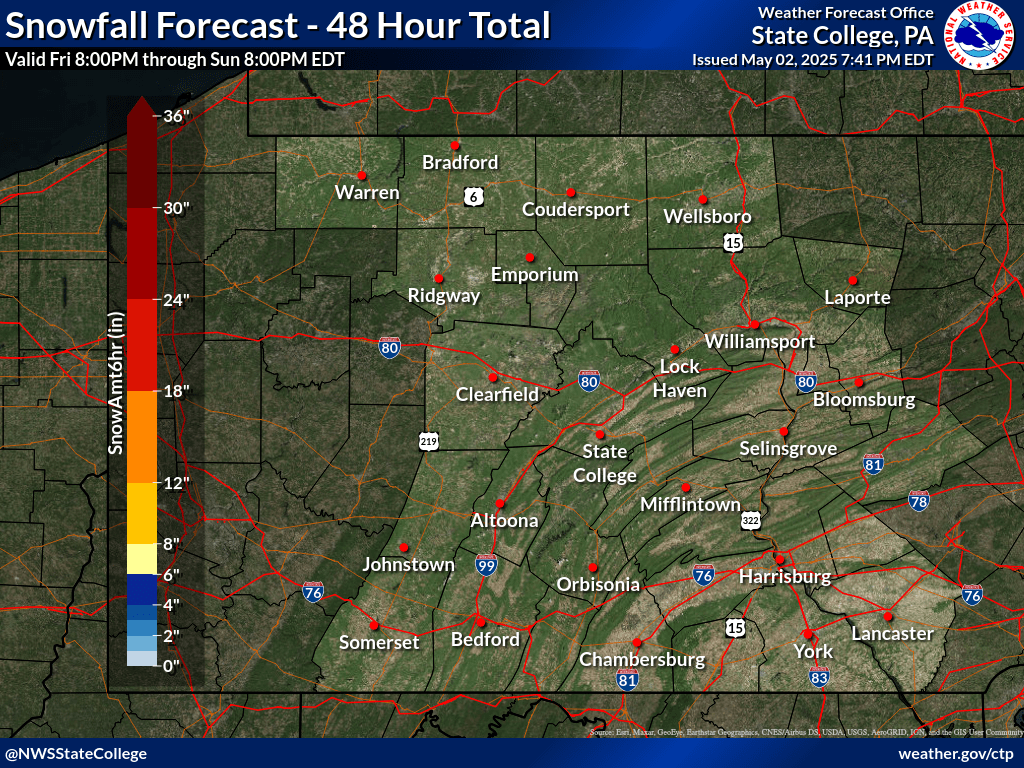
Enjoy everyone!! Looks like I-81 and especially maybe just west are about to get annihilated. CTP has it set up between I-99/Rt 220 and I-81 for possible 20+ but should be 12" for all posters here except maybe way south near Lancaster.
Thanks..Looking forward to tomorrow.
-
11 minutes ago, Rd9108 said:
We will get our 2ft storm eventually we are due.
I dont know...I have been waiting 27 years now for my 2' snowstorm

-
-
-
-
-
4 minutes ago, canderson said:
I said this exact same thing on January 21, 2016.
Will be fun to see what happens..unless its a screw job somehow
")
-
12 minutes ago, Cashtown_Coop said:
There’s so much snow over Blair County I can’t see Mags house.
I dont know if i have ever seen a model show that much snow (27") over my house with less than 24 hours till game time.
Now i dont think that will happen but it is fun to look at.
-
NAM
https://m2.pivotalweather.com/maps/models/nam/2020121518/045/sn10_acc.us_ne.png
https://m2.pivotalweather.com/maps/models/nam/2020121518/045/snku_acc.us_ne.png
GFShttps://m3.pivotalweather.com/maps/models/gfs/2020121518/042/sn10_acc.us_ne.png
https://m3.pivotalweather.com/maps/models/gfs/2020121518/042/snku_acc.us_ne.png
-
-
Just now, canderson said:
I read (unless I misread) it hasn't had a 20" storm since 1994.
same here
-
6 minutes ago, basehore said:
Just got bumped to a Winter Storm Warning in Tioga County
Tioga-
Including the cities of Mansfield and Wellsboro
1200 PM EST Tue Dec 15 2020

...WINTER STORM WARNING IN EFFECT FROM NOON WEDNESDAY TO 10 AM
EST THURSDAY...

* WHAT...Heavy snow expected. Total snow accumulations of 8 to
  13 inches.

* WHERE...Tioga County.

* WHEN...From noon Wednesday to 10 AM EST Thursday.

* IMPACTS...Heavy snow may make for very difficult to impossible
  travel conditions, particularly for the Wednesday evening
  commute through Wednesday night.

* ADDITIONAL DETAILS...Snowfall rates of up to 2 inches per hour
  are expected late Wednesday and Wednesday night.
same here for 8-12"
-
 1
1
-
-
13 minutes ago, Blizzard of 93 said:
Here are the 6z Euro snow maps.
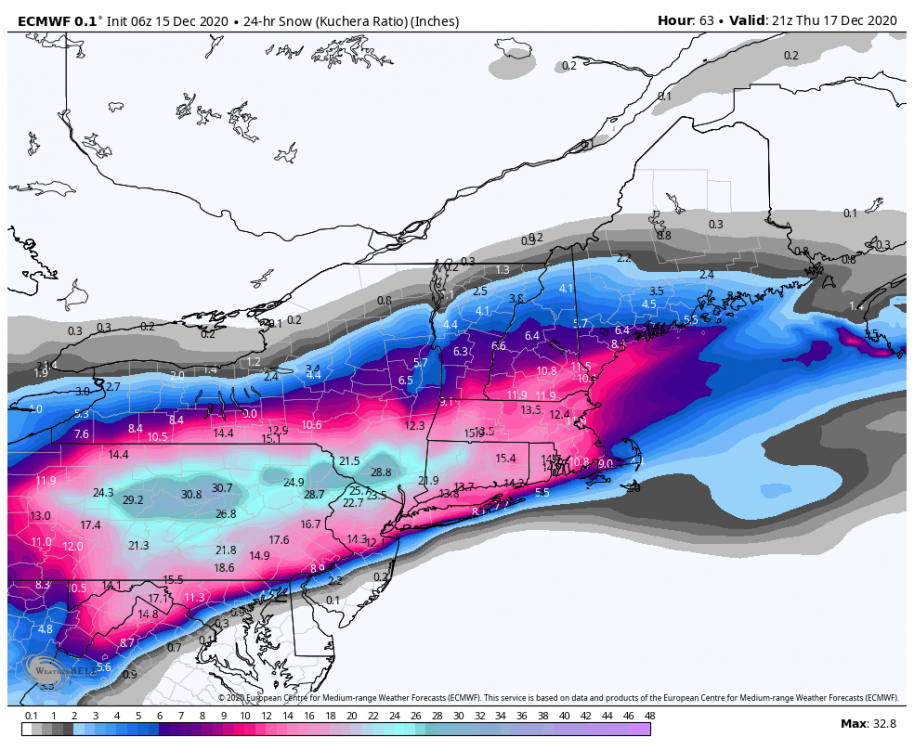
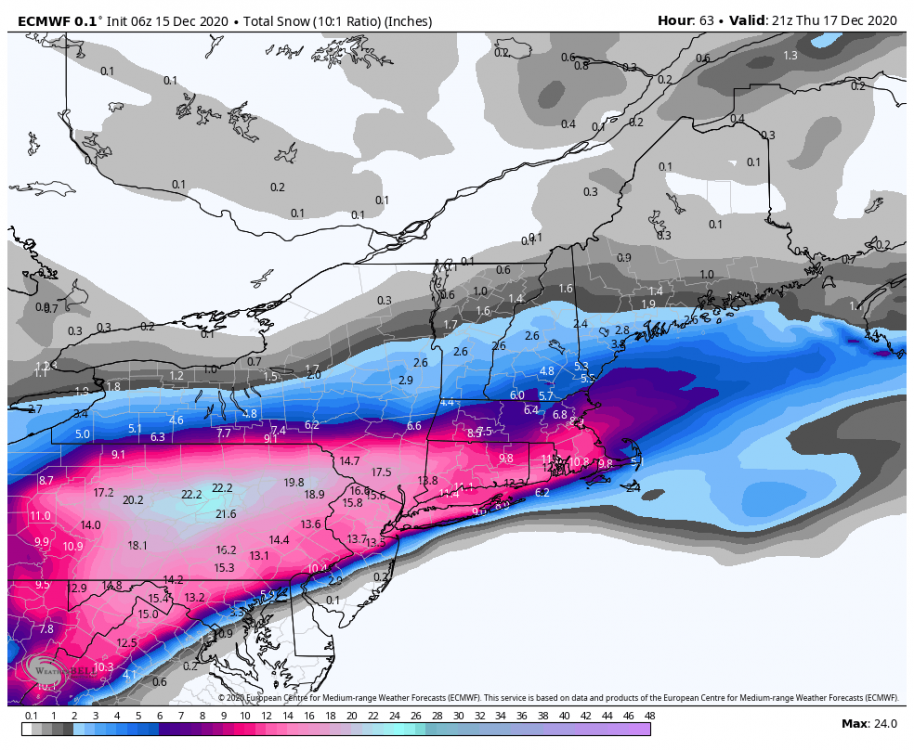
What I wouldn't do for that to verify.
-
Just now, Atomixwx said:
This is Flatheadsickness. He takes a different approach to weather lol
Thats what i was thinking as well but im lost as to whats going on?
-
DT's new map

-
1
-
-
-
mmmmmmmmm

-
1
-


December 16 2020 CTP Snowstorm Disco and Obs
in Upstate New York/Pennsylvania
Posted
Thanks mag..