

ILMRoss
-
Posts
668 -
Joined
-
Last visited
Content Type
Profiles
Blogs
Forums
American Weather
Media Demo
Store
Gallery
Everything posted by ILMRoss
-

January 20-22 “bring the mojo” winter storm threat
ILMRoss replied to lilj4425's topic in Southeastern States
ICON trickling in and 60 hours in think this run is going to look pretty good (or at least improved) -
Gonna be honest I didn’t see any sign of that at all, our chief problem will be getting enough qpf if you take modeling verbatim right now. Temps are beyond fine and any event would produce pixie dust snow.
-
January 20-22 “bring the mojo” winter storm threat
ILMRoss replied to lilj4425's topic in Southeastern States
If you are hemming and hawing about losing the storm, I would not. I saved a trend GIF that storm that buried Nashville a few weeks ago. It's the clearest NW trend/amped example I've ever seen. It happens a lot. "Hey shortwave, be more amped! Be stronger! Dig a little more!" Not the hardest things to root for on modeling going forward.thumb.gif.012686af82f7d36d286dd94d0438f95b.gif.c341862b8be62d67e9492a04105e0c43.gif)
-
January 20-22 “bring the mojo” winter storm threat
ILMRoss replied to lilj4425's topic in Southeastern States
I think you have a weird mix of emotions on here. A little bit of "here we go again", a little bit of "most focus is going to the situation at hand", etc. But to balance my pop cultural reference I will say this: On a wholesale level this potential looks much more fruitful than our current storm. Temperatures are leagues better. Huge, consistently modeled cold push. The smart folks at Wilmington's weather office have already put in snow in their forecasts. That almost never happens. I think that just about every office around here already introducing snow for next weekend is a pretty big sign. The National Weather Service is generally the largest brain trust of meteorological knowledge that we have and it's both rare and awesome to see them biting this far out. Since we're immediately following a storm that had a ton of potential that backslid into Miller B mush as we got closer, I think feeling snakebitten and being a little reticent to buy into this is understandable. But make no mistake- I'm feeling pretty excited now that I've digested things. Hoping that the 12z suite is positive after I've left such a gushing review of the potential here. -
completely didn't notice it since it wasn't pinned good call
-
January 20-22 “bring the mojo” winter storm threat
ILMRoss replied to lilj4425's topic in Southeastern States
-
Much appreciated. that looks great. if gfs/icon/cmc roll in looking good then lets get this thread up around noonish
-
does anybody have 00z EPS imagery for this, like some snow means, maybe a 51 member chart for rdu/gso etc
-
Winter Storm Izzy Obs Thread
ILMRoss replied to Prismshine Productions's topic in Southeastern States
In downtown Raleigh (oakwood) we have 80% pingers 20% snow -
i can't believe i'm going to spend another 6 days in a row overanalyzing every run of the gfs after swearing it off yesterday Way better temps this time I'm licking my chops
-
After watching tomorrow's system slip through the cracks for central NC because of a ULL getting too amped I'm pretty fine if the modeling consensus is too suppressed/weak this far out edit- been playing golf today then immediately switched gears to watch football at a buddy's place just saw the 12z suite for the first time oh my god
-
The last thing I’m doing tonight and the first thing I’m doing tomorrow morning is checking out dews upstream of us and how they’re verifying on Iowa state meteogram. I spoke on this yesterday, I think there’s a few more things with storm than usual that could erode our CAD, and if it hangs on/overperforms then It solidifies itself as the dominant forecasting feature for winter storms. One last thing I’ll touch on since I saw some chatter about it, Jan 2000 was both cool, and could also never happen again. Our tools are a bit better today than the TI-89 graphing calculators they were using to run models back then.
-
The NAM has this reputation because it fired the first warning shots in the late Feb 2015 storm and early Jan 2017 storm. In both those storms RDU was basically center cut in the jackpot by every model except the NAM. Everyone was like, "lol crazy NAM", and was unprepared for the gut punch those storms delivered when sleet/rain began to mix in hard. Since then everyone is pretty petrified to bet against it.
-
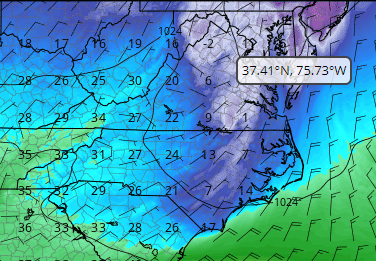
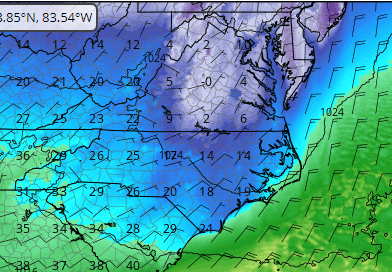
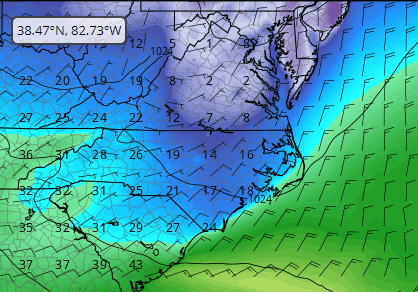
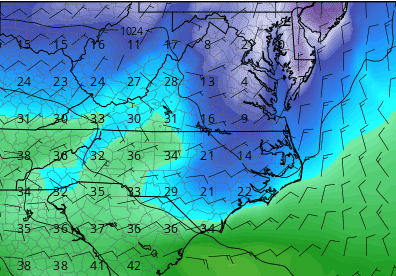
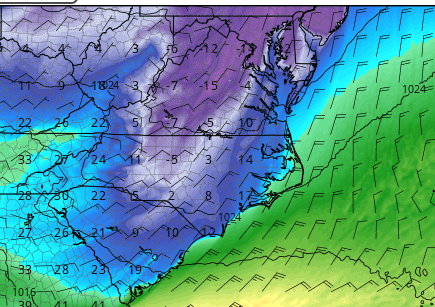
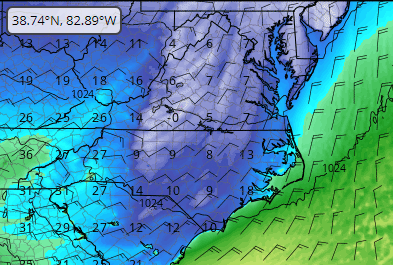
Setting the table with what dews look like on 00z Sunday..... 18z HRRR: 12Z NAM 3km: WRF-ARW (??) WRF-ARW2: Regular NAM: GFS: Going to ask my group chats why the ARWs (research models) have such low dews
-
In my experience there's like 2 ways to overperform on modeled snowfall and 87 ways to underperform on modeled snowfall.
-
Some thoughts... - I try to keep a sunny disposition on here because at the end of the day this is a lighthearted forum and not some emergency management network. That colors my thinking and I'd say I have a bias posting about "good things that could happen" and not "failure points". I say this because I've banged the drum about SLP adjustments being too inland for the CAD, models mishandling the transfer that could lead to a more south track, etc and this serves as my "I hope I have not lead anyone astray with false optimism" mea culpa as a rainier picture takes hold. To build on this: - I think the models have a great grasp of what's going to happen. There will be ticks and adjustments and some low stakes twists and surprises but the playbook is out. - Over the last few days, I thought the CAD strength would redirect our SLP further off the coast. That's happened to a certain degree... (no more runs have this thing visiting South of the Border) but I'm unsure what tangible effects this has on the forecast and I thought that sub-freezing temperatures would hang on a little longer as this modification played out. - "The CAD will hang on" is a sound motif in 90% of of situations. I'm beginning to think this is the 10% of cases where that may not hold true. Typically in these scenarios the thing scouring the CAD is screaming 850mb winds. The rate at which the CAD gets eroded is determined by "how well can this model handle the turbulence and eddies between the stable CAD and the screaming 850mb jet". There's micrometeorology and microphysics wizardry going on there and typically the answer to that question is "not very well". However, in this storm we also have crazy lift ahead of a bowling ball upper level low as well as a convection (maybe severe-ish) nudging in from the coast. Our upper air features are typically a lot weaker. This will be a learning experience for everyone, me included, and while I think there's still ample potential for the CAD to hang on, I can easily see why that motif wouldn't hold true with this system and it dissolves much quicker than we're used to. (For clarification: I am not rooting for a strong CAD. My ideal Sunday is seeing a quick hour burst of snow before settling in at a sports bar and eating 1000 wings and watching the Eagles cover and the 49ers win outright and I can't do that without power) As far as tangible forecasting goes: - Shoutout to the mountains. You should get buried unless there's some Miller B voodoo BS going on and the thermals/moisture transport get screwed up (which can happen). Also shoutout to Nashville who is having a fantastic winter. - Sleet/ZR amounts will continue to wobble. Let me bring you through the life of a snowflake through CAD. You fall, melt (cooling the atmosphere) then either refreeze into sleet (releasing latent heat 1000 feet up) or fall as freezing rain (releasing latent heat at the surface. No model is going to be able to nail this down correctly. I also wonder about how latent heating is modeled... Are models assuming everything falling will freeze? In the southern fringes of the ice zone, there are some pretty insane rates being modeled for a winter storm and a lot of that precip will be going down the drain. Are the models assuming that's going to freeze and the latent heat equation is treating it as such? I don't know. - I'm not making a snowmap, the market is saturated and I'm no clout chaser.
-
NAMs great for a lot of things; thermals, soundings (for both svr and winter), convection is modeled better. Higher resolution always helps. And it’s generally good to have as many models in your camp as possible. If you watch a a lot of football you may occasionally see an offensive lineman go down and the announcers will say “ohh man they’re going to miiiiiissssssss him”. And if he’s on your team, you may think “ah ok well it’s not the quarterback” but deep down you do get worried. Basically how I feel when the NAM or something similar is souring. Hopefully that analogy made sense.
-
Still a long way to go with this run. But my feeling is that if you are in a marginal area, you’re not going to enjoy the 00z NAM.
-
Yup nice little finger of before the storm precip im definitely keeping an eye on it
-
If you are already comparing the NAM right now from the 18z, you need to relax. Step away from the computer. I also thought the shortwave looked a little bit weaker than the 18z at hour 15.
-
C Is there a wedge boundary here that the low pressures are trying to transfer/bend around? Kind of hard to tell.
-
Probably depends on which RDU red tagger you ask. I think that the CAD maintains its Integrity a little more and it's predominately sleet/zr/711 slushie after a quick 1-2 inch burst for now. I don't think we'll get above freezing. Eyewall just said rain/zr split which is probably just as likely as my thinking. Think of it like this:

-
I just flipped through 10m wind speeds through all of the globals and meso model at 78 and a few things jumped out: - every mesoscale model kept the wedge pinned on the coast and had the low in south geogia-ish - every global (except the canadian) had eroded the wedge further inland and where the wedge had eroded is generally where the LP followed (with Euro obviously showing the most erosion of the wedge) take with this what you will.
-
Feeling good but not great after that run. Morning's 00z appears to be more and more of a warm blip and this run assuaged some of my concerns. That shortwave diving in behind this thing though just continues to be a massive PITA. That's the feature that's causing our heavy snow axis to take a 45 degree angle (along I-81) instead of a 30 degree angle (up I-85). At this point I don't think that thing's letting go.
-
good grief, i think this is a pretty bizarre thing to greenlight


