

Allsnow
-
Posts
26,403 -
Joined
-
Last visited
Content Type
Profiles
Blogs
Forums
American Weather
Media Demo
Store
Gallery
Posts posted by Allsnow
-
-
Just now, Stormlover74 said:
Probably going to be warned soon
Yup. Definitely not “meh”
-
Monmouth County going to get crushed
-
Line looks to be getting better organized as it heads east
-
 1
1
-
-
5 minutes ago, Stormlover74 said:
Maybe some moderate rain for us
Yup. Crazy how none of these threats dump rain in our area
-
Radar definitely doesn’t look great
-
10 minutes ago, qg_omega said:
Radar looks very blah
Areas affected...parts of the Mid Atlantic
Concerning...Severe potential...Watch possible
Valid 021945Z - 022045Z
Probability of Watch Issuance...40 percent
SUMMARY...An intensifying cluster of thunderstorms over northeast MD and eastern PA may pose a risk for isolated damaging gusts this afternoon. A WW is uncertain though convective trends will continue to be monitored.
DISCUSSION...As of 1940 UTC, regional radar imagery showed scattered thunderstorms ongoing over parts of the Mid Atlantic. Over the last hour, a cluster near the MD/PA border has slowly intensified with a notable increase in lightning and reflectively. Likely supported by subtle ascent from a passing shortwave and remnant convective outflows, 1500-2500 J/kg of MLCAPE will likely continue to support strong updraft development/maintenance. Vertical shear is quite limited with flow generally less than 25 kt. Storm intensity will likely remain tied to forward propagation along advancing outflow with this cluster. The moderate buoyancy and large water loading will likely support a isolated stronger downdrafts with low-end potential for 50-60 mph gusts. Storms should track east/northeast through the afternoon across parts of eastern PA into NJ. Storm organization appears quite limited.
-
3 minutes ago, mgerb said:
Looking good for storms with further development out west, and starting to see some activity fire along the sea-breeze.
Yes!!!
-
Models showing lots of rain chances this coming week weekend and next week. We can only hope it’s correct
-
 1
1
-
-
Just now, FPizz said:
Found warlocks thermometer

To many clouds for a legit 100 today
-
2
-
-
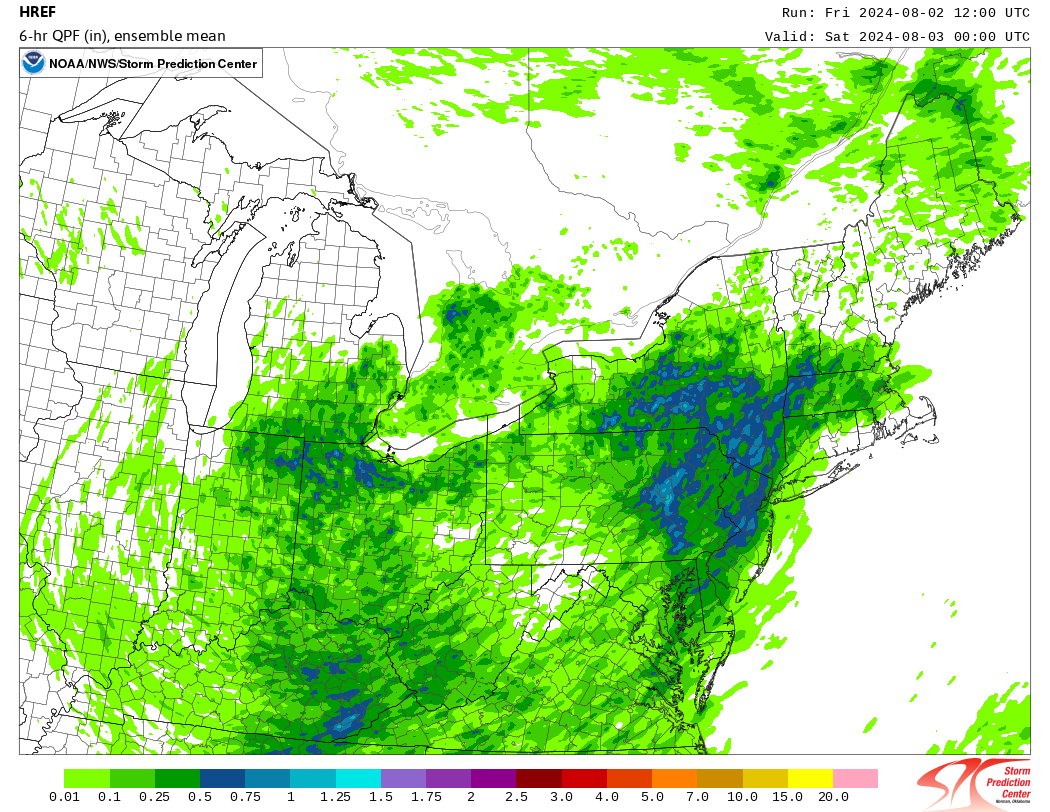
14 minutes ago, forkyfork said:
this is good for a 6 hour mean

Wow!!! We can only hope. Thanks
-
@bluewave how does the HREF look today?
-
.16 today. It’s a start
-
1
-
-
10 minutes ago, Stormlover74 said:
Getting a nice downpour. I don't even think rain was mentioned today. Go figure
It’s the only way we get rain now when it’s not in the forecast.
-
1
-
-
Beautiful rain!!!
-
2
-
-
1 hour ago, bluewave said:
The very strong sea breezes this month limited Islip to only the 9th warmest and LGA 14th warmest July. Even Newark had a sea breeze influence since it couldn’t make the top 5 warmest like areas further west. FWN and SMQ had their 2nd warmest July west of the sea breeze influence.
Time Series Summary for ISLIP-LI MACARTHUR AP, NY - Month of Jul
Click column heading to sort ascending, click again to sort descending.1 1999 78.6 0 2 2019 78.1 0 3 2013 78.0 0 - 2010 78.0 0 4 2020 77.7 0 5 2011 77.6 0 6 1994 77.3 0 7 2022 77.1 0 8 2023 77.0 0 9 2024 76.9 0 10 2016 76.8 0
Time Series Summary for LAGUARDIA AIRPORT, NY - Month of Jul
Click column heading to sort ascending, click again to sort descending.1 2020 82.9 0 2 2010 82.8 0 3 1999 81.9 0 4 2019 81.5 0 5 2013 81.2 0 6 2022 81.1 0 - 2016 81.1 0 7 1955 80.9 0 8 1966 80.8 0 9 2006 80.7 0 10 1994 80.6 0 11 2023 80.4 0 - 2012 80.4 0 - 2011 80.4 0 - 1952 80.4 0 12 2008 80.0 0 - 1993 80.0 0 13 2018 79.8 0 - 1995 79.8 0 14 2024 79.7 0 15 2002 79.5 0
Time Series Summary for NEWARK LIBERTY INTL AP, NJ - Month of Jul
Click column heading to sort ascending, click again to sort descending.1 2011 82.7 0 2 2022 82.6 0 3 1993 82.5 0 4 2010 82.3 0 5 1994 81.9 0 6 2024 81.3 0 7 2013 80.9 0 8 2020 80.8 0 - 2012 80.8 0 - 1999 80.8 0 9 2023 80.6 0 - 2019 80.6 0 10 1955 80.5 0
Time Series Summary for SUSSEX AIRPORT, NJ - Month of Jul
Click column heading to sort ascending, click again to sort descending.1 2020 76.5 0 2 2024 75.7 0 3 2019 75.3 0 4 2023 74.8 0 5 2013 74.6 0 6 2011 74.5 0 7 2022 74.4 0 8 2012 74.3 0 - 2006 74.3 0 9 2010 74.1 2 10 2016 73.9 0
Time Series Summary for SOMERSET AIRPORT, NJ - Month of Jul
Click column heading to sort ascending, click again to sort descending.1 1999 78.5 1 2 2024 78.3 0 3 2020 78.0 0 4 2022 77.9 0 5 2019 77.5 0 - 2011 77.5 0 6 2013 77.4 0 7 2012 76.9 0 8 2023 76.8 0 - 2003 76.8 25 9 2016 76.7 0 - 2010 76.7 0 Yeah, would have thought the +2 at nyc would be higher considering the heat we have had here in central jersey
-
4 minutes ago, bluewave said:
The one silver lining is that you can turn on the sprinklers for these nuisance summer dry patterns. Almost a July version of January 2022. But most people don’t have snow making equipment to make up for missing the winter snowstorms.
")
Time Series Summary for Atlantic City Area, NJ (ThreadEx) - Month of Jan
Click column heading to sort ascending, click again to sort descending.1 2022 33.2 0 2 1987 20.3 0 3 2014 18.8 0 4 2016 16.7 0 5 1961 15.9 0
Ha. That was ACY revenge winter after missing out on the epic 20-21 run
-
1
-
-
2 minutes ago, Stormlover74 said:
CT and south jersey again
Yup storms blowing up in south jersey
-
6 minutes ago, Damage In Tolland said:
Nice bow echo coming into and thru HFD metro . Hearing Lots of thunder
Congrats
-
Glad I didn’t get invested with today’s false rain threat. I’m sure Cape May will find a way to get more rain today…
-
1 hour ago, Stormlover74 said:
Yeah at least give me sunny and dry if it's not going to rain. All these clouds and humidity is useless
Agreed. We have had lots of cloudy days since the start of last week.
-
12 minutes ago, MANDA said:
.01" rainfall last 24 hours.
Let's continue to play kick the can. Very dry and disappointing "wet stretch" especially considering the high DP pattern that has been in place for the last 3-4 weeks. Some places haven done well but those places are a small percentage of this sub forum. It has been dry.
Models are very active inside 5 days then is just disappears as we get closer. Hopefully, that doesn’t happen with Friday into the weekend
-
2
-
-
17 minutes ago, Brian5671 said:
Season doesn't really get going til August. That said, the Nina is not going crazy so that could lead to a reduced # of storms.
We shall see what happens. Seldom do these cold/snowy or busy hurricanes season forecast ever work out
-
1
-
-
0.00 overnight
are they still expecting a busy tropical hurricane season? It feels like it’s been very slow
-
 1
1
-
1
-
-
Best chance of rain looks to be Friday Night Now. The wet pattern has been a complete failure here
-
1
-

August 2024
in New York City Metro
Posted