

bluewave
-
Posts
31,767 -
Joined
-
Last visited
Content Type
Profiles
Blogs
Forums
American Weather
Media Demo
Store
Gallery
Posts posted by bluewave
-
-
1 minute ago, BucksCO_PA said:
77-78 winter was colder than all 3 of those winters.
If you extend that out thru March 1977-78 was actually colder than that same period during 1976-77. The 2014-15 DEC-MAR period is only a tick warmer than the 1976-77 DEC-MAR timeframe.
The 2015 JAN-MAR period was the coldest since 1934
The JAN-MAR 15 period still finished above 30.0 in NYC at 30.9. So it was comparable to DJF 14-15 at 31.4.
Decembers have warmed too much since the 70s and 80s to allow a full winter to finish below 30.0° like 76-77 did. December 14 came in at 40.5° with 60s on Christmas Day. So the cold got started too late to compete against the really cold winters like 76-77.
The cold also ended too quickly in 15 to have a memorable spring MAM cold ranking. In fact May 15 was the 2nd warmest on record in NYC.
The cold was so impressive in 76-77 that it was the 7th coldest fall and winter on record. That kind of 6 month extended cold is no longer possible from the fall into winter. These days the early to sometimes mid fall is like another summer month. Temperatures in 1977 actually rebounded for a time in the early spring like a delayed thaw. Then the historic snowstorm occurred in May.
Time Series Summary for NY CITY CENTRAL PARK, NY
Click column heading to sort ascending, click again to sort descending.RankEnding DateMean Avg Temperature Sep 1 to Feb 28Missing Count1 1869-02-28 34.7 122 2 1918-02-28 39.2 0 3 1881-02-28 39.9 0 4 1888-02-29 40.2 0 5 1872-02-29 40.7 2 6 1873-02-28 40.8 0 7 1977-02-28 41.1 0 8 1893-02-28 41.2 0 - 1884-02-29 41.2 0 9 1904-02-29 41.3 2 10 1905-02-28 41.4 0 - 1883-02-28 41.4 0 -
 1
1
-
 2
2
-
-
2 hours ago, LibertyBell said:
I dont blame "weenies" I blame the people who designed these models, do they not know how to debug and correct these models? all programmers know how to debug...... they should theoretically be able to adjust the way they handle the MJO when they see these errors occurring.
The main story is that we are adding more heat to the system faster than our technology can keep up with. So most of the time the first indication of a change or shift in our climate comes after it has already been observed. But with the introduction of AI, there is some hope that these longer range MJO forecasts will eventually be able to see stronger forcing and convection in the MJO 4-7 phases. While this has been an issue even during the La Ninas in recent years, the long range cold bias was more obvious this year since it was an El Niño. The paper below describes how this forecast error could be addressed with AI.
https://www.nature.com/articles/s41612-023-00478-0
Over the past half-century, there has been an increasing trend in the magnitude and duration of the Madden-Julian Oscillation (MJO) attributable to the significant warming trend in the Western Pacific (WP). The MJO, bridging weather and climate, influences global and regional climate through atmospheric teleconnections, and climate models can predict it for up to 4–5 weeks. In this study, we use deep learning (DL) methods to investigate the predictability of the MJO-related western Pacific precipitation on a multi-month time scale (5–9 weeks). We examine numerous potential predictors across the tropics, selected based on major MJO theories and mechanisms, to identify key factors for long-term MJO prediction. Our results show that DL-based useful potential predictability of the WP precipitation can be extended up to 6–7 weeks, with a correlation coefficient skill ranging from 0.60 to 0.65. Observational and heat map analysis suggest that cooling anomalies in the central Pacific play a crucial role in enhancing westerly anomalies over the Indian Ocean and warming in the WP, thereby strengthening the Walker circulation in the equatorial Pacific. In addition, the predictability of WP precipitation is higher in La Nina years than in El Nino or normal years, suggesting that mean cooling in the central Pacific may contribute to increased predictability of the MJO-related WP precipitation on the multi-month time scale. Additional model experiments using observed sea surface temperature (SST) anomalies over the central Pacific confirmed that these anomalies contribute to enhanced MJO-related convective anomalies over the WP. The study highlights that DL is a valuable tool not only for improving MJO-related WP prediction but also for efficiently exploring potential mechanisms linked to long-term predictability.
-
3
-
-
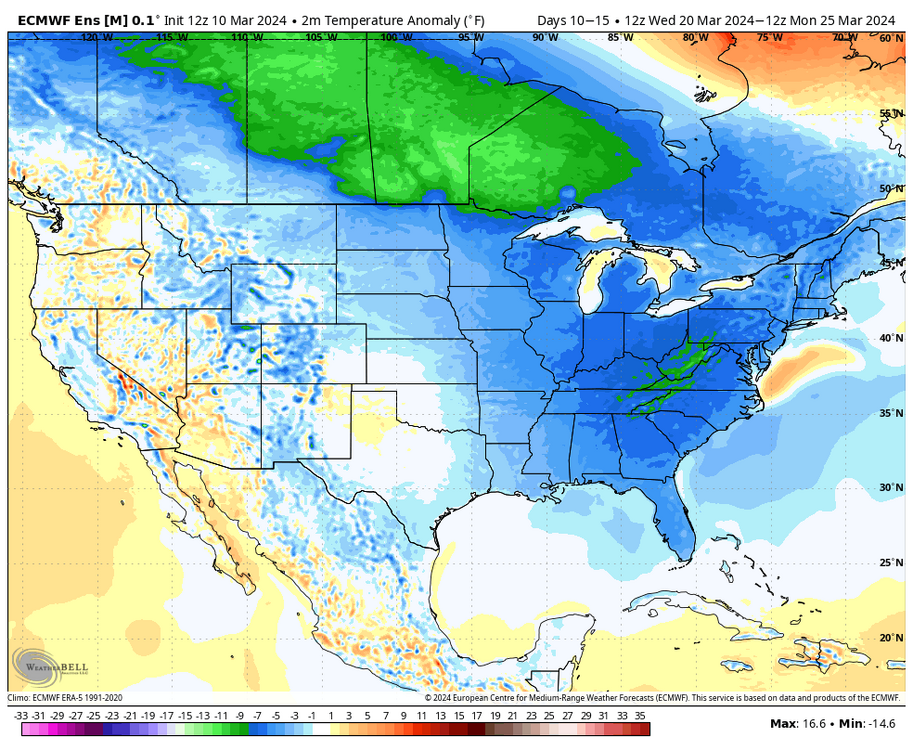
Same old pattern longer range as it’s now only a brief cool down days 6-10 before we warm up again. Models continue to struggle with these week 2 forecasts which have been running too cold all winter. The underestimation of the Southeast ridge or WAR has been going on since 15-16.
New run
Old run

-
5
-
3
-
-
Nice improvements from the 0z runs. We now have a shot at 3 days reaching 70° in the warmer spots from Wednesday into Friday. Looks like the backdoor stays just north of NYC into Friday. But sections just NE may get into onshore flow.


-
3
-
-
6 hours ago, Volcanic Winter said:
Yeah I can’t even imagine, that does appear to have been a close facsimile of a LIA winter. If a similar pattern regime were to happen today, how modified do you think the airmass would be? Would think it’d still be significantly colder than any recent winter just not to the level of 76-77.
I do think we’re more than due for a winter with a colder pattern locking into the east, but perhaps the Pac temp regimes are unsupportive of such a thing happening, and who knows when that will change.
I’’m at the bargaining stage. Just give me one extended, relative “cold” winter compared to this post 2016 hothouse phase and I’ll be satisfied.
The NYC 3 coldest winters since the 28.4°in 76-77 were 93-94, 02-03, and 14-15. They were around 3° warmer than 76-77 at just under 32.0°. But we saw the big jump in winter temperatures since 14-15. So NYC may have warmed too much even see another winter like those below 32.0°. Our coldest winter since then was only around 36.0°.
The one consolation of all the warmth over the last 9 winters is NYC hasn’t seen any winter DJF average as far above the baseline as 31-32 was yet. 15-16 started out on a pace to surpass the 31-32 magnitude above the baseline but it slowed down. So if we eventually see that much of a NYC winter departure in the coming years, then it would mean NYC would get its first 43.5° winter.

-
3
-
-
26 minutes ago, Volcanic Winter said:
Really fascinating paper on the winter of 76-77, the last time the Chesapeake froze. Has some maps from other cold 20th century winters. Good read:
http://nwafiles.nwas.org/digest/papers/1977/Vol02No4/1977v002no04-Wagner.pdf
That was the only winter that I experienced which could be compared to the little ice age before the global temperatures took off like a rocket after 1980. Walking to the school bus stop was quite an experience. It was the last time NYC had a top 10 coldest winter averaging in the 20s.
-
1
-
-
1 hour ago, Allsnow said:
Windy today?
Deep mixing now with Newark gusting near 60 mph with the sun coming out and steepening the low level lapse rates.
Newark/Liberty CLOUDY 39 23 52 W43G59
-
2
-
-
20 minutes ago, Brian5671 said:
Interesting about how the LR models go to past climo-It looked like alot of them had a classic El Nino pattern in the LR (which were often dead wrong)-I wondered whether it was weighted towards climo....
That’s why all the EPS extended forecasts beyond day 15 defaulted to the past El Niño climo expectations of a trough in the East and a more robust Aleutian low. Instead we got the ridge south of the Aleutians and a very strong ridge in the East. This matches the La Niña background state over the past decade with frequent and amplified MJO 4-7 phases.


-
1
-
 1
1
-
-
Good to see others also noticing how the teleconnection patterns aren’t as cold as they used to be.
-
1
-
-
12 minutes ago, uofmiami said:
Doesn’t fit the narrative.
The EPS has been running too cold day 11-15 and the GEFS has been closer to reality at least for us. But they both have been more than 5° too cold to our west. So these long range cold forecasts have been correcting warmer the closer in we get.


-
4
-
-
First time NYC ever had 50.00”+of precipitation from July into early March.
Time Series Summary for NY CITY CENTRAL PARK, NY
Click column heading to sort ascending, click again to sort descending.RankEnding DateTotal Precipitation Jul 1 to Mar 9Missing Count1 2024-03-09 51.58 0 2 2012-03-09 49.54 0 3 1984-03-09 48.25 0 4 2019-03-09 48.12 0 5 2022-03-09 47.41 0 6 1914-03-09 46.20 0 7 1928-03-09 45.41 0 8 1976-03-09 45.36 0 9 1972-03-09 45.16 0 10 1890-03-09 44.27 0 -
2
-
2
-
2
-
-
Maybe graupel or small hail later today as we get some surface based CAPE. So gusty squall-like convection possible later today with gusts over 40 mph. Then we have a shot at 50-60 mph gusts tomorrow with the very steep lapse rates and increasing LLJ allowing deep mixing.


-
1
-
-
Warm minimums continue to dominate. The region is currently running +10 to +15 for the beginning of March. This has been the warmest on record for many locations like NYC.
Time Series Summary for NY CITY CENTRAL PARK, NY
Click column heading to sort ascending, click again to sort descending.RankEnding DateMean Min Temperature Mar 1 to Mar 9Missing Count1 2024-03-09 42.2 0 2 2004-03-09 41.9 0 3 1979-03-09 41.7 0 4 1974-03-09 40.4 0 5 1998-03-09 40.0 0

-
1
-
-
The warm spots could see a few days this week making it to around 70° or higher. So this should add to the already high departures around +10 so far this month. The average highs will be in the low 50s by around the spring equinox. So the models showing colder for a time would mean upper 40s which isn’t too bad with the higher sun angle.


-
3
-
-
On 3/8/2024 at 11:20 PM, Snowstorms said:
Great post.
There's been a lot of comments about the warmth in the last couple of winters being driven by the -PDO but I don't think so. Just a quick glance at the SST maps can tell you how atypical the current -PDO looks despite a deeply negative anomaly. I believe the period between 1998-2014 was the last time we had a true -PDO phase and it was quite reflective in the Pacific ssts. And we experienced several cold winters in that period especially from 2007-2015. Maybe a strong La Nina may shift those anomalies and also drive down Pacific SST's especially off the coast of Japan and in the WPAC. The warm Atlantic and +AMO don't help us either.
A poleward Aleutian ridge if linked with Atlantic blocking can be beneficial for the east too. It may not be a super cold pattern as the EPO would be neutral, but it would be below normal overall. If I'm not mistaken, we saw that in December 2010.
Yeah, the subtropical warming especially in the western ocean basins is more of a climate change signal than a -PDO signal even though both are overlapping.
https://www.nature.com/articles/s43247-023-00839-wIn this study, we evaluate the ocean warming pattern derived from four decades of satellite measurements. We find widespread strong subtropical ocean warming, concentrating mostly on the western ocean basins. In contrast to these observations, studies of paleoclimate suggest that the greatest ocean warming occurs at higher latitudes. By pairing the observed warming pattern with SST evolution in long-term climate simulations, we propose that the observed warming pattern is constrained by ocean dynamics of surface convergence (downwelling, subtropical gyres) and divergence (upwelling, subpolar gyres) rather than being dominated by internal variabilities, such as the PDO. This pattern emerges only at the early stage (a few decades) of anthropogenic warming when absorption of heat concentrates in the upper ocean. On centennial (for the Northern Pacific Ocean) to millennial (for the North Atlantic Ocean and Southern Hemisphere) timescales, when deep ocean water warms, the greatest ocean warming is expected to occur in the subpolar region, as indicated by paleo-reconstructions and the long-term and equilibrium climate simulations.

-
3
-
2
-
-
This is an important new study which highlights how quickly the WAIS could go if warm water gets underneath.
CNN —Evidence from a 2,000-foot-long ice core reveals that the West Antarctic Ice Sheet shrank suddenly and dramatically around 8,000 years ago, according to new research — providing an alarming insight into how quickly Antarctic ice could melt and send sea levels soaring.
Part of the ice sheet thinned by 450 meters (1,476 feet) — a height greater than the Empire State Building — over a period of just 200 years at the end of the last Ice Age, according to the study published Wednesday in the journal Nature Geoscience.
It’s the first direct evidence that shows such a rapid loss of ice anywhere in Antarctica, according to the study’s authors.
While scientists knew the ice sheet was bigger at the end of the last Ice Age than today, much less was known about when exactly that shrinking happened, said Eric Wolff, a glaciologist at the University of Cambridge in the UK and a study author.
This study changes that, he told CNN. “We’ve been able to say exactly when it retreated, but we’ve also been able to say how fast it retreated.”
Now it’s clear the ice sheet retreated and thinned very rapidly in the past, Wolff said, the danger is that it could begin again. “If it does start to retreat, it really will do it very fast,” he added.
That could have catastrophic consequences for global sea level rise. The West Antarctic Ice Sheet holds enough water to raise sea levels by about 5 meters – more than 16 feet — which would cause devastating flooding in coastal towns and cities around the world.
The study is “an excellent piece of detective work” about a major part of the Antarctic ice sheet, said Ted Scambos, a glaciologist at the University of Colorado Boulder.
The key message is “the amount of ice stored in Antarctica can change very quickly — at a pace that would be hard to deal with for many coastal cities,” he told CNN.
It was a surprise when the data revealed just how quickly the ice had thinned at the end of the last Ice Age, Wolff said. “We actually spent a lot of time checking that we hadn’t made a mistake with the analysis.”
The West Antarctic Ice Sheet is particularly vulnerable to climate change, because the land under it is below sea level and slopes downward. When warm water gets underneath, it can melt very fast. “It can have a runaway process, and that’s evidently what happened 8,000 years ago,” Wolff said.
What makes the findings so alarming, said Isobel Rowell, an ice core scientist at the British Antarctic Survey and a study co-author, is that once that runaway happens “there’s really very little, if anything, that we can do to stop it,” she told CNN.
The crucial thing “is not to test it too far,” Wolff said, and that means tackling climate change. “We can avoid these tipping points still,” he said.
The new data will help improve the accuracy of the models scientists use to predict how the ice sheet will respond to future global heating, the report says.
David Thornalley, an ocean and climate scientist at University College London, said the study’s data was “striking.” He cautioned that as the study looked at a period 8,000 years ago, when climate conditions were different, the results aren’t a direct example of what could happen today. But, he added, they are still able to offer an “insight into the way that ice sheets can collapse.”
The study comes as scientists continue to sound the alarm about what is happening to the Earth’s most isolated continent.
For example, the Thwaites Glacier, also in West Antarctica, is melting rapidly. A 2022 study said the Thwaites — dubbed the Doomsday Glacier for the catastrophic impact its collapse would have on sea level rise — was hanging on “by its fingernails” as the planet warms.
This new study adds to these concerns, Scambos said. “(It) shows that the very same processes we are seeing just beginning now, in areas like Thwaites Glacier, have played out before in similar areas of Antarctica and indeed, the pace of ice loss was equal to our worst fears about a runaway ice loss.”
-
 1
1
-
-
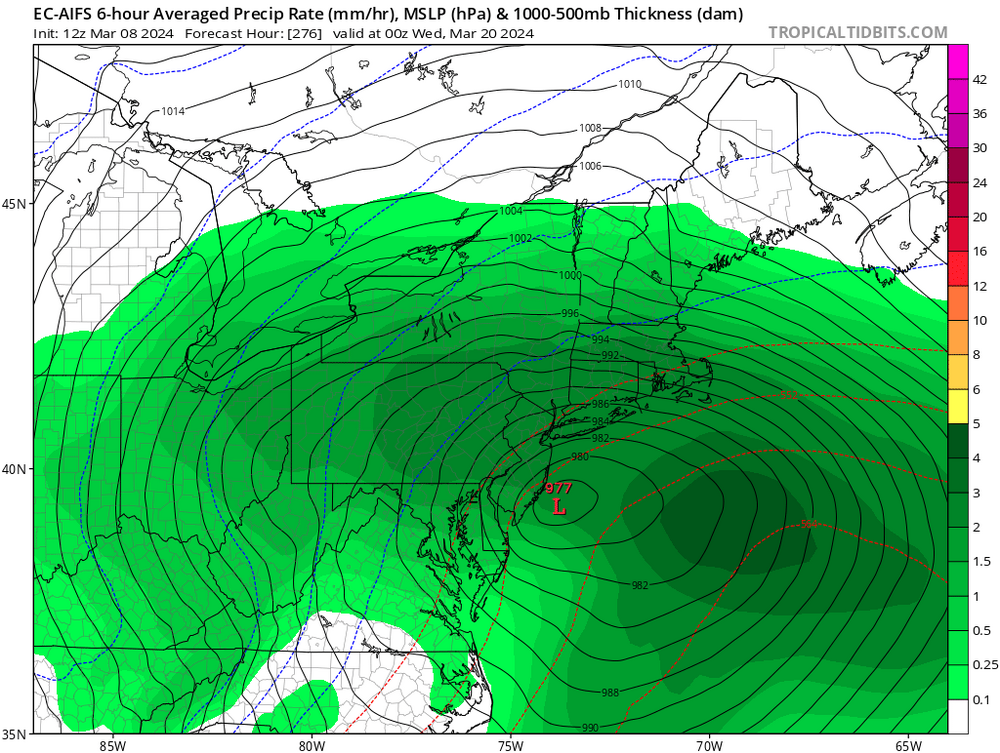
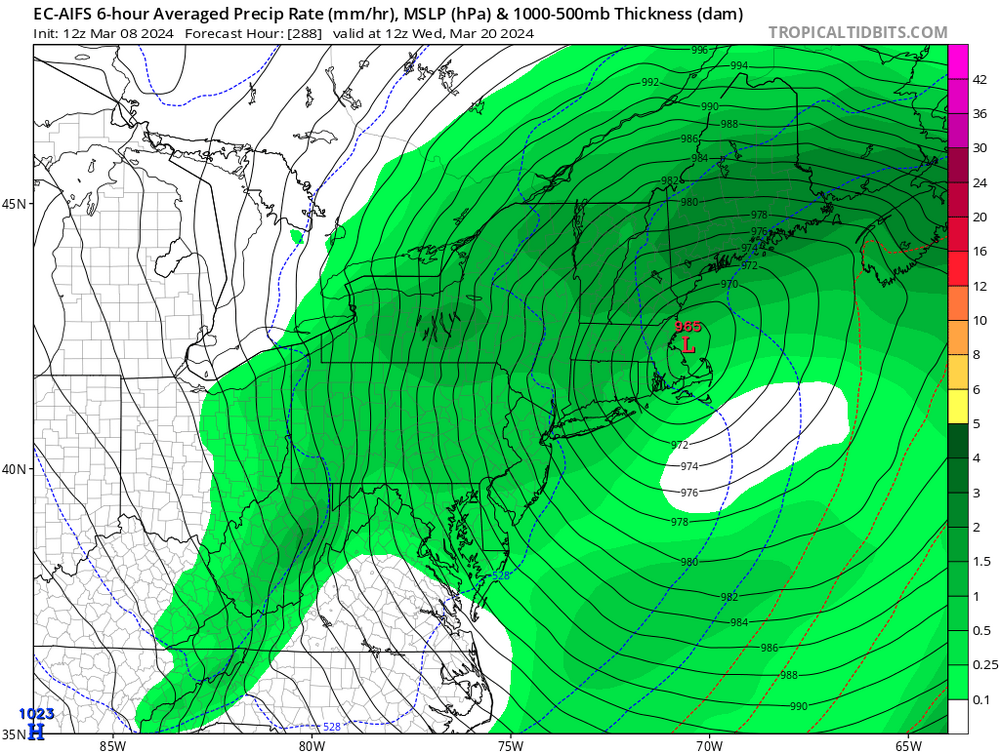
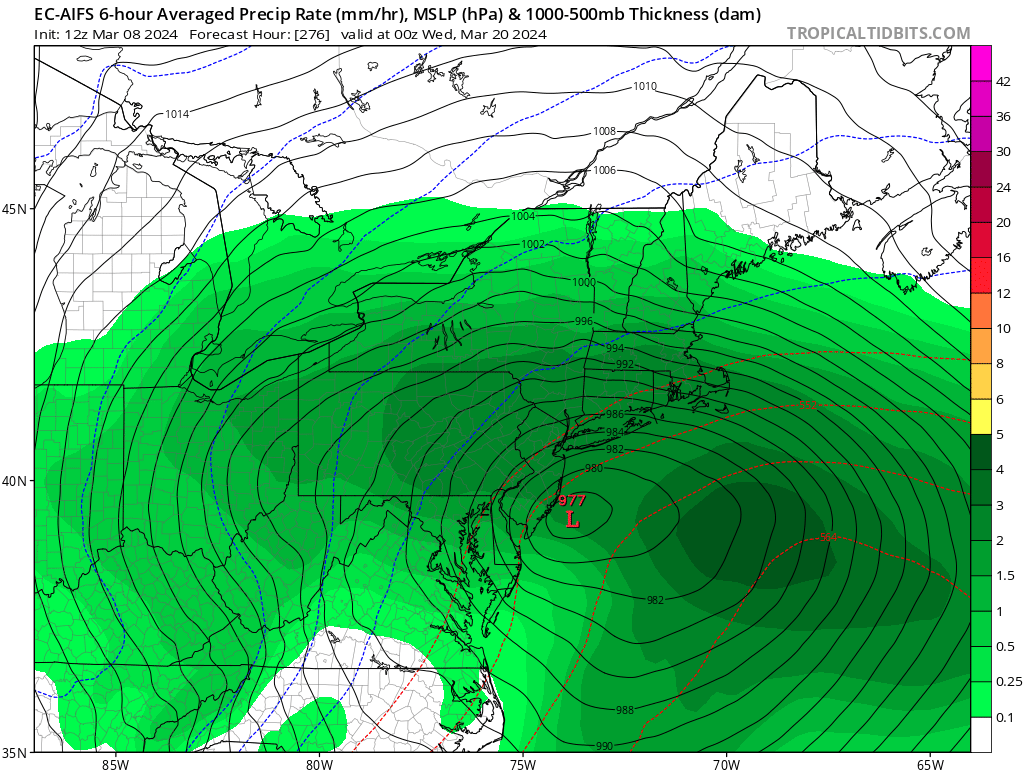
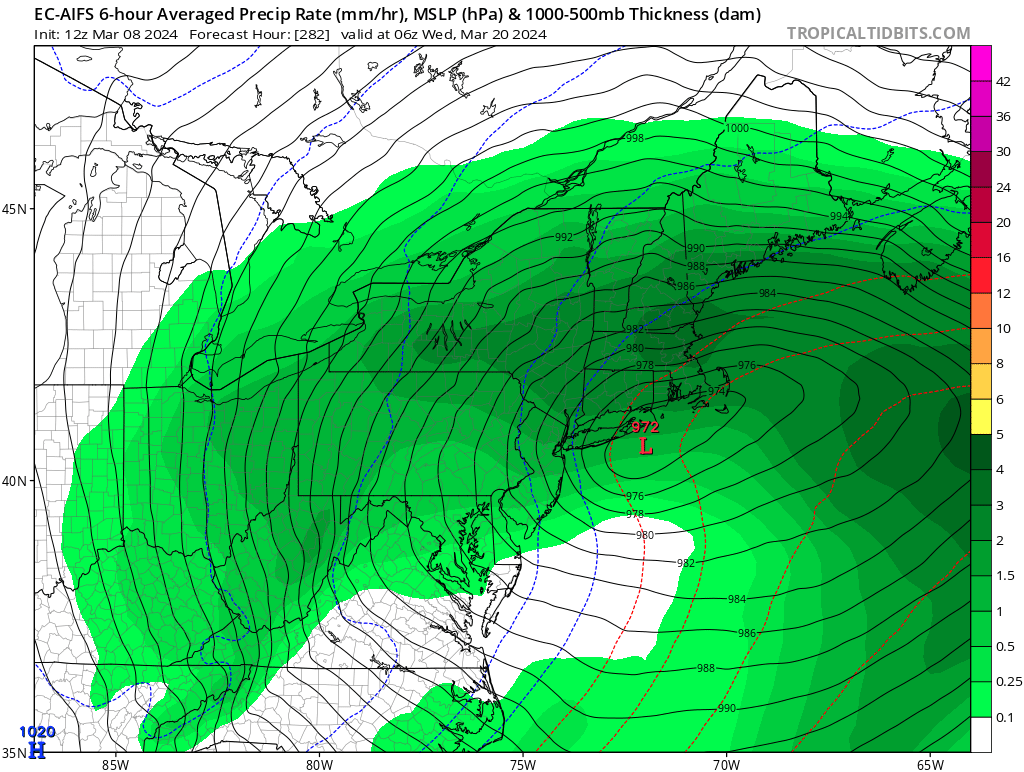
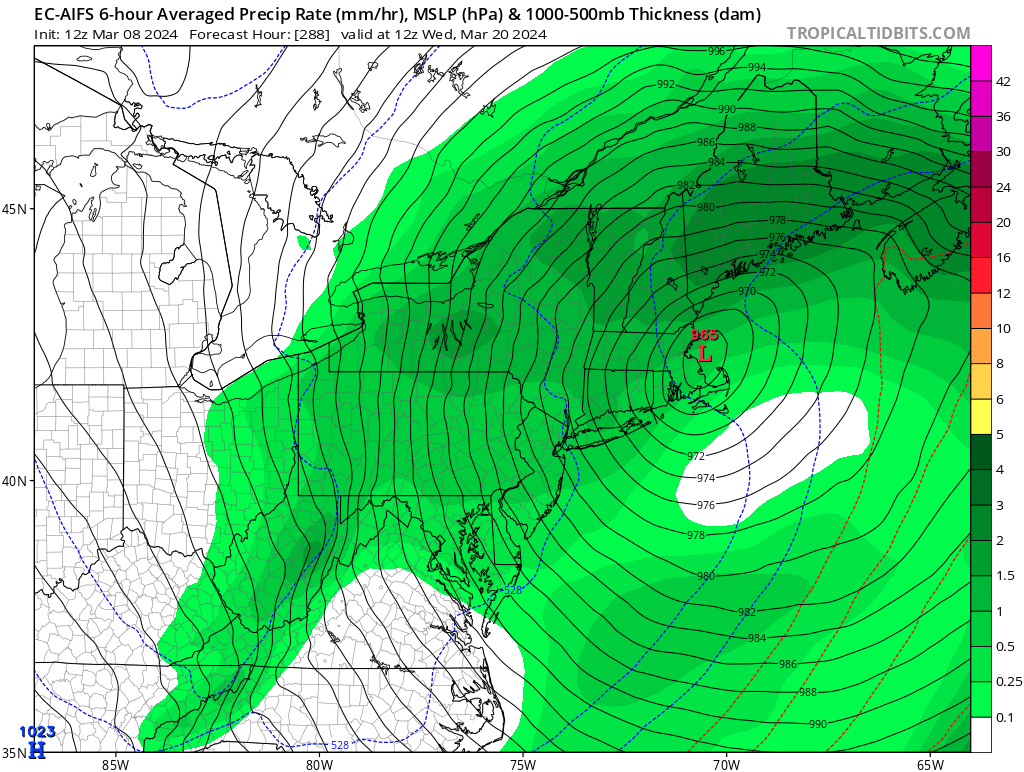
Nice pocket of MUCAPE with the system tonight. So heavy thunderstorms could be in the mix. While not technically meeting the definition, possible W to NW sting jet-like event from Sunday into Monday. Very steep low level lapse rates coupled with the LLJ strengthening behind the upper low. I would say we could see 24 hours or more of continuous gusts 45-50 mph in most locations. But there exists the potential for some 60 mph + gusts in spots which could include the higher elevations. So the wind chill factor will make it feel more like late winter rather than early spring.


-
6
-
1
-
-
25 minutes ago, Allsnow said:
So next winter the euro op with go out to day 15?
Should be fun.
")
The HRES is still produced and disseminated. It is meteorologically equivalent to the ENS 'control', but due to some technical and configuration differences, it does not provide completely identical outputs. The HRES runs for 10 days, while the ENS control runs for 15, and the HRES is disseminated earlier than the full ensemble forecast.
Our aim is to stop using the term ‘high-resolution forecast’, or HRES, as all members of the ensemble are now also at 9 km horizontal resolution.
For the next IFS upgrade, Cycle 49r1, planned for October 2024, the HRES and the ENS control are being made bit identical. Both will run to 15 days for 00 and 12 UTC.
From IFS Cycle 50r1, planned for October 2025, we will stop producing the current ENS control, and the data stream that is currently called the HRES will be called ‘ENS control’ instead. This single, unperturbed forecast will continue to be made available earlier than the ensemble perturbed members, in line with the agreed dissemination schedule.
-
1
-
-
27 minutes ago, MJO812 said:
AI is consistent
Just more cold air we need
I'm tracking this

It has a long range cold bias so far and will probably trend warmer like it did for the storm this weekend.
-
1
-
-
4 hours ago, donsutherland1 said:
Some additional data:
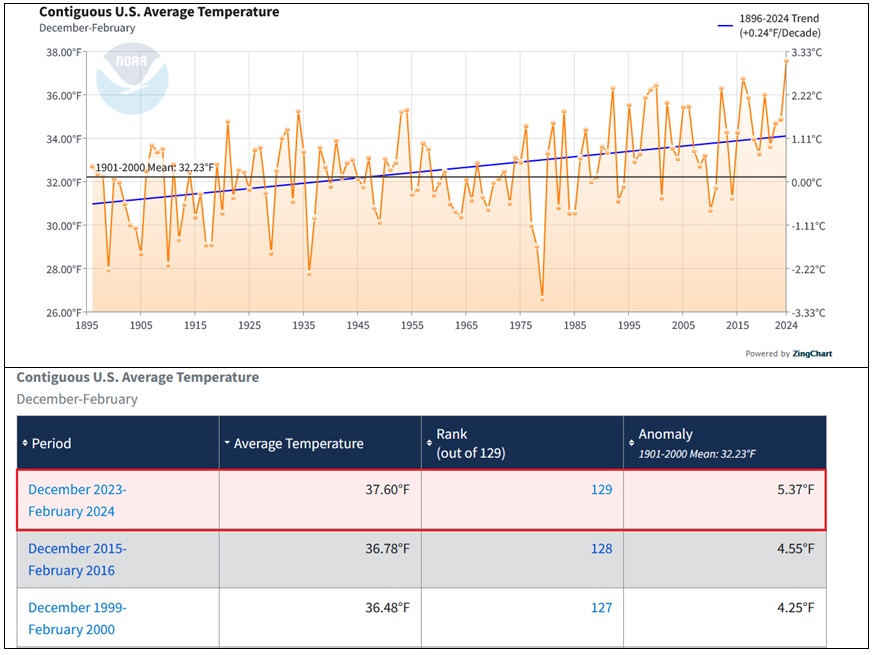
Yeah, this was also the warmest winter on record for the Northeast. First time time the region had 9 consecutive warmer than average winters in a row. With 5 top 10 warmest winters since 15-16.

-
2
-
-
28 minutes ago, jm1220 said:
Yep it’s crazy, and it must be driving these roaring Pacific Jet patterns that inundate us with warmth. In this era maybe the only way that changes is a competing marine heatwave somewhere else.
Yeah, there have been many comments on the forum how this -PDO La Niña background state has been so much warmer especially during the winters than older -PDO La Niña years before 15-16. I think the record SST warming near Japan is going hand in hand with the warming in the MJO 4-7 areas. So both those features tend to promote an Aleutian ridge near the Dateline and a ridge near the Eastern US. Notice how even with such a strong El Niño this winter there was still that ridge south of the Aleutians instead of the much stronger Aleutian low typical for strong El Niños.


-
1
-
-
24 minutes ago, jm1220 said:
Yay Perma-Nina. The Nina hangover pattern never really went away this winter from the last one, we have a very -PDO and boiling equatorial WPAC, and now we have an official probably mod-strong Nina for next winter. Hopefully we get a high ACE and it’s an East based Nina or we’re in big trouble next winter too.
This is a much warmer version of the -PDO for us defined more by the record marine heatwave near Japan than the cold ring off of California.
-
1
-
-
24 minutes ago, NEG NAO said:
IMO any airport is not an ideal environment for measuring snowfall or temperature - as for temperature why does Newark always come in much warmer especially in the summer with some of its readings ?
Airports are just as good if not better for measuring snowfall and temperatures than the neighborhoods that are nearby. The actual ASOS is away from the concrete on grassy strips like a backyard in the adjacent neighborhoods. Those local neighborhoods also have streets and driveways which are also made of concrete. We could make the case that our local airports probably aren’t the warmest spots in our area since they are located very close to the water which are subject to cooling sea breezes during the summer. There are places more inland of Newark with more 90° days. Newark only ranks 4th in 90° days since 2010 due to the breezes off the bay since the ASOS is right on the water.
Data for January 1, 2010 through December 31, 2022
Click column heading to sort ascending, click again to sort descending.NameStation TypeNumber of Days Max Temperature >= 90HIGHTSTOWN 2 W COOP 465 HARRISON COOP 459 FREEHOLD-MARLBORO COOP 453 Newark Area ThreadEx 439 NEWARK LIBERTY INTL AP WBAN 439 CANOE BROOK COOP 438 New Brunswick Area ThreadEx 414 NEW BRUNSWICK 3 SE COOP 414 -
1
-
-
20 minutes ago, NEG NAO said:
Not representative of the NYC metro area at all . Areas to the southwest across north and central NJ have measured 18 - 24 inches this season. And most other areas in the metro have reached past 10 inches..........
While LGA didn’t have the undermeasurement issues since they use professional contract observers, this was still the lowest 2 year snowfall on record for LGA. A 2 year average of only 7.0 and total of 13.9 was a new record low. Combined with consecutive winters above 40° this was officially the least winter-like 2 year period on record.

Time Series Summary for LAGUARDIA AIRPORT, NY - Oct through Sep
Click column heading to sort ascending, click again to sort descending.RankSeasonTotal SnowfallMissing Count1 1972-1973 1.9 0 2 2022-2023 3.4 0 - 2001-2002 3.4 0 3 1941-1942 3.6 0 4 2019-2020 4.6 0 5 2011-2012 5.1 0 6 1997-1998 7.1 0 7 1979-1980 10.3 0 8 2023-2024 10.5 208 9 1988-1989 10.8 0 10 2007-2008 11.2 0 - 1996-1997 11.2 0 Time Series Summary for LAGUARDIA AIRPORT, NY
Click column heading to sort ascending, click again to sort descending.RankSeasonMean Avg TemperatureMissing Count1 2001-2002 41.9 0 2 2015-2016 41.6 0 3 2022-2023 40.9 0 - 2016-2017 40.9 0 4 2011-2012 40.7 0 5 2023-2024 40.3 0


March 2024
in New York City Metro
Posted
One of the first indications how cold 76-77 was going to be was NYC getting down to 50° at the end of August. Then the 29° in October. So a tie of the all-time monthly minimum in August and 2nd coldest in October. Then single digits during the first week of December. None of which has been able to be replicated since then.
Click column heading to sort ascending, click again to sort descending.
Click column heading to sort ascending, click again to sort descending.
Click column heading to sort ascending, click again to sort descending.