

frd
-
Posts
6,474 -
Joined
-
Last visited
Content Type
Profiles
Blogs
Forums
American Weather
Media Demo
Store
Gallery
Posts posted by frd
-
-
84 here with a dew point of 56, feels so much better than yesterday. Low tonight is forecasted to be 61 .
-
 1
1
-
-
WPC beefing up rainfall potential days 6 AND 7
.gif.99cd05c428276b3be087b6cd91f28048.gif)
-
1
-
-
WPC shows the low pressure in the SE moving just offshore with very heavy rainfall.
.gif.ec9b4cfa2ce3ed9fb761778c37ca7c95.gif)
-
56 minutes ago, Weather Will said:
WB 12Z EPS. Dry and seasonably warm the next week. Perfect July 4th weekend!

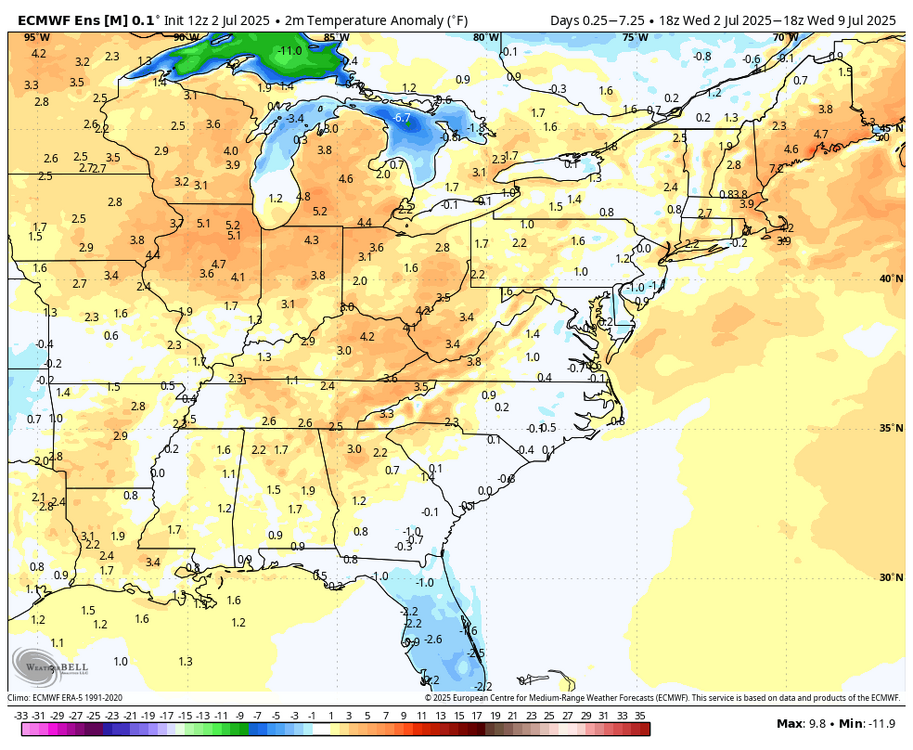
Appears the heat dome builds further West this time. Not as extreme here.
-
2
-
-
Clearing line reaching DC and moving East. However, dew points are still rather high even at locations far to the West of DC.
-
 1
1
-
-
.75 here last 24 hours but those two areas to my SW and South have scored with over 1.50 and 2 inches. Bethany Beach with over 4.9 inches of rain this week. Will add to that today and the final push of convection moves East and then offshore.
-
1 hour ago, CAPE said:
Dover radar effed up again. I was looking at it this morning when it was pouring here and it had nothing over me- it was depicting reflectivity from sometime earlier.
062 NOUS61 KAKQ 020837 FTMDOX Message Date: Jul 02 2025 08:37:56 KDOX RADAR HAS BEEN PLACED IN STANDBY MODE DUE TO DEGRADED VELOCITY DATA.
Noticed that two days ago. I had to go to the next radar site to the West. Always seems to be an issue.
-
Pretty blah here. Just a shower, as the cells have either weakened or missed to the North. Last night with all the nail biting was much better.
However, it is early and we will see what the overnight brings.
-
Heat Index 102 at the Noon hour. -
Steam bath outside, DP at 76 yuck.
-
Severe thunderstorm warning here, a rather pretty nasty storm.
Mount Holly did well yesterday with a high probability of storms in NE MD and Northern De. today despite the cams. Beneficial rains for the garden and the lawn.
-
8 minutes ago, George BM said:
I got on radarscope and zoomed in as close as I could into that storm and I still counted nearly 100 lightning strikes on the map with most spots within 500ft of a recent CG.

Insane !
-
Complex and the tornado warning still moving NE
Dangersous lightening strikes
Severe Weather Statement National Weather Service Baltimore MD/Washington DC 824 PM EDT Mon Jun 30 2025 MDC025-010045- /O.CON.KLWX.TO.W.0029.000000T0000Z-250701T0045Z/ Harford MD- 824 PM EDT Mon Jun 30 2025 ...A TORNADO WARNING REMAINS IN EFFECT UNTIL 845 PM EDT FOR EAST CENTRAL HARFORD COUNTY... At 824 PM EDT, a severe thunderstorm capable of producing a tornado was located over Riverside, or near Aberdeen, moving northeast at 15 mph. HAZARD...Tornado and quarter size hail. SOURCE...Radar indicated rotation. IMPACT...For those in the direct path of a tornado touchdown, flying debris will be dangerous to those caught without shelter. Damage to roofs, siding, and windows may occur. Mobile homes may be damaged or destroyed. Tree damage is likely. This dangerous storm will be near... Aberdeen, Aberdeen Proving Ground, Riverside, and Perryman around 830 PM EDT. Other locations impacted by this tornadic thunderstorm include Harford Furnace, Abingdon, Carsins, Belcamp, and Edgewood. PRECAUTIONARY/PREPAREDNESS ACTIONS... TAKE COVER NOW! Move to a basement or an interior room on the lowest floor of a sturdy building. Avoid windows. If you are outdoors, in a mobile home, or in a vehicle, move to the closest substantial shelter and protect yourself from flying debris. Torrential rainfall is occurring with this storm, and may lead to flash flooding. Do not drive your vehicle through flooded roadways. && LAT...LON 3953 7607 3949 7611 3947 7607 3944 7605 3943 7627 3950 7634 3954 7624 3957 7612 3958 7610 TIME...MOT...LOC 0024Z 245DEG 11KT 3947 7628 TORNADO...RADAR INDICATED MAX HAIL SIZE...1.00 IN -
TORNADO WARNING
Tornado Warning MDC005-025-010015- /O.NEW.KLWX.TO.W.0028.250630T2339Z-250701T0015Z/ BULLETIN - EAS ACTIVATION REQUESTED Tornado Warning National Weather Service Baltimore MD/Washington DC 739 PM EDT Mon Jun 30 2025 The National Weather Service in Sterling Virginia has issued a * Tornado Warning for... Central Harford County in northern Maryland... East central Baltimore County in northern Maryland... * Until 815 PM EDT. * At 739 PM EDT, a severe thunderstorm capable of producing a tornado was located over Kingsville, or 8 miles north of Middle River, moving east at 15 mph. HAZARD...Tornado. SOURCE...Radar indicated rotation. IMPACT...For those in the direct path of a tornado touchdown, flying debris will be dangerous to those caught without shelter. Damage to roofs, siding, and windows may occur. Mobile homes may be damaged or destroyed. Tree damage is likely. * This dangerous storm will be near... Bel Air South, Bel Air North, Riverside, Pleasant Hills, and Perryman around 745 PM EDT. Other locations impacted by this tornadic thunderstorm include Fork, Benson, Joppatowne, Harford Furnace, Abingdon, Joppa, Upper Falls, Gunpowder, Belcamp, and Bradshaw. PRECAUTIONARY/PREPAREDNESS ACTIONS... -
Look at those towers going in this loop in Northern MD
https://www.star.nesdis.noaa.gov/GOES/sector_band.php?sat=G19§or=ne&band=GEOCOLOR&length=24
-
Continue to miss the cells, they develop a mile from me and then move NE and get stronger

Some new activity forming just North of Baltimore currently.
-
Insane explosion of convection in SE Delaware during the last 60 minutes. Very impressive, cloud tops going bonkers!
https://www.star.nesdis.noaa.gov/GOES/sector_band.php?sat=G19§or=ne&band=GEOCOLOR&length=24
-
1
-
-
Same areas in SE Delaware that got slammed yesterday are getitng slammed again today. Northern DE. also with storms. Flash Flood warning and severe storm warning posted in each area.
Of course I missed them again for the third day in a row.
-
1
-
-
8 minutes ago, CAPE said:
Slight risk for excessive rainfall too.
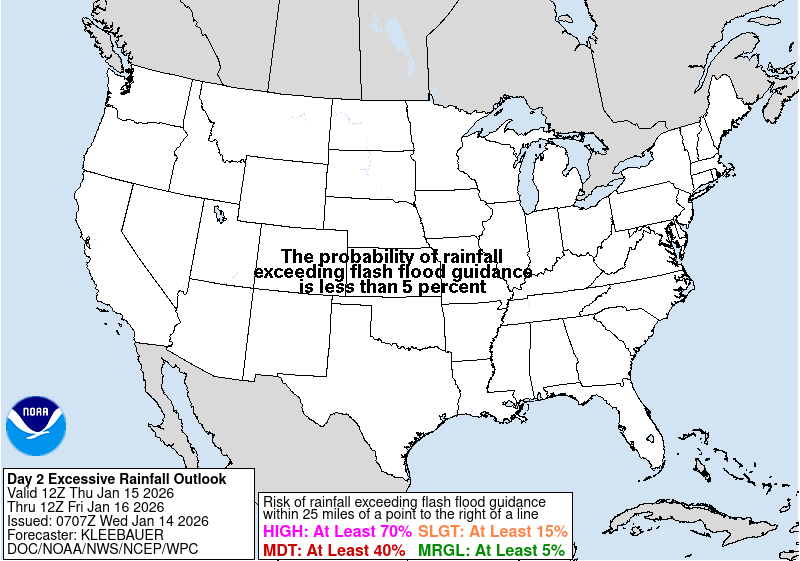
Mount Holly with PWAT values up to 2-2.5 inches for Tuesday, plus, frontogenetic forcing as well, mentioned below could enhance rainfall.
One other key impact point for Tuesday is a flash flooding threat. All of the area is in a Marginal (1/4) with Delmarva and portions of southern New Jersey and southeastern Pennsylvania in a Slight (2/4) risk in the Excessive Rainfall Outlook with the concern for localized flash flooding. PWAT values will rise to 2-2.5 inches with warm cloud depth of 10-12 kft, so the signal is there for the convection to be sufficient rainfall producers. The good news is that the convection will be moving but any training of showers or thunderstorms could lead to increased concern for localized flash flooding. There is also a signal for some frontogenetic forcing with the cold front which could also enhance the precipitation rates with the convection.
-
No rain here, but we have severe storm moving South at 5 mph near Dunalk, MD .
* Severe Thunderstorm Warning for... Southeastern Baltimore City in northern Maryland... Northeastern Anne Arundel County in central Maryland... Southeastern Baltimore County in northern Maryland... * Until 600 PM EDT. * At 531 PM EDT, a severe thunderstorm was located over Dundalk, or over Sparrows Point, moving south at 5 mph.
-
42 minutes ago, high risk said:
I’m not seeing much of a signal in the CAMs to support a higher PoP tomorrow out your way, but I hope it works out for you.
Meanwhile tracking a cell that is moving East to West towards my location currently, will be a nail bitter.
-
1
-
-
Interesting boundry across the lower Delaware Bay on radar, and several cells forming across NE Maryland in a West to East fashion and moving East
-
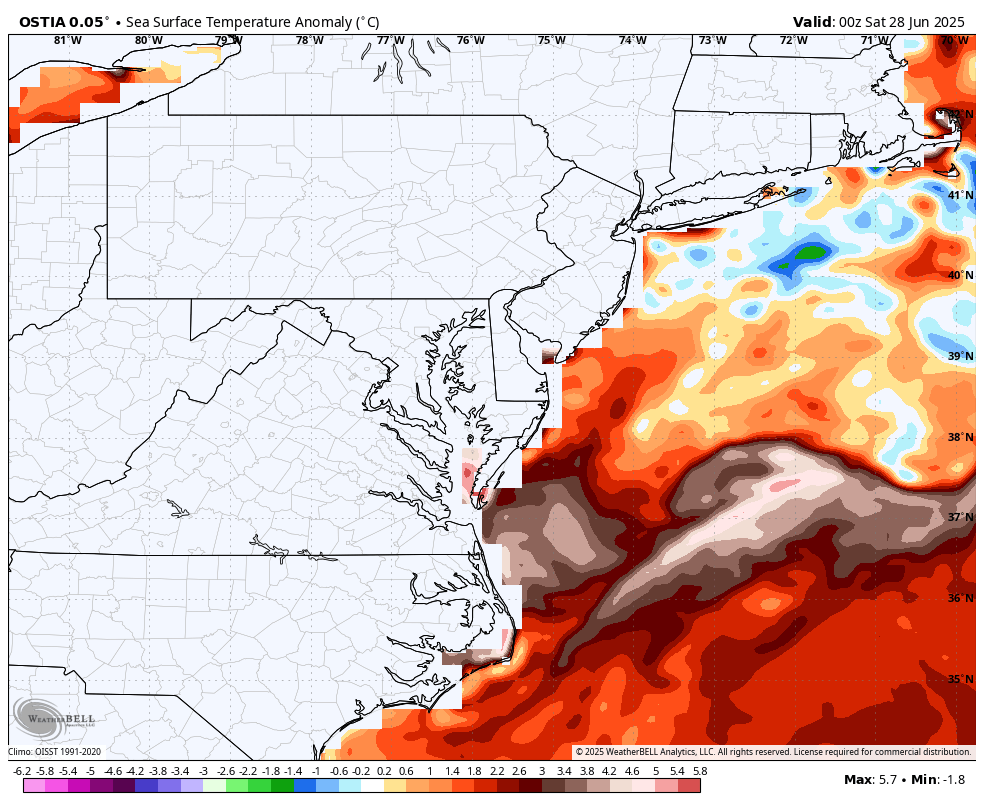
7 minutes ago, Weather Will said:
Warm ocean temps (WB), time to head to the beach...
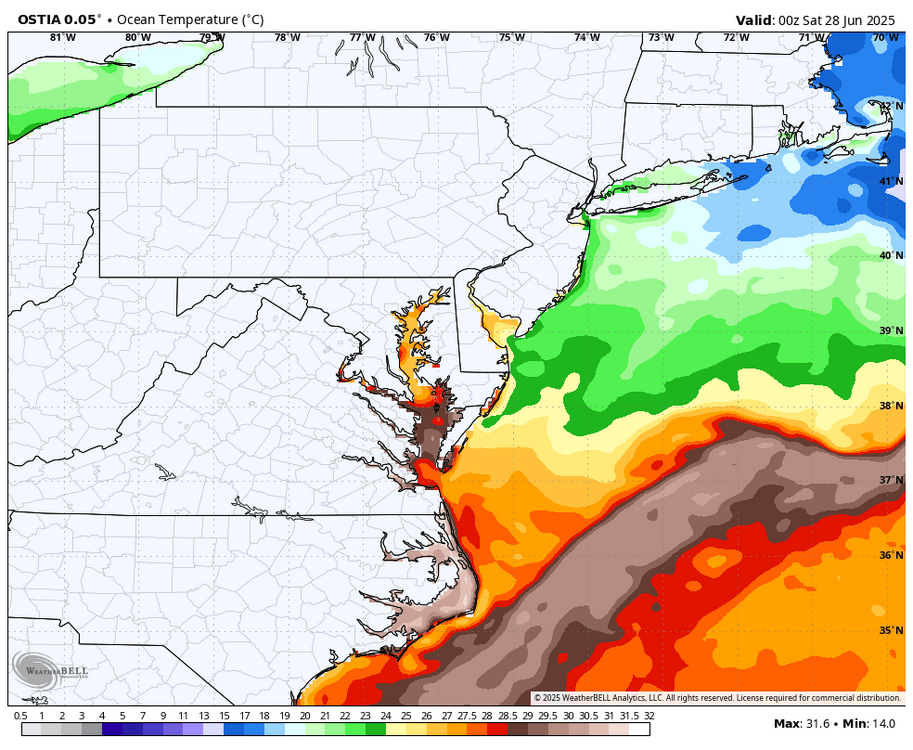

Hmm 23.5 C = 74.5 F, nice !
Please no jellies and no sea lice either.
-
 1
1
-
-
.gif.cd4030e6ed248dad61fdc8b7339e2721.gif) 12 hours ago, high risk said:
12 hours ago, high risk said:I'm not sure how much coverage there will be on Monday, but shear will be slightly improved (relative to today and tomorrow), and CAPE should be plentiful. It's probably a MRGL day with some potential for a late upgrade to a SLGT. A bigger threat might be localized flash flooding, with huge PW values and still relatively slow storm motion.
Mount Holly has increased the probabilities of rain from 50 % to likely at 70% here on Monday.
The event on Monday plus Tuesday's storms has produced the days 1 to 3 rainfall, which has increased from the WPC.
We should hopefully score some rain, with possible severe on Tuesday, as you mentioned, then several summer days around 86 to 88.
-
1
-

July Medium/ Long Range
in Mid Atlantic
Posted
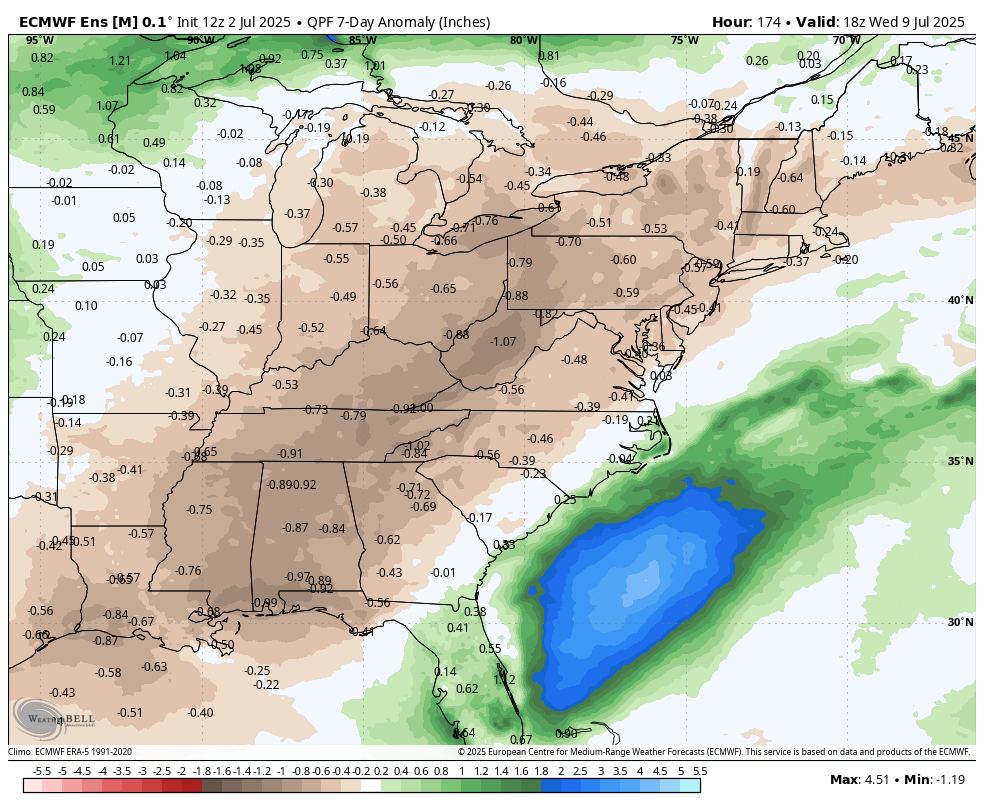
Afternoon update from the WPC ramps up the rainfall along the East Coast
WPC snippet
Showers and thunderstorms are expected to be focused in proximity to progressive cold fronts, stalled boundaries and
round the upper high in the Southern Rockies. The wavy front into the eastern U.S. may be a focus for heavier rain and
thunderstorms. This includes areas from the Corn Belt into the Midwest and Ohio Valley, Appalachians, Mid-Atlantic, and Northeast.