MGorse
-
Posts
2,254 -
Joined
Content Type
Profiles
Blogs
Forums
American Weather
Media Demo
Store
Gallery
Everything posted by MGorse
-
E PA/NJ/DE Spring 2026 Obs/Discussion
MGorse replied to PhiEaglesfan712's topic in Philadelphia Region
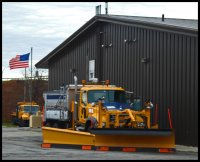
I took out my driveway markers today. -
E PA/NJ/DE Spring 2026 Obs/Discussion
MGorse replied to PhiEaglesfan712's topic in Philadelphia Region
Probably should merge this sub-forum with the NYC sub-forum. -
E PA/NJ/DE Spring 2026 Obs/Discussion
MGorse replied to PhiEaglesfan712's topic in Philadelphia Region
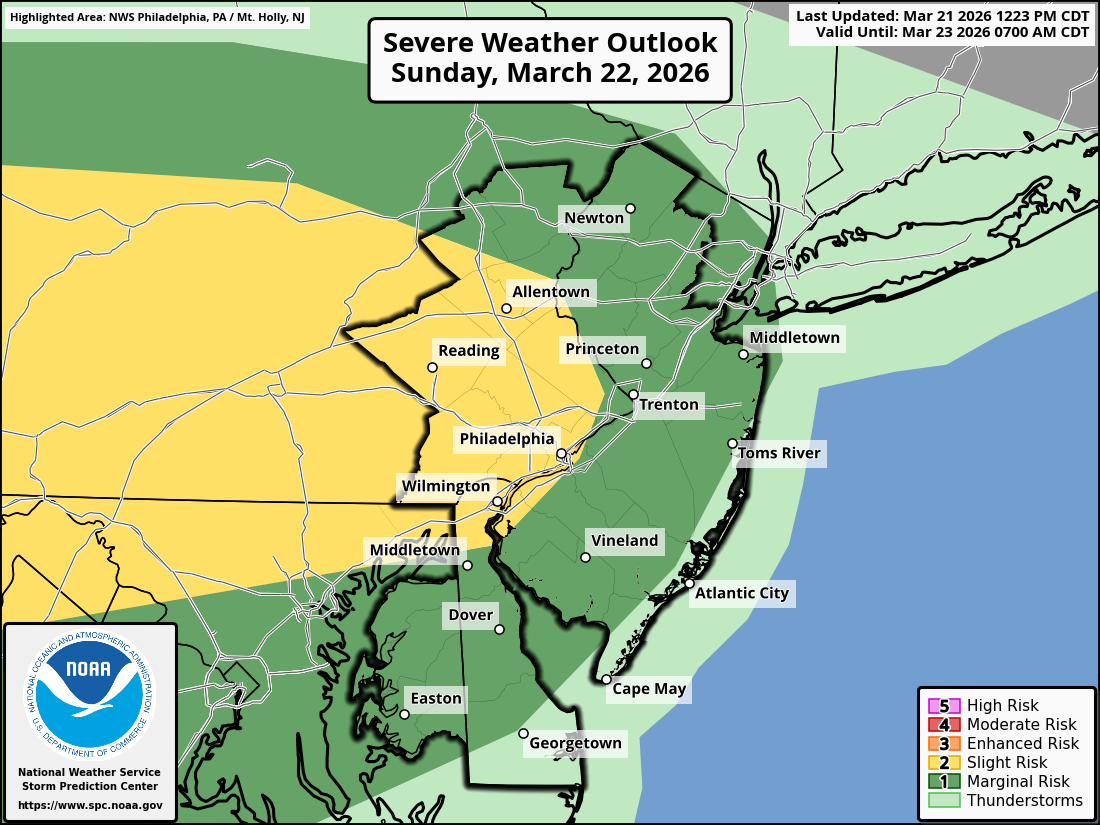
SPC outlook for tomorrow.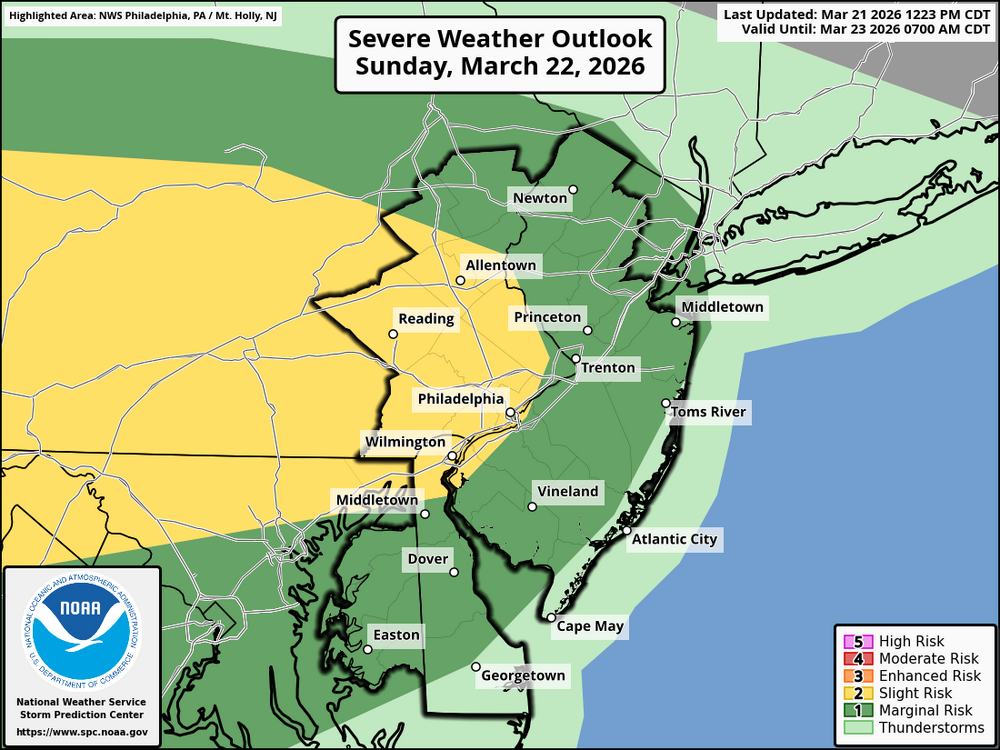
-
E PA/NJ/DE Spring 2026 Obs/Discussion
MGorse replied to PhiEaglesfan712's topic in Philadelphia Region
Yup, I had the backdoor open before the squall arrived and could hear the roar of the wind approaching. Classic low-topped squall line. -
E PA/NJ/DE Spring 2026 Obs/Discussion
MGorse replied to PhiEaglesfan712's topic in Philadelphia Region
Power flickered and saw several power flashes in the distance. Peak gust to 56 mph. -
E PA/NJ/DE Spring 2026 Obs/Discussion
MGorse replied to PhiEaglesfan712's topic in Philadelphia Region
This is how these types of events have been treated for decades. Also, not every spot in a warning experiences wind damage. -
E PA/NJ/DE Spring 2026 Obs/Discussion
MGorse replied to PhiEaglesfan712's topic in Philadelphia Region
Wrong message? This line has produced wind gusts to 68 mph. No AI. OMG! -
E PA/NJ/DE Spring 2026 Obs/Discussion
MGorse replied to PhiEaglesfan712's topic in Philadelphia Region
There is no AI influence in NWS warnings. They are issued by trained Meteorologists. -
E PA/NJ/DE Spring 2026 Obs/Discussion
MGorse replied to PhiEaglesfan712's topic in Philadelphia Region
Showers are convective as well. I know it seems odd having a Severe Thunderstorm Warning with no lightning, but that is the best way the NWS can handle these types of events. -
E PA/NJ/DE Spring 2026 Obs/Discussion
MGorse replied to PhiEaglesfan712's topic in Philadelphia Region
68 mph gust at the Reading airport! SPECI KRDG 170213Z 29041G59KT 1 1/2SM R36/4000VP6000FT +RA FEW021 BKN027 OVC035 09/06 A2927 RMK AO2 PK WND 28059/0211 WSHFT 0159 RAB08 PRESRR P0007 T00890061 -
E PA/NJ/DE Spring 2026 Obs/Discussion
MGorse replied to PhiEaglesfan712's topic in Philadelphia Region
It is convective (low-topped in this case) with severe wind gusts thus handled with Severe Thunderstorm Warnings. -
E PA/NJ/DE Spring 2026 Obs/Discussion
MGorse replied to PhiEaglesfan712's topic in Philadelphia Region
Yup, it looks like quite the temperature drop overnight. -
E PA/NJ/DE Spring 2026 Obs/Discussion
MGorse replied to PhiEaglesfan712's topic in Philadelphia Region
66 mph wind gust at Dulles with the narrow squall line! -
E PA/NJ/DE Spring 2026 Obs/Discussion
MGorse replied to PhiEaglesfan712's topic in Philadelphia Region
Meanwhile, heavy snow falling in western PA at this time. -
E PA/NJ/DE Spring 2026 Obs/Discussion
MGorse replied to PhiEaglesfan712's topic in Philadelphia Region
Disagree with your first sentence. -
E PA/NJ/DE Spring 2026 Obs/Discussion
MGorse replied to PhiEaglesfan712's topic in Philadelphia Region
There have been some wind damage reports mainly in the York and Harrisburg areas so far. https://www.spc.noaa.gov/climo/reports/today.html -
E PA/NJ/DE Spring 2026 Obs/Discussion
MGorse replied to PhiEaglesfan712's topic in Philadelphia Region
It is not just the wind direction that is a factor. All day the flow was southerly and it still is. A very messy warm sector with low cloud cover and showers today is what tempered the severe weather risk. Powerful cold front moves through later this evening and that should be accompanied by a low-topped line. That could still tap into the strong wind field to produce areas of damaging winds. -
E PA/NJ/DE Spring 2026 Obs/Discussion
MGorse replied to PhiEaglesfan712's topic in Philadelphia Region
The flow is southerly and not easterly. -
E PA/NJ/DE Spring 2026 Obs/Discussion
MGorse replied to PhiEaglesfan712's topic in Philadelphia Region
The tornado watch probably should not have included the coastal counties due to flow off the cold ocean. Along the NJ Shore it is currently only in the upper 40s to low 50s. -
E PA/NJ/DE Spring 2026 Obs/Discussion
MGorse replied to PhiEaglesfan712's topic in Philadelphia Region
Yup the tornado watches issued due to the strong shear profiles. The issue is all of the showers messing with the instability and thermal profiles in the lower levels. -
E PA/NJ/DE Spring 2026 Obs/Discussion
MGorse replied to PhiEaglesfan712's topic in Philadelphia Region
This is not a tropical system setup. Big difference. -
E PA/NJ/DE Spring 2026 Obs/Discussion
MGorse replied to PhiEaglesfan712's topic in Philadelphia Region
Except that southeast flow will increase the low-level rotation. In addition, this is a very dynamic system so not as much instability is needed for damaging storms. I do agree that the greatest severe risk is to our west and southwest. It will be very interesting to see how this plays out. -
E PA/NJ/DE Spring 2026 Obs/Discussion
MGorse replied to PhiEaglesfan712's topic in Philadelphia Region
0.1 inches of snow here. Not bad after lower 80s yesterday and low 60s early this morning. -
E PA/NJ/DE Spring 2026 Obs/Discussion
MGorse replied to PhiEaglesfan712's topic in Philadelphia Region
Temperature down to 33F here and snowing pretty good. Non-paved surfaces have a slushy coating. It is nearly 50 degrees colder now compared to this time yesterday! -
E PA/NJ/DE Spring 2026 Obs/Discussion
MGorse replied to PhiEaglesfan712's topic in Philadelphia Region
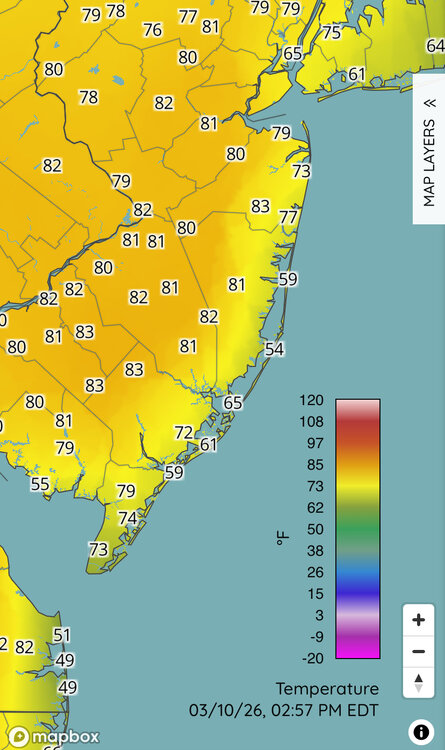
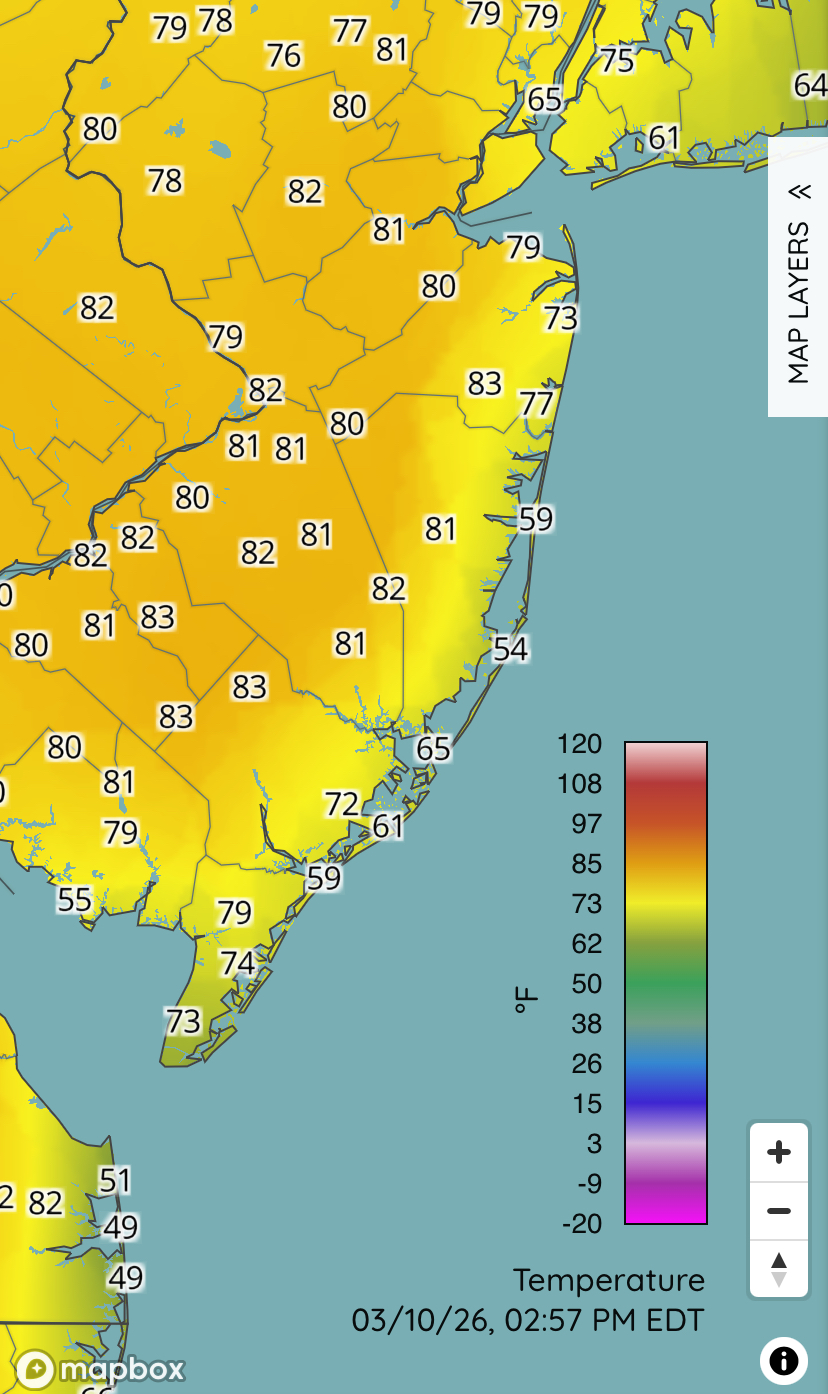
81F Quite the temperature gradient at the coast.