
ChescoWx
-
Posts
7,632 -
Joined
-
Last visited
Content Type
Profiles
Blogs
Forums
American Weather
Media Demo
Store
Gallery
Posts posted by ChescoWx
-
-
Widespread below freezing temps again this morning. We should see another day of below normal temps with highs struggling to escape the 40's to near 50 for most areas. Clouds will increase tonight as a storm continues to spin off the coast and will begin to push a marine layer from the ocean across the area from NE to SW tonight. Tomorrow looks cloudy and chilly again. Rain chances increase by Wednesday night into the day Thursday. May cause a delay till Friday for the Phillies home opener.Records for today: High 85 degrees in Phoenixville (1939) / Low 12 above in Kennett Square and Coateville (1896) / Rain 1.63" Kennett Square (1909) / Snow 4.5" East Nantmeal (2013)
-
Yesterday's 2.58" at Kennett Square broke the all station daily rain record in the county. The old record was the 1.96" at Glenmoore in 1977. Today was our 7th straight day with below freezing low temps. The next couple days will be sunny but continuing our run of below normal temps. Near normal temps (low to mid 50's) should continue for much of the upcoming week. Next rain chances are Wednesday and Thursday.Chester County wide records for today: High 81 West Chester (2012) / Low also in West Chester at 12 degrees (1897) / Record rain 2.11" Chester Springs (2021) / Snow 3.5" Coatesville (1965)
-
Lows this AM were as cold as 19.3 in Warwick Township this AM - our coldest morning since back on February 25th. Sunny and below normal temps today before the rainstorm moves in tonight through tomorrow. The NWS has a flood watch posted for over 3 inches of rain for much of the area. Sunny and continued chilly by Sunday.County wide records for today: The earliest 90 degree reading was today in Phoenixville back in 1948 / Low 6 above at both Devault and Phoenixville in 1956 / Rain 5.23" in Chadds Ford in 2000/ Snowfall 7.0" in West Grove in 1964
-
 1
1
-
-
Lows this AM were as cold as 19.3 in Warwick Township this AM - our coldest morning since back on February 25th. Sunny and below normal temps today before the rainstorm moves in tonight through tomorrow. The NWS has a flood watch posted for over 3 inches of rain for much of the area. Sunny and continued chilly by Sunday.County wide records for today: The earliest 90 degree reading was today in Phoenixville back in 1948 / Low 6 above at both Devault and Phoenixville in 1956 / Rain 5.23" in Chadds Ford in 2000/ Snowfall 7.0" in West Grove in 1964
-
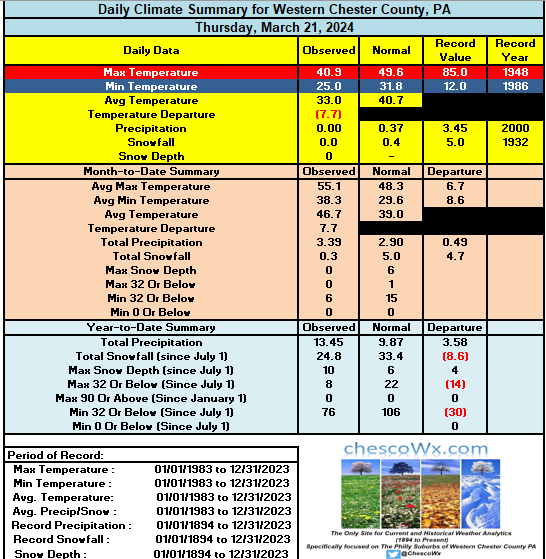
We saw widespread 20's across the area this morning and temps today will struggle to reach the mid-40's. This is almost 10 degrees below normal levels for late March. Today and Friday will be sunny but a developing noreaster will move up the coast with rain starting by later Friday night and lasting through the day on Saturday. We could see almost 2 inches of rain before ending Saturday night.County wide records for today: High 88 degrees Phoenixville (1948) / Low 7 above Phoenixville (1965) / Rain 2.52" Nottingham (2019)/ Snow 13.0" Devault (1958)
-
1
-
-
We saw widespread 20's across the area this morning and temps today will struggle to reach the mid-40's. This is almost 10 degrees below normal levels for late March. Today and Friday will be sunny but a developing noreaster will move up the coast with rain starting by later Friday night and lasting through the day on Saturday. We could see almost 2 inches of rain before ending Saturday night.County wide records for today: High 88 degrees Phoenixville (1948) / Low 7 above Phoenixville (1965) / Rain 2.52" Nottingham (2019)/ Snow 13.0" Devault (1958)
-
16 minutes ago, chubbs said:
I see why you like the "averaging" method. It shows less warming than the data collected in your own backyard

Of course this actual raw data is way beyond my backyard
-
3 hours ago, chubbs said:
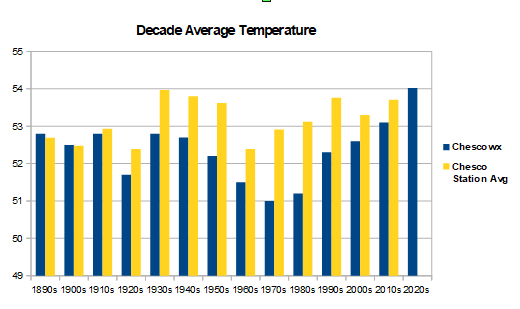
Your county averaging method doesn't agree with your own Chescowx series and the year-to-year differences are probably even larger; smoothed somewhat by the decade averaging. Not surprising because you aren't controlling for differences in average temperature between stations. Every time you add or subtract a station you change the average.
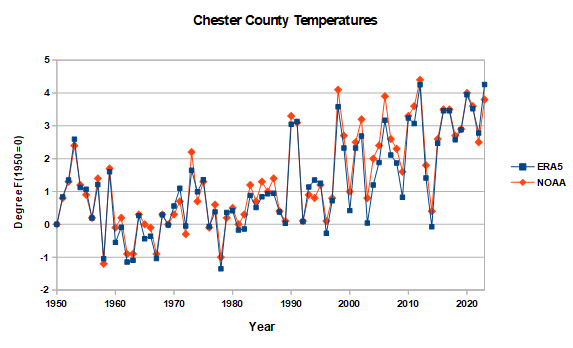
NOAA on-the-other-hand agrees very well with the ERA5 re-analysis developed by EMWCF, both on year-to-year temperature changes and on the overall warming since 1950. NOAA and ERA5 are completely independent using different datasets and methods, so agreement at the County level increases confidence in both series. Bottom-line - scientists have a good handle on Chester County temperature trends. If you aren't matching NOAA or ERA5 you aren't getting an accurate depiction of our local climate. Below is a link which provides background on ERA5, which has land temperature data back to 1950. Note that I can only get ERA data for a lat/long square that approximates Chesco.
https://climate.copernicus.eu/climate-reanalysis
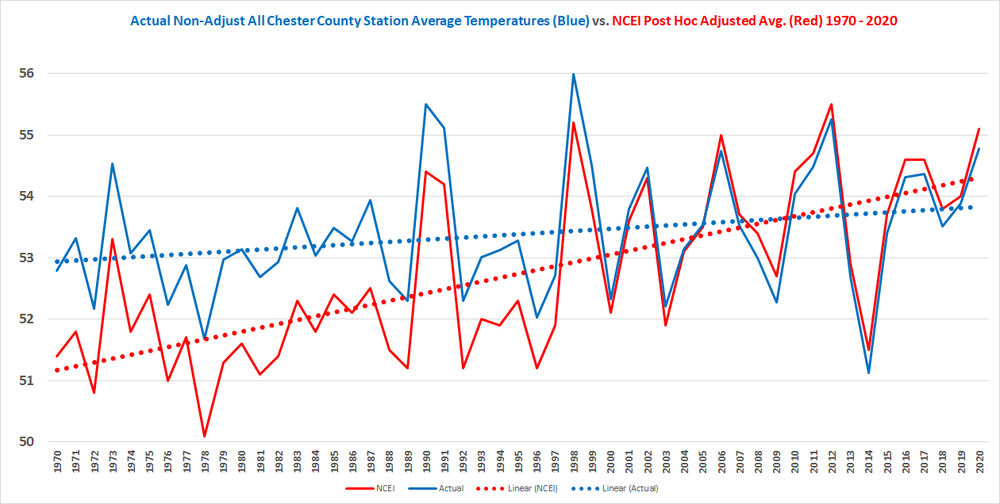
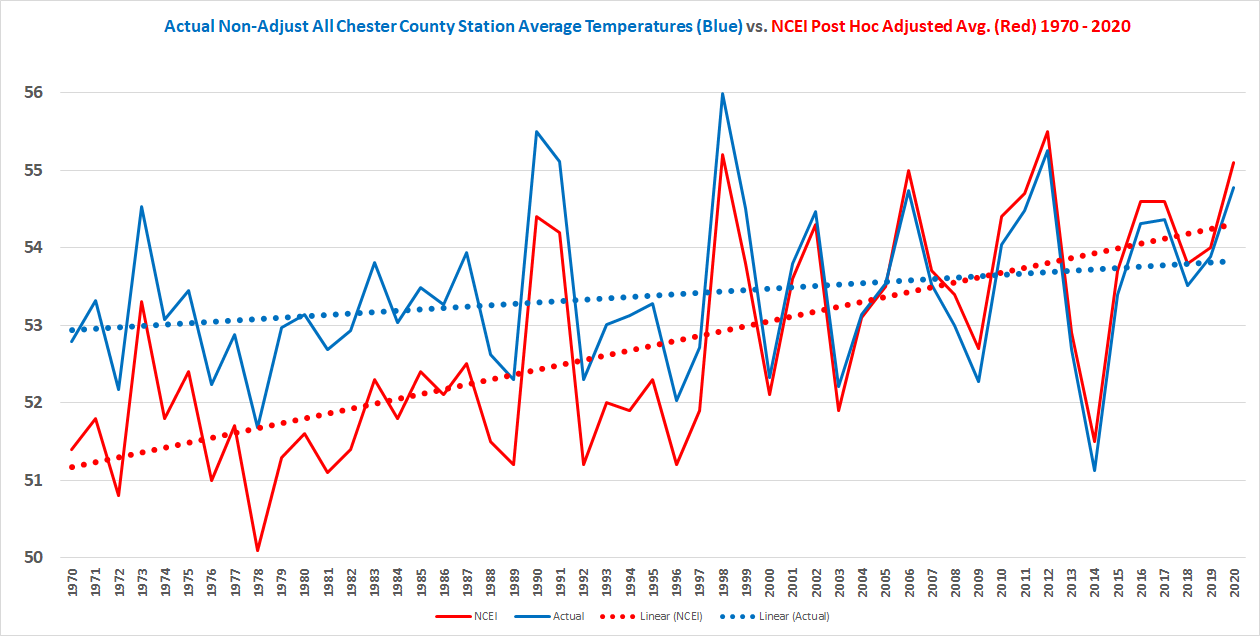
In reality Charlie quite the opposite....as you add more stations you decrease variability when averaging. There is no need to "control" or change the actual data after the fact. I have all available possible stations that should be in the NCEI Chester County average. Below is all available actual stations temps vs the post hoc adjusted averages just since 1970. You can as always see the significant cooling adjustments applied to the 1970's-1980's and 1990's....and then of course the gentle warming adjustments to the 2000's and 2010's. No wonder we only like to show the scary red after adjustments on TV and here....it clearly does a much better job supporting the climate alarmists agenda! If we showed the raw data it would not be alarming at all!! So Charlie we discussed earlier why we had to chill the 1920s/1930's/1940's (time of obs etc.) so what was the reason for the continued cooling after the fact adjustments from the 1970's thru 1990's and now the warming adjustments being applied over the last 20 years?? Was it time of obs bias? station siting? bad equipment?? If any of the above can you show us by station which ones were problematic and how the applied adjustments were calculated?
-
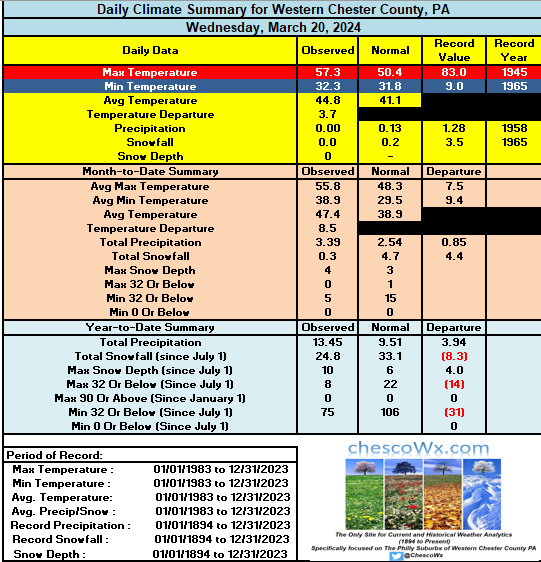
Today will be the warmest day of the month and as we move into next week we should see well below normal temps for at least the next week and likely normal to below temps for the rest of the month of March. Rain chances ramp up by tomorrow PM and last into Friday night.County wide records for today: High 84 West Chester (1990) / Low 3 above Coatesville (1896) / Rain 2.51" Kennett Square (1912) / Snow 11" Glenmoore (1993)
-
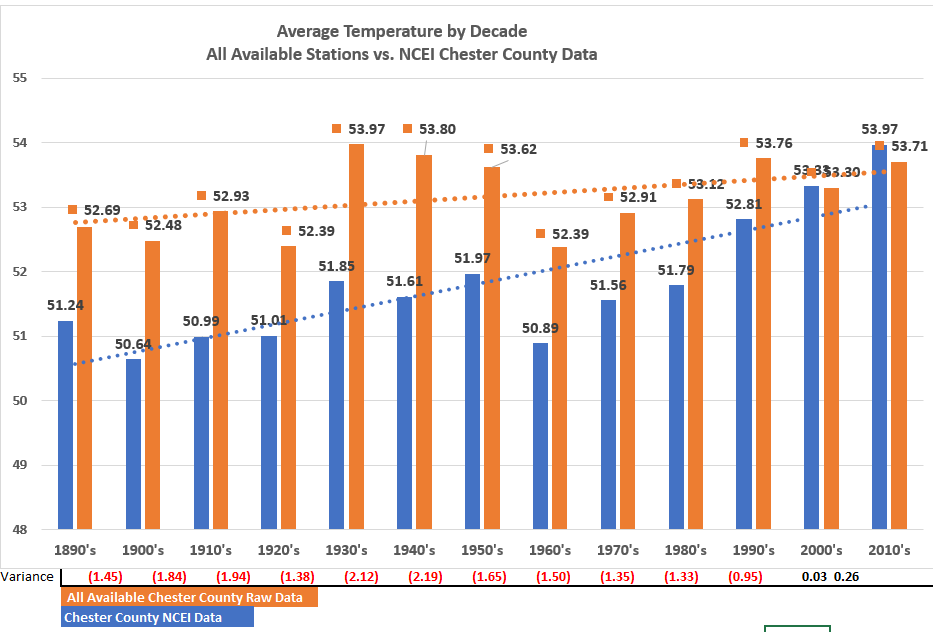
And again below is all stations with up to 17 actual reporting sites included in the most recent 2 decades. The same pattern of large chilling adjustments for 111 years and now increasing warming adjustments as you can clearly see during the past 2 decades. Why the post observation warming adjustments of 0.3 degrees in the 2010's? Is it time of obs? bad equipment? Do we know the exact answer??
-
1
-
-
12 hours ago, chubbs said:
As usual you are jumping to the wrong conclusion based on lousy analysis. You aren't controlling for differences in average temperature between stations. Every time you change the stations included in your County average, you get a different result. To get a cooler result add in some relatively cool stations. I don't see any recent "warming adjustment" for NOAA when I compare to your own Chescowx series. Quite the contrary NOAA and Chescowx are in good agreement on the warming rate over the past 54 years. Good news for your post-1970 data.
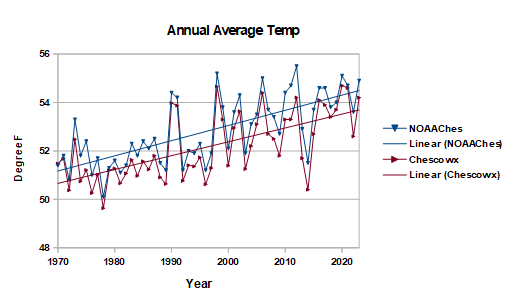
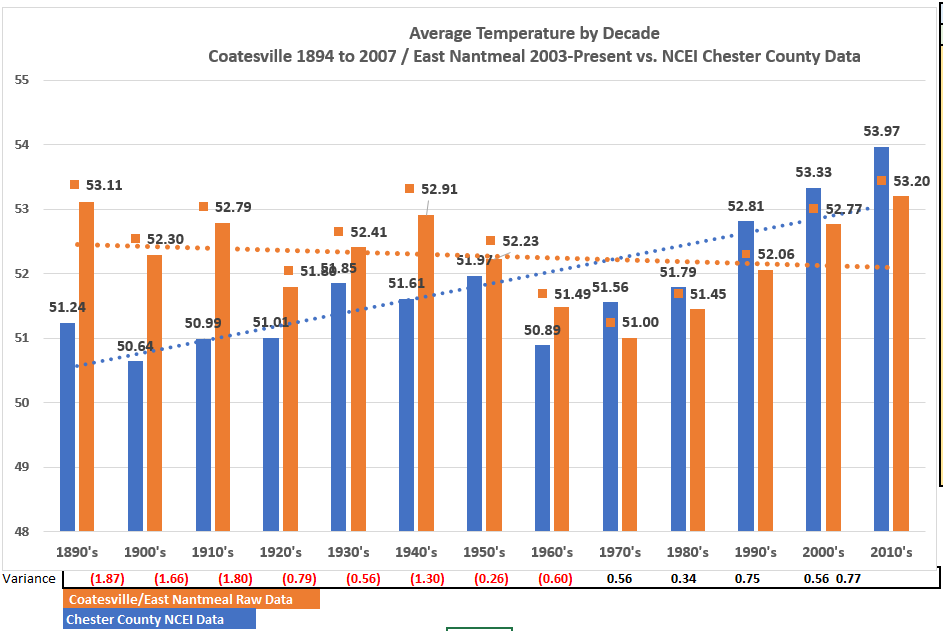
So let's correct your above with the actual raw data analysis below. What you call ChescoWx above let's break it into just the actual 3 stations (not the up to 24 stations we have in the actual data) Coatesville 1E / Coatesville 2W and East Nantmeal averaged together vs. the NCEI adjustments. You can clearly see the warming adjustment - now up to 0.77 degrees in the most recent complete decade! So they cooled the first 8 decades and warmed the last 4 - voila that gives you the blue warming line vs. the actual data not warming at all and in fact showing cooling.
-
4 hours ago, TheClimateChanger said:
It's important to note when people complain about adjustments to the temperature record, what they are really saying is that they want to use flawed data because it gives them a more favored result. Time of observation makes a HUGE difference, especially in the summertime when weather variance tends to be at an annual minimum. We know this, and we correct for it.
Time bias does not make a material difference as long as consistent obs are taken over 365 days - while making post observation chilling adjustments for 111 straight years and then warming the last 20 does not give anyone comfort in the data and trends is purports to show. I actually went back and recast my observations from 8pm to the current 24 hours for 3 years of data. The difference was less than 0.002 degrees.
-
Yesterday was the warmest day (65.1) in East Nantmeal since the 66.3 degree reading on November 9th. Other Chester County high temps yesterday included Atglen 65.2 / Chester Springs 66.7 / Devault 67.2 / Glenmoore 65.0 / Longwood 65.2 / Marshallton 67.8 / Warwick 67.9 and West Chester 66.7. Both today and tomorrow should be even a bit warmer but nowhere close to record levels before showers Friday and a turn to much colder weather next week.Records for today: 84 degrees at Glenmoore/Honey Brook / Chadds Ford and West Chester (1990) / Record Low 1 below zero Coatesville (1896) / Rain 3.24 Coatesville Airport KMQS (2010) / Snow 15.2" Coatesville during the Blizzard of 1993.
-
1 minute ago, TimB said:
You’ll stop at nothing to prove your stupid little agenda. Trust me, the last time someone will think about these records you’ve meticulously been keeping for decades will probably be about 3 years after you’re dead, maybe less. Is it even worth it?
You have to admit it is kind of strange that the NCEI had to adjust each and every year from 1895 for 111 years and then warm the last 20 to make that trend line look scary. However. I suspect you are right that some day all we will have is the adjusted post observation tweaks as the record. Data from the original observers will be deleted and forgotten and folks will never know what we did to the actual real data to make it so scary!!
-
3 minutes ago, TimB said:
72.7 to 73.3 is still warming.
LOL!!!! non statistical p-value over that long a period!!!
-
1
-
-
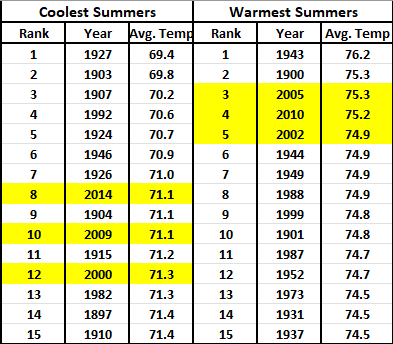
Since 1895 Coolest and Warmest Summers in Chester County PA - 3 of the coolest top 15 since 2000 and 3 of the top 5 warmest since 2000.....can you say cycles??
-
1 minute ago, TimB said:
This doesn’t belong in regional subforums. But good to see you admit that your flawed data and the NCEI data both show warming.
Nothing flawed in my all encompassing data LOL!! is all of the available actual non adjusted data and it shows no statistically significant warming at all....unless you apply the "post observation" NCEI adjustments!
-
1
-
-
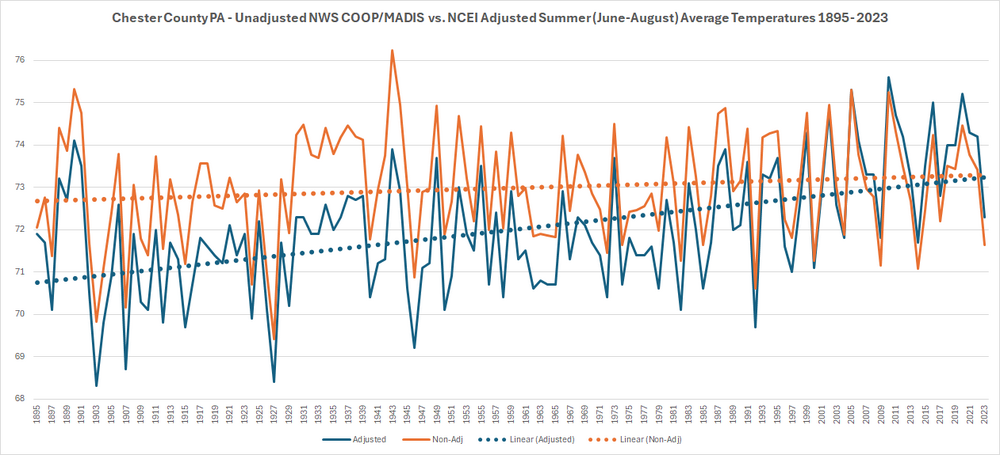
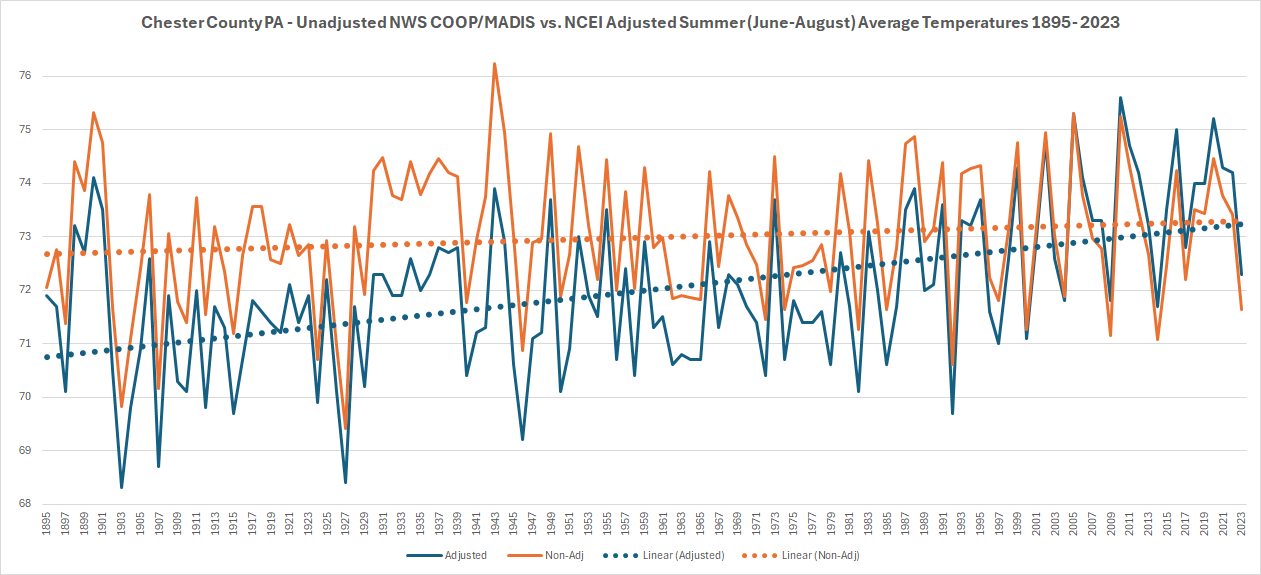
I have been working with the great folks at the Delaware Environmental Observing System (Thanks to Chris!!) to add even more weather observation points and stations across Chester County PA. With the updated data and summer coming I thought I would run an analysis of Summer (June-August) temperatures across the County from 1895 through last summer (now with 25 Chester County Stations at least partially in the data since 1895 and 15 current observation sites included). Overall in the non-adjusted data there is only as expected normal cyclical warm and cool cycles but I thought I would show you a comparison of the post observation adjustment applied by the the National Center of Environmental Information (NCEI) who have applied an incredible 111 consecutive years of post observation adjustments to chill the actual observations to each and every summer from 1895 through 2005 and have now every year since 2005 now applied a warming adjustment. As you can see in the trend lines the orange non-adjusted and blue adjusted paint a far different rate of our rate of warming. My friend Charlie will of course tell us these 111 straight years of cooling adjustments and now 20 years of warming are science based.....
-
I have been working with the great folks at the Delaware Environmental Observing System (Thanks to Chris!!) to add even more weather observation points and stations across Chester County PA. With the updated data and summer coming I thought I would run an analysis of Summer (June-August) temperatures across the County from 1895 through last summer (now with 25 Chester County Stations at least partially in the data since 1895 and 15 current observation sites included). Overall in the non-adjusted data there is only as expected normal cyclical warm and cool cycles but I thought I would show you a comparison of the post observation adjustment applied by the the National Center of Environmental Information (NCEI) who have applied 111 consecutive years of post observation adjustments to chill the actual observations to each and every summer from 1895 through 2005 and have every year since 2005 now applied a warming adjustment. As you can see in the trend lines the orange non-adjusted and blue adjusted paint a far different rate of our rate of warming.
Occasional Thoughts on Climate Change
in Climate Change
Posted